Cited by 109Genomics and Chromatin DynamicsFungal and yeast genetics researchNuclear Structure and Function

The DOI matches its Crossref record; 58 of the 58 references it cites were found in a registry or an index.

Cell Cycle–Specified Fluctuation of Nucleosome Occupancy at Gene Promoters

Open access

Abstract

The packaging of DNA into nucleosomes influences the accessibility of underlying regulatory information. Nucleosome occupancy and positioning are best characterized in the budding yeast Saccharomyces cerevisiae, albeit in asynchronous cell populations or on individual promoters such as PHO5 and GAL1-10. Using FAIRE (formaldehyde-assisted isolation of regulatory elements) and whole-genome microarrays, we examined changes in nucleosome occupancy throughout the mitotic cell cycle in synchronized populations of S. cerevisiae. Perhaps surprisingly, nucleosome occupancy did not exhibit large, global variation between cell cycle phases. However, nucleosome occupancy at the promoters of cell cycle-regulated genes was reduced specifically at the cell cycle phase in which that gene exhibited peak expression, with the notable exception of S-phase genes. We present data that establish FAIRE as a high-throughput method for assaying nucleosome occupancy. For the first time in any system, nucleosome occupancy was mapped genome-wide throughout the cell cycle. Fluctuation of nucleosome occupancy at promoters of most cell cycle-regulated genes provides independent evidence that periodic expression of these genes is controlled mainly at the level of transcription. The promoters of G2/M genes are distinguished from other cell cycle promoters by an unusually low baseline nucleosome occupancy throughout the cell cycle. This observation, coupled with the maintenance throughout the cell cycle of the stereotypic nucleosome occupancy states between coding and non-coding loci, suggests that the largest component of variation in nucleosome occupancy is "hard wired," perhaps at the level of DNA sequence.

Overview

The claims and statistics of this paper haven’t been checked yet.

Run the check — free, no account needed. It reads the open-access text and checks the sources it cites.

A few free checks a day · papers already verified open instantly · results are public

Integrity signals

Registry

Crossref · 10.1371/journal.pgen.0020158

Cites

58 of 58 references verified0 citation errors · 0 not checkable

Statistics

Figures

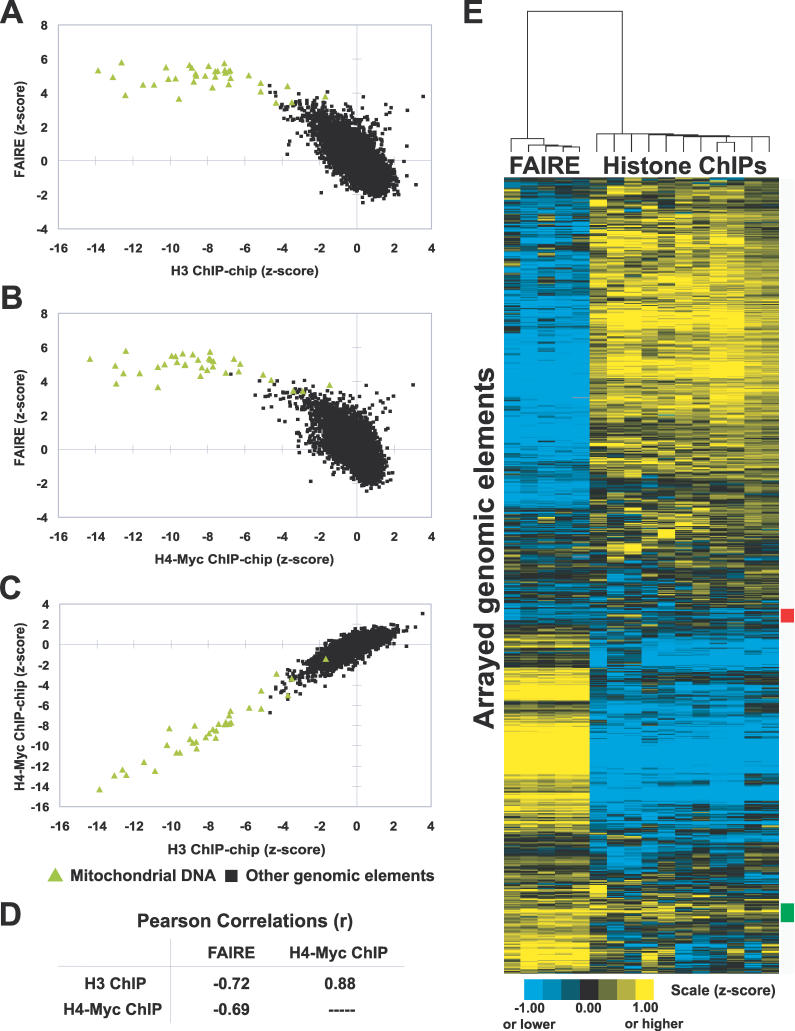
Figure 1 Inverse Correlation of FAIRE and Histone H3 and H4-myc ChIP-chip Data (A–C) Enrichment values from the indicated experiments were plotted. Green triangles indicate mitochondrial DNA probes, whereas black squares represent all other arrayed genomic segments. For FAIRE, data are derived from five biological replicates. The histone ChIP-chip data were previously published [20]. Individual arrays from FAIRE experiments and the histone ChIP-chips were transformed into z-scores, which controls for differences in variance between arrays by adjusting the standard deviation of each array to a value of 1. (D) Table of Pearson correlations between FAIRE and histone H3 and H4-myc ChIP-chip data. The significance of the correlations between FAIRE and histone ChIP-chip experiments was tested by randomly permuting the FAIRE data 1,000,000 times. A greater anti-correlation than was observed with unpermuted data was not achieved (empirical p < 1 × 10⁻⁶). (E) Hierarchical clustering by gene and by array was performed using the program Cluster [57]. All arrayed genomic elements were included. The 192 loci marked by the red box exhibit relative depletion in both FAIRE and histone ChIP-chip, but revealed no striking biases in terms of size, GC content, genomic location, or locus type (e.g., ORF, promoter, or telomeric). The 266 loci marked by the green box exhibit relative enrichment in both assays. They are mostly intergenic (76%), and of the ORFs present, 27.6% were dubious (versus 11.4% genome-wide). No other distinguishing features among the red or green groups could be identified. For all figures in this paper, although the scales are discontinuous, the data shown are continuous.
Figure 1 Inverse Correlation of FAIRE and Histone H3 and H4-myc ChIP-chip Data (A–C) Enrichment values from the indicated experiments were plotted. Green triangles indicate mitochondrial DNA probes, whereas black squares represent all other arrayed genomic segments. For FAIRE, data are derived from five biological replicates. The histone ChIP-chip data were previously published [20]. Individual arrays from FAIRE experiments and the histone ChIP-chips were transformed into z-scores, which controls for differences in variance between arrays by adjusting the standard deviation of each array to a value of 1. (D) Table of Pearson correlations between FAIRE and histone H3 and H4-myc ChIP-chip data. The significance of the correlations between FAIRE and histone ChIP-chip experiments was tested by randomly permuting the FAIRE data 1,000,000 times. A greater anti-correlation than was observed with unpermuted data was not achieved (empirical p < 1 × 10⁻⁶). (E) Hierarchical clustering by gene and by array was performed using the program Cluster [57]. All arrayed genomic elements were included. The 192 loci marked by the red box exhibit relative depletion in both FAIRE and histone ChIP-chip, but revealed no striking biases in terms of size, GC content, genomic location, or locus type (e.g., ORF, promoter, or telomeric). The 266 loci marked by the green box exhibit relative enrichment in both assays. They are mostly intergenic (76%), and of the ORFs present, 27.6% were dubious (versus 11.4% genome-wide). No other distinguishing features among the red or green groups could be identified. For all figures in this paper, although the scales are discontinuous, the data shown are continuous.CC BY · PubMed Central
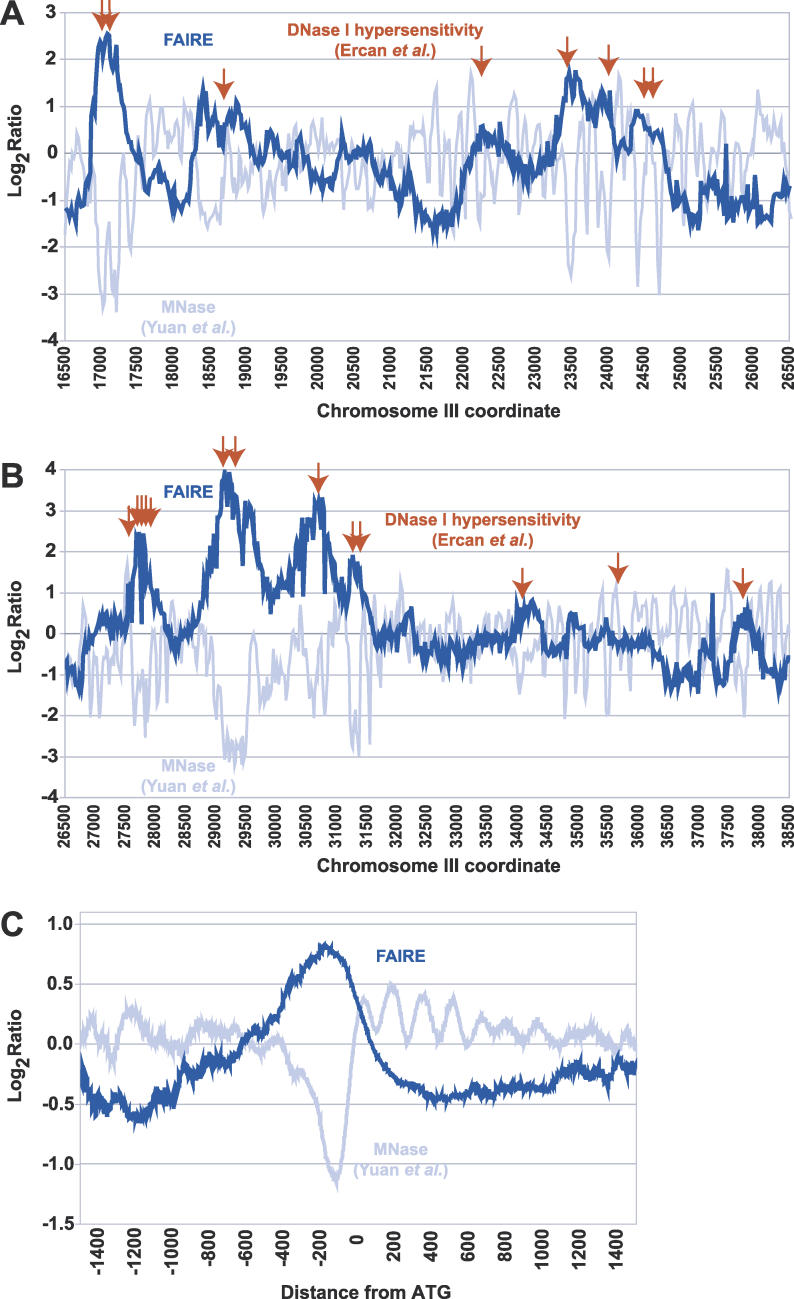
Figure 2 Peaks of FAIRE Enrichment Are Coincident with DNase I Hypersensitive Sites and NFRs (A) Raw data obtained through FAIRE (dark blue) and MNase treatment (light blue) [23] obtained from high-resolution tiling arrays are shown for a 10-kb region of Chromosome III (16500–26500). Red arrows represent previously mapped DNase I hypersensitivity sites [25]. (B) Same as (A), but for a 12-kb region on Chromosome III (26500–38500). (C) Data from tiling arrays were aligned by distance from start codon and averaged over 50-bp windows (step size = 1).
Figure 2 Peaks of FAIRE Enrichment Are Coincident with DNase I Hypersensitive Sites and NFRs (A) Raw data obtained through FAIRE (dark blue) and MNase treatment (light blue) [23] obtained from high-resolution tiling arrays are shown for a 10-kb region of Chromosome III (16500–26500). Red arrows represent previously mapped DNase I hypersensitivity sites [25]. (B) Same as (A), but for a 12-kb region on Chromosome III (26500–38500). (C) Data from tiling arrays were aligned by distance from start codon and averaged over 50-bp windows (step size = 1).CC BY · PubMed Central
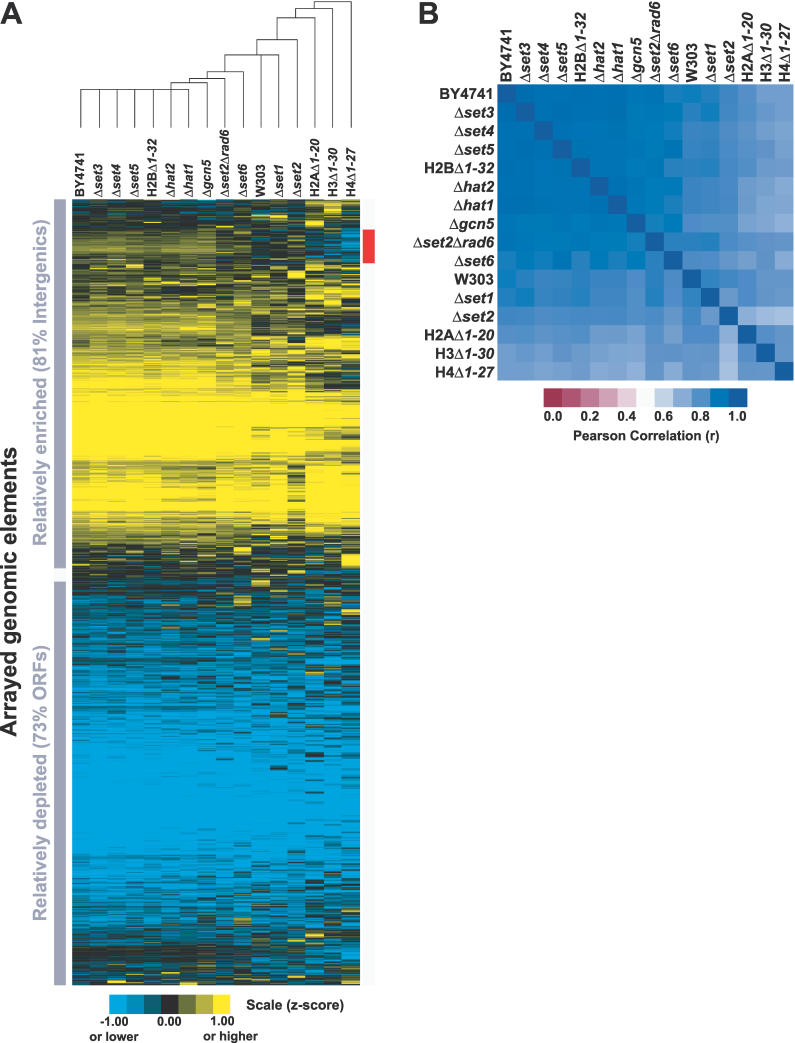
Figure 3 FAIRE Is Unaffected by Mutations in Genes Required for Specific Histone Modifications (A) Data are from FAIRE performed on 15 mutant strains and two wild-type strains. For each strain, normalized median log2 ratios from individual arrays were z-score transformed and averaged with biological replicates (Material and Methods). Hierarchical clustering by gene and by array was performed on all arrayed elements using Cluster [57]. The red bar indicates the 493 loci that segregate most differently in the histone tail deletion mutants. Nearly all of them (459/493, 93%) are intergenic regions. Of the 34 ORFs that differentially segregate, 12 are annotated as “dubious.” Analysis revealed no striking difference between the 493 loci and the rest of the genome with respect to GC content, and these loci are not enriched for subtelomeric or telomeric fragments. The expression level and rate of transcription of genes downstream of the intergenic loci were slightly lower than the genomic average. (B) The Pearson correlations of the FAIRE data from the 17 different mutant and wild-type strains.
Figure 3 FAIRE Is Unaffected by Mutations in Genes Required for Specific Histone Modifications (A) Data are from FAIRE performed on 15 mutant strains and two wild-type strains. For each strain, normalized median log2 ratios from individual arrays were z-score transformed and averaged with biological replicates (Material and Methods). Hierarchical clustering by gene and by array was performed on all arrayed elements using Cluster [57]. The red bar indicates the 493 loci that segregate most differently in the histone tail deletion mutants. Nearly all of them (459/493, 93%) are intergenic regions. Of the 34 ORFs that differentially segregate, 12 are annotated as “dubious.” Analysis revealed no striking difference between the 493 loci and the rest of the genome with respect to GC content, and these loci are not enriched for subtelomeric or telomeric fragments. The expression level and rate of transcription of genes downstream of the intergenic loci were slightly lower than the genomic average. (B) The Pearson correlations of the FAIRE data from the 17 different mutant and wild-type strains.CC BY · PubMed Central
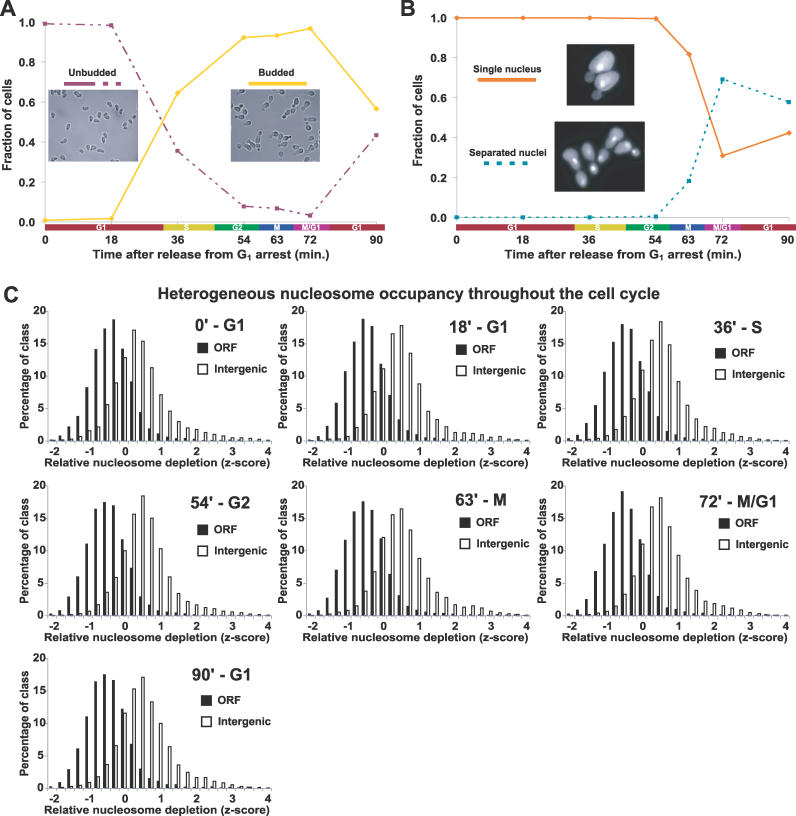
Figure 4 The Global Pattern of Nucleosome Occupancy Is Maintained throughout the Cell Cycle (A) To validate synchrony of cell cycle arrest and release, cells were scored as unbudded (G1) or budded (other phase) using brightfield images of every time point from each time course as described (Material and Methods). Each image represents one of the plotted groups, as indicated. Although the data shown were derived from a single time course, all time courses exhibit similar synchrony and growth. For a representative time course, Northern blots were performed using probes to CLN2 and the HHT transcripts, which also confirmed cell cycle synchrony and progression (unpublished data). (B) Same as (A), except cells from each time point were stained with DAPI. Each yeast cell was scored as having a single nucleus (pre-mitotic) or separated nuclei (post-mitotic). Greater than 90% arrest in late G1 at the time of release was achieved for all cultures. Note that although the cells from the first time point (time 0) were arrested in G1, they were in a physiological state distinct from natural G1 as the result of induction of α-factor–responsive genes. (C) The distribution of z-scores for SGD-annotated ORFs and intergenic non-coding segments plotted for each cell cycle time point. Each histogram is represented by all biological replicates collected at that time point. The approximate cell cycle phase is given next to the time after release from G1 arrest. For our analysis, normalized median log2 ratios from each array were transformed into z-scores to control for differences in variance between arrays, followed by calculation of mean z-scores for all biological replicates (Material and Methods).
Figure 4 The Global Pattern of Nucleosome Occupancy Is Maintained throughout the Cell Cycle (A) To validate synchrony of cell cycle arrest and release, cells were scored as unbudded (G1) or budded (other phase) using brightfield images of every time point from each time course as described (Material and Methods). Each image represents one of the plotted groups, as indicated. Although the data shown were derived from a single time course, all time courses exhibit similar synchrony and growth. For a representative time course, Northern blots were performed using probes to CLN2 and the HHT transcripts, which also confirmed cell cycle synchrony and progression (unpublished data). (B) Same as (A), except cells from each time point were stained with DAPI. Each yeast cell was scored as having a single nucleus (pre-mitotic) or separated nuclei (post-mitotic). Greater than 90% arrest in late G1 at the time of release was achieved for all cultures. Note that although the cells from the first time point (time 0) were arrested in G1, they were in a physiological state distinct from natural G1 as the result of induction of α-factor–responsive genes. (C) The distribution of z-scores for SGD-annotated ORFs and intergenic non-coding segments plotted for each cell cycle time point. Each histogram is represented by all biological replicates collected at that time point. The approximate cell cycle phase is given next to the time after release from G1 arrest. For our analysis, normalized median log2 ratios from each array were transformed into z-scores to control for differences in variance between arrays, followed by calculation of mean z-scores for all biological replicates (Material and Methods).CC BY · PubMed Central
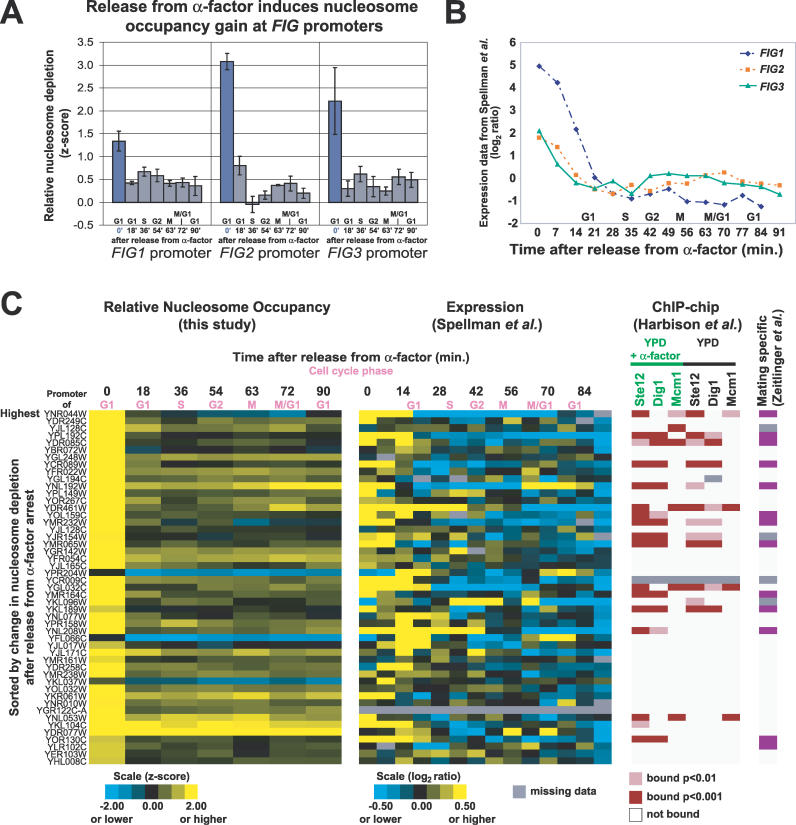
Figure 5 Release from Mating Pheromone Induces Increased Nucleosome Occupancy at FIG1, FIG2, and FIG3 Promoters (A) Relative nucleosome depletion at the FIG1, FIG2, and FIG3 promoters upon release from mating pheromone. Plotted values are z-scores derived from FAIRE data. At 0 min, cells are in α-factor–induced arrest. Error bars are ± SEM. (B) Previously obtained expression data for FIG1, FIG2, and FIG3 after release from α-factor [30]. (C) Promoters exhibiting a large increase in nucleosome occupancy after release from α-factor are shown (FAIRE z-score decrease greater than 1), with corresponding gene expression data [30] and ChIP-chip data [40]. In the far-right column, a purple box indicates that a downstream gene was characterized as mating specific by Zeitlinger et al. [39].
Figure 5 Release from Mating Pheromone Induces Increased Nucleosome Occupancy at FIG1, FIG2, and FIG3 Promoters (A) Relative nucleosome depletion at the FIG1, FIG2, and FIG3 promoters upon release from mating pheromone. Plotted values are z-scores derived from FAIRE data. At 0 min, cells are in α-factor–induced arrest. Error bars are ± SEM. (B) Previously obtained expression data for FIG1, FIG2, and FIG3 after release from α-factor [30]. (C) Promoters exhibiting a large increase in nucleosome occupancy after release from α-factor are shown (FAIRE z-score decrease greater than 1), with corresponding gene expression data [30] and ChIP-chip data [40]. In the far-right column, a purple box indicates that a downstream gene was characterized as mating specific by Zeitlinger et al. [39].CC BY · PubMed Central
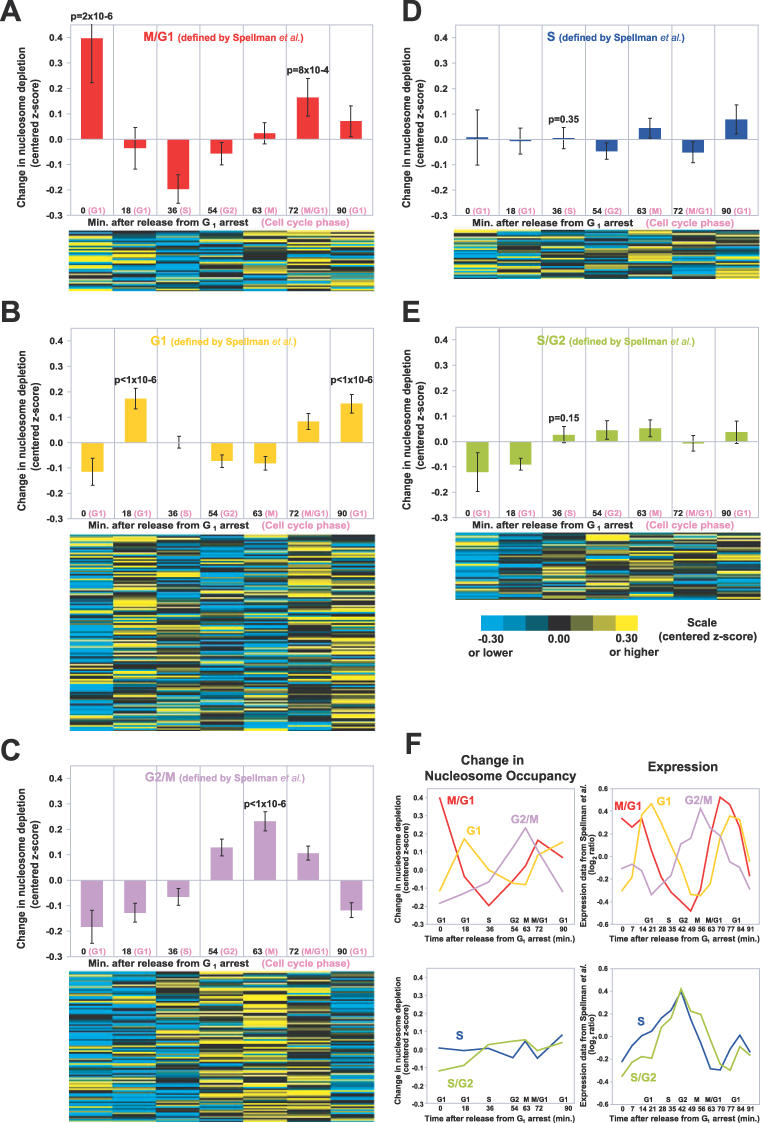
Figure 6 Nucleosome Occupancy at Cell Cycle–Regulated Promoters Varies with the Cell Cycle (A) In the upper panel, the mean of centered z-scores were plotted for the promoters of M/G1 genes (as defined by [30]). Only the unidirectional promoters of cell cycle–regulated genes were analyzed. The error bars are ± SEM. The p-values for peaks were derived from 1,000,000 permutations on data from the unidirectional promoters (Material and Methods). In the lower panel, data from the individual promoters are shown. The promoters are ordered according to the timing of their expression in the cell cycle [30]. (B) Same as (A), but for G1 promoters. (C) Same as (A), but for G2/M promoters. (D) Same as (A), but for S promoters. (E) Same as (A), but for S/G2 promoters. (F) The average chromatin profiles derived from FAIRE data (left), plotted alongside the average expression profiles from Spellman et al. (right) [30].
Figure 6 Nucleosome Occupancy at Cell Cycle–Regulated Promoters Varies with the Cell Cycle (A) In the upper panel, the mean of centered z-scores were plotted for the promoters of M/G1 genes (as defined by [30]). Only the unidirectional promoters of cell cycle–regulated genes were analyzed. The error bars are ± SEM. The p-values for peaks were derived from 1,000,000 permutations on data from the unidirectional promoters (Material and Methods). In the lower panel, data from the individual promoters are shown. The promoters are ordered according to the timing of their expression in the cell cycle [30]. (B) Same as (A), but for G1 promoters. (C) Same as (A), but for G2/M promoters. (D) Same as (A), but for S promoters. (E) Same as (A), but for S/G2 promoters. (F) The average chromatin profiles derived from FAIRE data (left), plotted alongside the average expression profiles from Spellman et al. (right) [30].CC BY · PubMed Central
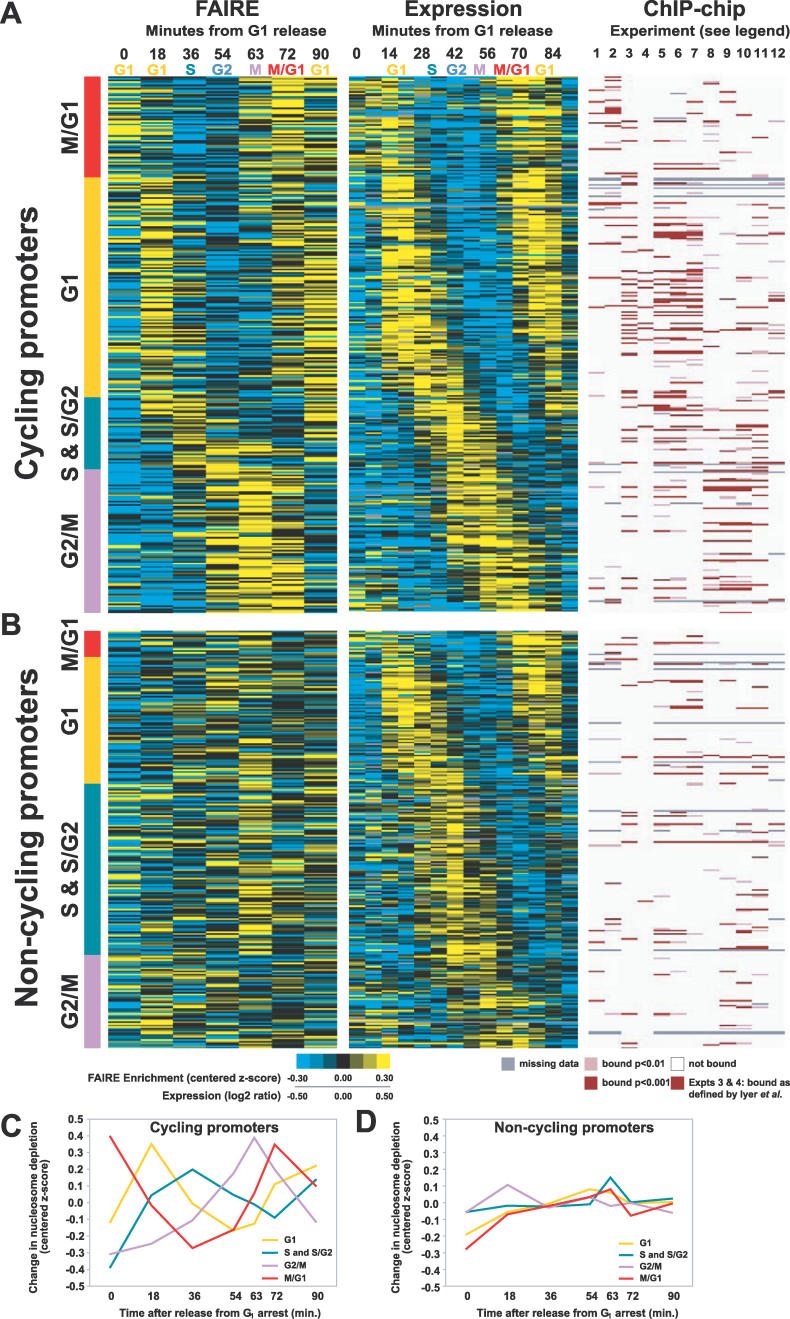
Figure 7 Classification of Cell Cycle–Regulated Promoters For panels (A) and (B), the approximate cell cycle stage corresponding to each time point in the FAIRE and expression [30] time course is listed along the top. ChIP-chip experiments are numbered 1 through 12 as follows (1) Ace2, (2) Swi5, (3) SBF, (4) MBF, (5) Swi4, (6) Swi6, (7) Mbp1, (8) Mcm1, (9) Ndd1, (10) Fkh2, (11) Fkh1, and (12) Stb1. For experiments 3 and 4 [42], a red bar indicates binding as defined by the authors. For experiments 1, 2, and 5–12 [40], a dark bar indicates binding at p < 0.001, a lighter bar indicates binding at p < 0.01. White indicates a lack of binding, and missing data are indicated by gray. Each cell cycle promoter was classified into the “cycling” or “non-cycling” group based on visual inspection of its nucleosome occupancy profile. All loci in this figure and their classifications can be found in Table S1. (A) Promoters with FAIRE signals that fluctuated with the cell cycle (proportion cycling: G1, 63%; S & S/G2, 30%; G2/M, 61%; and M/G1, 79%). For the FAIRE experiments, yellow indicates enrichment, blue depletion. For expression, yellow indicates high relative expression, blue low. (B) Promoters with FAIRE signals that did not fluctuate with the cell cycle. (C) The average chromatin profiles derived from FAIRE data for cycling promoters and (D) non-cycling promoters.
Figure 7 Classification of Cell Cycle–Regulated Promoters For panels (A) and (B), the approximate cell cycle stage corresponding to each time point in the FAIRE and expression [30] time course is listed along the top. ChIP-chip experiments are numbered 1 through 12 as follows (1) Ace2, (2) Swi5, (3) SBF, (4) MBF, (5) Swi4, (6) Swi6, (7) Mbp1, (8) Mcm1, (9) Ndd1, (10) Fkh2, (11) Fkh1, and (12) Stb1. For experiments 3 and 4 [42], a red bar indicates binding as defined by the authors. For experiments 1, 2, and 5–12 [40], a dark bar indicates binding at p < 0.001, a lighter bar indicates binding at p < 0.01. White indicates a lack of binding, and missing data are indicated by gray. Each cell cycle promoter was classified into the “cycling” or “non-cycling” group based on visual inspection of its nucleosome occupancy profile. All loci in this figure and their classifications can be found in Table S1. (A) Promoters with FAIRE signals that fluctuated with the cell cycle (proportion cycling: G1, 63%; S & S/G2, 30%; G2/M, 61%; and M/G1, 79%). For the FAIRE experiments, yellow indicates enrichment, blue depletion. For expression, yellow indicates high relative expression, blue low. (B) Promoters with FAIRE signals that did not fluctuate with the cell cycle. (C) The average chromatin profiles derived from FAIRE data for cycling promoters and (D) non-cycling promoters.CC BY · PubMed Central
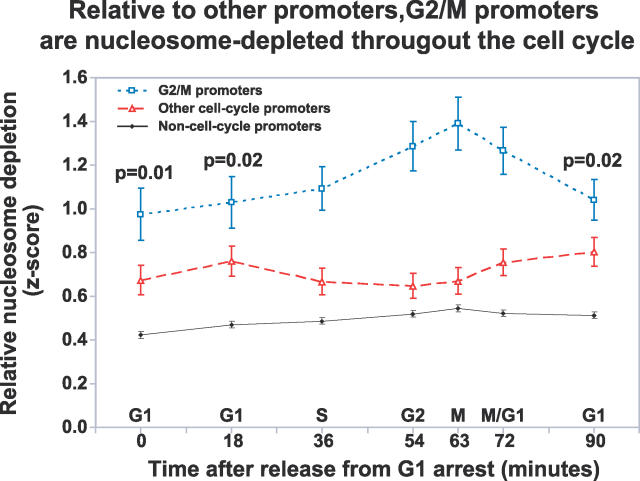
Figure 8 Relative to Other Promoters, G2/M Promoters Are Nucleosome Depleted throughout the Cell Cycle. The broken blue line indicates the mean z-score of FAIRE enrichment of unidirectional G2/M promoters at each time point throughout the cell-cycle. The mean of all other cell cycle unidirectional promoters (broken red line) and non–cell cycle promoters (solid black line) are also shown. The error bars indicate ± SEM. The p-values for the significance of the difference between the blue and red lines were derived from 1,000,000 permutations of the data (Material and Methods). The p-values for 0, 18, and 90 are relevant since they represent “baseline” occupancy (time points comprising the peak were all less than 0.0002.)
Figure 8 Relative to Other Promoters, G2/M Promoters Are Nucleosome Depleted throughout the Cell Cycle. The broken blue line indicates the mean z-score of FAIRE enrichment of unidirectional G2/M promoters at each time point throughout the cell-cycle. The mean of all other cell cycle unidirectional promoters (broken red line) and non–cell cycle promoters (solid black line) are also shown. The error bars indicate ± SEM. The p-values for the significance of the difference between the blue and red lines were derived from 1,000,000 permutations of the data (Material and Methods). The p-values for 0, 18, and 90 are relevant since they represent “baseline” occupancy (time points comprising the peak were all less than 0.0002.)CC BY · PubMed Central
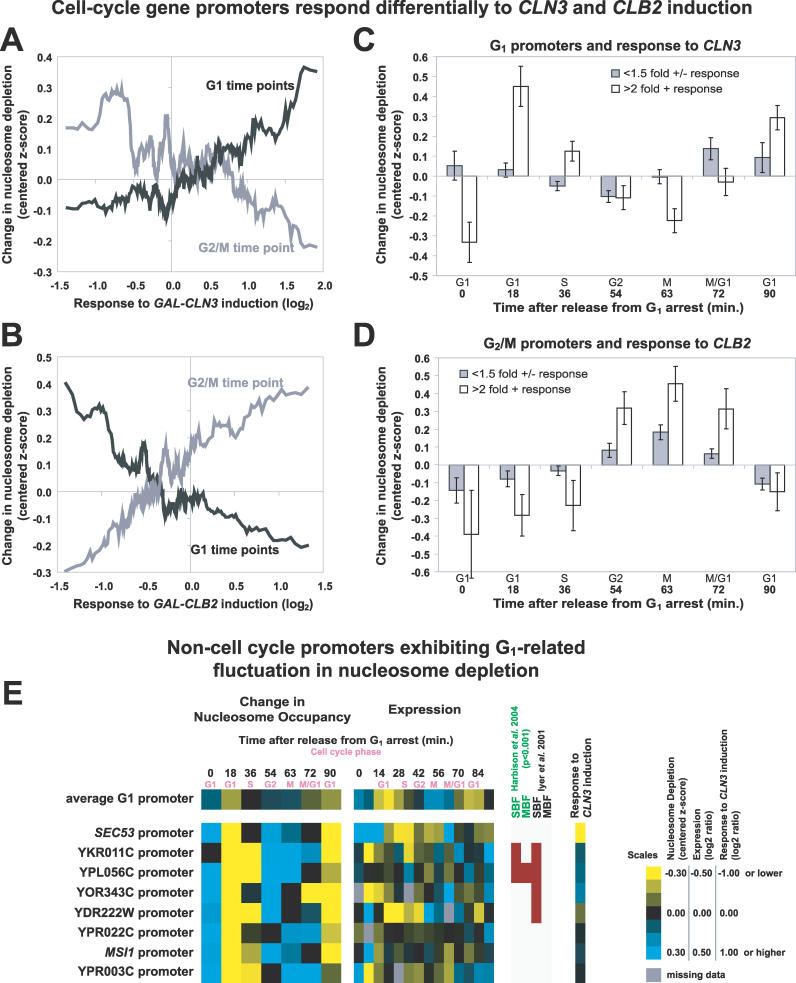
Figure 9 Relationship between Cyclin Induction and Changes in Nucleosome Depletion at the Promoters of Cell Cycle–Regulated Genes (A) Genes with unidirectional promoters were ordered according to their response to CLN3 induction [30]. The moving average of the response of the corresponding genes to CLN3 induction is plotted on the x-axis (window = 25, step = 1), whereas y-axis values represent the moving average of FAIRE enrichment (centered z-scores, window = 25, step 1) at the indicated time points (G1 in black, 18 and 90 min; G2/M in gray, 63 min). Therefore, positive y-axis values indicate nucleosome depletion. (B) Same as (A) but for CLB2 induction. (C) Unidirectional promoters of G1 genes were grouped by response to GAL-CLN3 induction (filled bars, greater than 2-fold change; open bars, less than 1.5-fold). The mean of the centered z-scores was plotted. The error bars are ± SEM. (D) Same as (C), but for G2/M gene promoters grouped by response to GAL-CLB2 induction. (E) Examples of promoters upstream of genes not previously annotated as cell cycle–regulated that exhibited G1-related fluctuation in nucleosome depletion are shown alongside corresponding gene expression data [30] and ChIP-chip data for G1 transcription factors [40,42].
Figure 9 Relationship between Cyclin Induction and Changes in Nucleosome Depletion at the Promoters of Cell Cycle–Regulated Genes (A) Genes with unidirectional promoters were ordered according to their response to CLN3 induction [30]. The moving average of the response of the corresponding genes to CLN3 induction is plotted on the x-axis (window = 25, step = 1), whereas y-axis values represent the moving average of FAIRE enrichment (centered z-scores, window = 25, step 1) at the indicated time points (G1 in black, 18 and 90 min; G2/M in gray, 63 min). Therefore, positive y-axis values indicate nucleosome depletion. (B) Same as (A) but for CLB2 induction. (C) Unidirectional promoters of G1 genes were grouped by response to GAL-CLN3 induction (filled bars, greater than 2-fold change; open bars, less than 1.5-fold). The mean of the centered z-scores was plotted. The error bars are ± SEM. (D) Same as (C), but for G2/M gene promoters grouped by response to GAL-CLB2 induction. (E) Examples of promoters upstream of genes not previously annotated as cell cycle–regulated that exhibited G1-related fluctuation in nucleosome depletion are shown alongside corresponding gene expression data [30] and ChIP-chip data for G1 transcription factors [40,42].CC BY · PubMed Central

Verification

Claims the paper makes

The claims and statistics of this paper haven’t been checked yet.

Run the check — free, no account needed. It reads the open-access text and checks the sources it cites.

A few free checks a day · papers already verified open instantly · results are public

Claims other papers make about this one

Each is checked against this paper’s own text: does it say what the citing paper says it does?

Self-check

Percentages, sums and reported differences re-computed from the paper’s own numbers.

The self-check needs the paper’s full text.

Citations

Cites

Show all 58 references

Cited by

Sorted by citations

See all 109

Metadata

Authors
Hogan, G. J., Lee, C.-K., & Lieb, J. D.
Affiliations
University of North Carolina at Chapel Hill (US)
Corresponding author
Lieb, Jason D
Venue
PLoS Genetics
Published
2006-09-22
Volume
2
Issue
9
Pages
e158
ISSN
  • 1553-7390 (ISSN-L)
  • 1553-7404
OpenAlex
W1983386103
Cited by
109
References
58
Citations by year
2025: 2 · 2022: 2 · 2020: 3 · 2019: 3 · 2018: 4 · 2017: 4 · 2016: 8 · 2015: 3 · 2014: 10 · 2013: 7 · 2012: 7
FWCI
4.08
Type
journal article
Language
en
Open access
Locations
  • PLoS Genetics (publishedVersion, cc-by)
  • Europe PMC (PubMed Central) (publishedVersion, cc-by)
  • PubMed (publishedVersion)
  • DOAJ (DOAJ: Directory of Open Access Journals) (submittedVersion)
  • Figshare (submittedVersion, cc-by)
Funders
  • Frances C. and William P. Smallwood Foundation
  • National Institutes of Health
  • National Institute of General Medical Sciences (GM 072518, R01GM072518)
Topics
  • Life Sciences › Biochemistry, Genetics and Molecular Biology › Molecular Biology › Genomics and Chromatin Dynamics
  • Life Sciences › Biochemistry, Genetics and Molecular Biology › Molecular Biology › Fungal and yeast genetics research
  • Life Sciences › Biochemistry, Genetics and Molecular Biology › Molecular Biology › Nuclear Structure and Function
Keywords
nucleosome occupancy, cell cycle, promoter, Saccharomyces cerevisiae, FAIRE, mitotic cycle, cell cycle-regulated genes, transcriptional regulation, DNA accessibility, nucleosome positioning, genome-wide mapping
MeSH terms
Cell Cycle, Genes, Fungal, Histones, Lipoproteins, Mitosis, Molecular Sequence Data, Mutation, Nucleosomes, Pheromones, Promoter Regions, Genetic, Saccharomyces cerevisiae, Cell Adhesion Molecules, G1 Phase, G2 Phase, S Phase, Cyclins, Cyclin B, Saccharomyces cerevisiae Proteins, Microarray Analysis

About these checks

Registry, retraction, Cites and statistics results are computed, not judged, with one exception: a printed reference that no index lists is read once by a model before it counts as a citation error. Claims are extracted by a model and kept only when their quote appears verbatim in the text; each cited source is then checked, with a model’s help, for whether it says what the claim relies on. Those verdicts can be wrong — read the claim’s quote and the cited source before relying on one.

Statistics and arithmetic are recomputed, not judged.

Confidence bands are shown only for fields calibrated on our annotated test set. None is calibrated yet, so no band is shown.

What counts as a claim ›How we measure confidence ›How we check this ›

Are you an author, or do you see a problem with this page? Request a review