

The DOI matches its Crossref record; 41 of the 41 references it cites were found in a registry or an index.
Zelda Binding in the Early Drosophila melanogaster Embryo Marks Regions Subsequently Activated at the Maternal-to-Zygotic Transition
Open accessAbstract
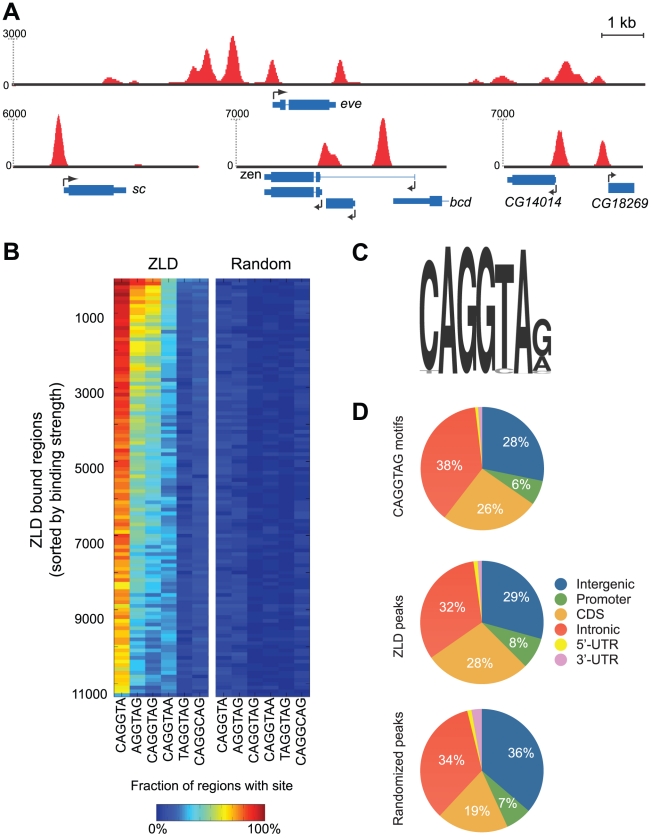
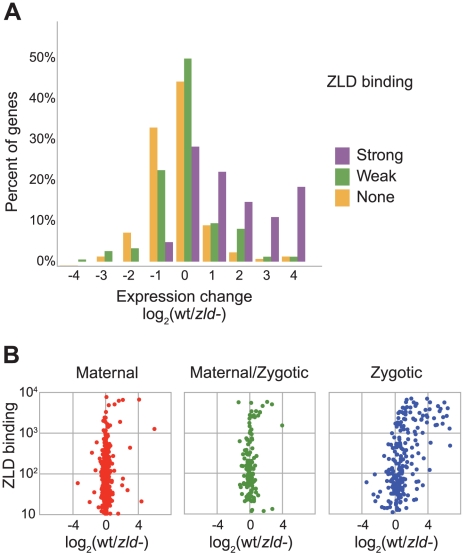
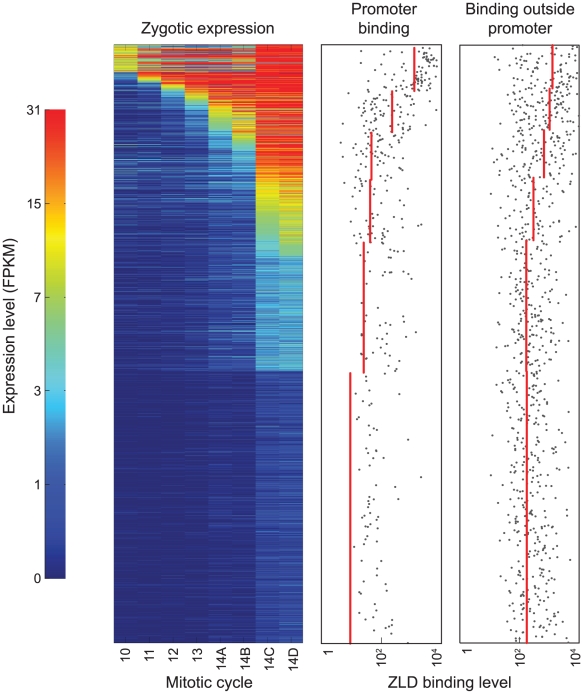
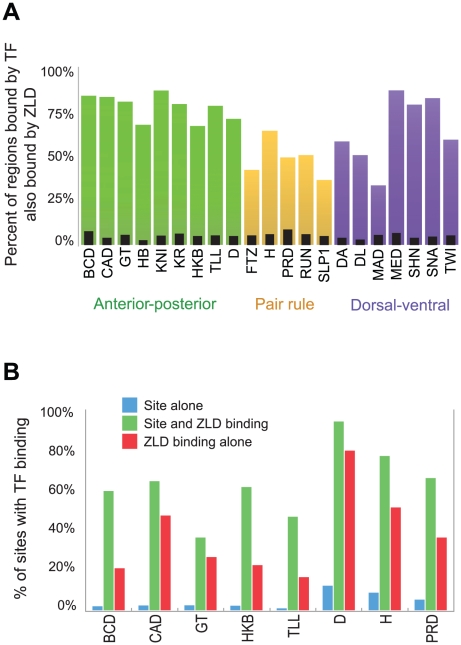
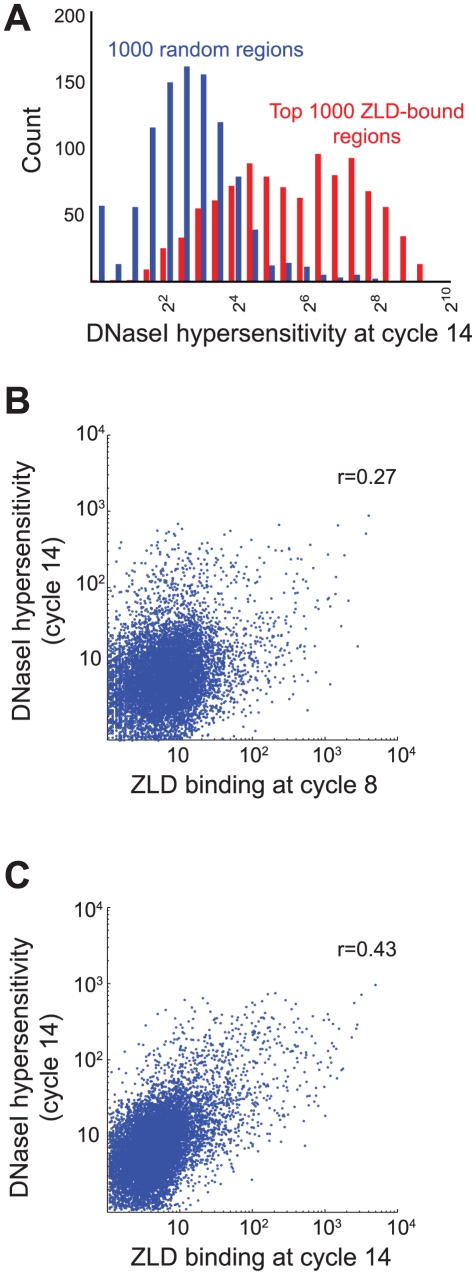
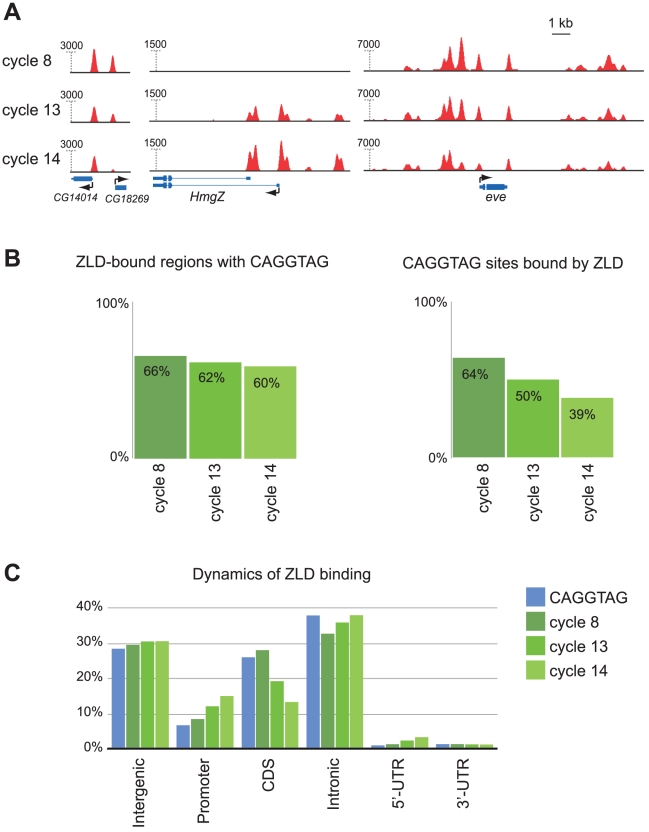
The earliest stages of development in most metazoans are driven by maternally deposited proteins and mRNAs, with widespread transcriptional activation of the zygotic genome occurring hours after fertilization, at a period known as the maternal-to-zygotic transition (MZT). In Drosophila, the MZT is preceded by the transcription of a small number of genes that initiate sex determination, patterning, and other early developmental processes; and the zinc-finger protein Zelda (ZLD) plays a key role in their transcriptional activation. To better understand the mechanisms of ZLD activation and the range of its targets, we used chromatin immunoprecipitation coupled with high-throughput sequencing (ChIP-Seq) to map regions bound by ZLD before (mitotic cycle 8), during (mitotic cycle 13), and after (late mitotic cycle 14) the MZT. Although only a handful of genes are transcribed prior to mitotic cycle 10, we identified thousands of regions bound by ZLD in cycle 8 embryos, most of which remain bound through mitotic cycle 14. As expected, early ZLD-bound regions include the promoters and enhancers of genes transcribed at this early stage. However, we also observed ZLD bound at cycle 8 to the promoters of roughly a thousand genes whose first transcription does not occur until the MZT and to virtually all of the thousands of known and presumed enhancers bound at cycle 14 by transcription factors that regulate patterned gene activation during the MZT. The association between early ZLD binding and MZT activity is so strong that ZLD binding alone can be used to identify active promoters and regulatory sequences with high specificity and selectivity. This strong early association of ZLD with regions not active until the MZT suggests that ZLD is not only required for the earliest wave of transcription but also plays a major role in activating the genome at the MZT.
Overview
The claims and statistics of this paper haven’t been checked yet.
Run the check — free, no account needed. It reads the open-access text and checks the sources it cites.
Integrity signals
Registry
Cites
Statistics
Figures
Verification
Claims the paper makes
The claims and statistics of this paper haven’t been checked yet.
Run the check — free, no account needed. It reads the open-access text and checks the sources it cites.
Claims other papers make about this one
Each is checked against this paper’s own text: does it say what the citing paper says it does?
The source backs part of the claim, not all of it — or backs it for a different population, condition or comparison.
In the citing paper
“In Drosophila, the Zinc Finger Early Drosophila Activator (Zelda) is critical for lowering the nucleosome barrier at enhancers for genes driving zygotic gene activation [33–35].”
From Transcriptional enhancers and their communication with gene promoters (2021) · cites this paper as [34]
Experimental — accuracy not yet measured
Self-check
Percentages, sums and reported differences re-computed from the paper’s own numbers.
The self-check needs the paper’s full text.
Citations
Cites
Ultrafast and memory-efficient alignment of short DNA sequences to the human genome.
Langmead, B., Trapnell, C., Pop, M., & Salzberg, S. L. (2009) · Genome Biology · doi:10.1186/gb-2009-10-3-r25 · Cited by 21,849
A bivalent chromatin structure marks key developmental genes in embryonic stem cells
Bernstein, B. E., Mikkelsen, T. S., Xie, X., Kamal, M., Huebert, D. J., Cuff, J., Fry, B., Meissner, A., Wernig, M., Plath, K., et al. (2006) · Cell · doi:10.1016/j.cell.2006.02.041 · Cited by 5,361
Fitting a mixture model by expectation maximization to discover motifs in biopolymers.
Bailey, T. L., & Elkan, C. (1994) · PubMed · Cited by 4,982
Genome-wide maps of chromatin state in pluripotent and lineage-committed cells
Mikkelsen, T. S., Ku, M., Jaffe, D. B., Issac, B., Lieberman, E., Giannoukos, G., Alvarez, P., Brockman, W., Kim, T.-K., Koche, R. P., et al. (2007) · Nature · doi:10.1038/nature06008 · Cited by 4,129
A unique chromatin signature uncovers early developmental enhancers in humans
Rada-Iglesias, A., Bajpai, R., Swigut, T., Brugmann, S. A., Flynn, R. A., & Wysocka, J. (2011) · Nature · doi:10.1038/nature09692 · Cited by 2,233
Identification of Functional Elements and Regulatory Circuits by Drosophila modENCODE
Roy, S., Ernst, J., Kharchenko, P. V., Kheradpour, P., Nègre, N., Eaton, M. L., Landolin, J. M., Bristow, C. A., Ma, L., Lin, M. F., et al. (2010) · Science · doi:10.1126/science.1198374 · Cited by 1,242
The maternal-to-zygotic transition: a play in two acts
Tadros, W., & Lipshitz, H. D. (2009) · Development · doi:10.1242/dev.033183 · Cited by 1,226
Opening of Compacted Chromatin by Early Developmental Transcription Factors HNF3 (FoxA) and GATA-4
Cirillo, L. A., Lin, F. R., Cuesta, I., Friedman, D., Jarník, M., & Zaret, K. S. (2002) · Molecular Cell · doi:10.1016/s1097-2765(02)00459-8 · Cited by 1,188
Controlling the elongation phase of transcription with P-TEFb
Peterlin, B. M., & Price, D. H. (2006) · Molecular Cell · doi:10.1016/j.molcel.2006.06.014 · Cited by 1,144
Foe, V. E., & Alberts, B. (1983) · Journal of Cell Science · doi:10.1242/jcs.61.1.31 · Cited by 1,056
Cited by
Sorted by citations
Items 101–200 of 336
Holmqvist, P.-H., Boija, A., Philip, P., Crona, F., Stenberg, P., & Mannervik, M. (2012) · PLoS Genetics · doi:10.1371/journal.pgen.1002769 · Cited by 49
Cdc25 and the importance of G2control
Kimelman, D. (2014) · Cell Cycle · doi:10.4161/cc.29537 · Cited by 48
A general approach for discriminative de novo motif discovery from high-throughput data
Grau, J., Posch, S., Große, I., & Keilwagen, J. (2013) · Nucleic Acids Research · doi:10.1093/nar/gkt831 · Cited by 48
Genomic insights into chromatin reprogramming to totipotency in embryos
Ladstätter, S., & Tachibana, K.-E. K. (2018) · The Journal of Cell Biology · doi:10.1083/jcb.201807044 · Cited by 49
Koromila, T., Gao, F., Iwasaki, Y., He, P., Pachter, L. S., Gergen, J. P., & Stathopoulos, A. (2020) · eLife · doi:10.7554/elife.59610 · Cited by 48
Transcription factors perform a 2-step search of the nucleus
Staller, M. V. (2022) · Genetics · doi:10.1093/genetics/iyac111 · Cited by 52
Rushlow, C. A., & Shvartsman, S. Y. (2012) · Current Opinion in Genetics & Development · doi:10.1016/j.gde.2012.08.005 · Cited by 48
Co-activation of microRNAs by Zelda is essential for early Drosophila development
Fu, S., Nien, C.-Y., Liang, H.-L., & Rushlow, C. A. (2014) · Development · doi:10.1242/dev.108118 · Cited by 49
Hamm, D. C., Larson, E. D., Nevil, M., Marshall, K. E., Bondra, E. R., & Harrison, M. M. (2017) · PLoS Genetics · doi:10.1371/journal.pgen.1007120 · Cited by 46
Self-citationLarson, E. D., Komori, H., Gibson, T. J., Ostgaard, C. M., Hamm, D. C., Schnell, J., Lee, C., & Harrison, M. M. (2021) · Nature Communications · doi:10.1038/s41467-021-27506-y · Cited by 47
Self-citationSignal Integration by Shadow Enhancers and Enhancer Duplications Varies across the Drosophila Embryo
Scholes, C., Biette, K. M., Harden, T. T., & DePace, A. H. (2019) · Cell Reports · doi:10.1016/j.celrep.2019.01.115 · Cited by 44
Transcriptional Pre-patterning of Drosophila Gastrulation
Lim, B., Levine, M., & Yamazaki, Y. (2017) · Current Biology · doi:10.1016/j.cub.2016.11.047 · Cited by 44
In situ dissection of domain boundaries affect genome topology and gene transcription in Drosophila
Arzate-Mejía, R. G., Cerecedo-Castillo, A. J., Guerrero, G., Furlan-Magaril, M., & Recillas-Targa, F. (2019) · Nature Communications · doi:10.1038/s41467-020-14651-z · Cited by 36
CBP and Gcn5 drive zygotic genome activation independently of their catalytic activity
Ciabrelli, F., Rabbani, L., Cardamone, F., Zenk, F. L., Löser, E., Schächtle, M., Mazina, M. Y., Loubière, V., & Iovino, N. (2023) · Science Advances · doi:10.1126/sciadv.adf2687 · Cited by 44
Dual functions of TAF7L in adipocyte differentiation
Zhou, H., Kaplan, T., Li, Y., Grubisic, I., Zhang, Z., Wang, P. J., Eisen, M. B., & Tjian, R. (2013) · eLife · doi:10.7554/elife.00170 · Cited by 49
Self-citationComputational Identification of Diverse Mechanisms Underlying Transcription Factor-DNA Occupancy
Cheng, Q., Kazemian, M., Pham, H., Blatti, C. A., Celniker, S., Wolfe, S. A., Brodsky, M. H., & Sinha, S. (2013) · PLoS Genetics · doi:10.1371/journal.pgen.1003571 · Cited by 45
Regulation of DNA Replication in Early Embryonic Cleavages
Kermi, C., Furno, E. L., & Maiorano, D. (2017) · Genes · doi:10.3390/genes8010042 · Cited by 45
Hamm, D. C., Bondra, E. R., & Harrison, M. M. (2014) · Journal of Biological Chemistry · doi:10.1074/jbc.m114.602292 · Cited by 41
Self-citationTranscriptional Enhancers in Drosophila
Small, S., & Arnosti, D. N. (2020) · Genetics · doi:10.1534/genetics.120.301370 · Cited by 44
Bicoid gradient formation and function in the Drosophila pre-syncytial blastoderm
Ali-Murthy, Z., & Kornberg, T. B. (2016) · eLife · doi:10.7554/elife.13222 · Cited by 41
Patterns of chromatin accessibility along the anterior-posterior axis in the early Drosophila embryo
Haines, J. E., & Eisen, M. B. (2018) · PLoS Genetics · doi:10.1371/journal.pgen.1007367 · Cited by 41
Self-citationTranscriptional precision and accuracy in development: from measurements to models and mechanisms
Bentovim, L., Harden, T. T., & DePace, A. H. (2017) · Development · doi:10.1242/dev.146563 · Cited by 41
Regulation of the BMP Signaling-Responsive Transcriptional Network in the Drosophila Embryo
Deignan, L., Pinheiro, M. T., Sutcliffe, C., Saunders, A., Wilcockson, S. G., Zeef, L. A. H., Donaldson, I. J., & Ashe, H. L. (2016) · PLoS Genetics · doi:10.1371/journal.pgen.1006164 · Cited by 39
Cho, C.-Y., & O’Farrell, P. H. (2023) · Nature Communications · doi:10.1038/s41467-023-40485-6 · Cited by 39
Pires, C. V., Freitas, F. C. D. P., Cristino, A. S., Dearden, P. K., & Simões, Z. L. P. (2016) · PLoS ONE · doi:10.1371/journal.pone.0146447 · Cited by 37
Blatti, C. A., Kazemian, M., Wolfe, S. A., Brodsky, M., & Sinha, S. (2015) · Nucleic Acids Research · doi:10.1093/nar/gkv195 · Cited by 36
Chromatin-linked determinants of zygotic genome activation
Østrup, O., Andersen, I. S., & Collas, P. (2012) · Cellular and Molecular Life Sciences · doi:10.1007/s00018-012-1143-x · Cited by 35
A Link between Deoxyribonucleotide Metabolites and Embryonic Cell-Cycle Control
Liu, B., Winkler, F., Herde, M., Witte, C., & Großhans, J. (2019) · Current Biology · doi:10.1016/j.cub.2019.02.021 · Cited by 34
Evolution and multiple roles of the Pancrustacea specific transcription factor zelda in insects
Ribeiro, L., Santos, V. T., dos Santos, D. D. G., Antunes, F., Feltran, G. D. S., Souza‐Menezes, J., Aravind, L., Venâncio, T. M., & da Fonseca, R. N. (2017) · PLoS Genetics · doi:10.1371/journal.pgen.1006868 · Cited by 35
Spatial organization of transcribing loci during early genome activation in Drosophila
Huang, S.-K., Whitney, P. H., Dutta, S., Shvartsman, S. Y., & Rushlow, C. A. (2021) · Current Biology · doi:10.1016/j.cub.2021.09.027 · Cited by 36
Mechanisms of Interaction between Enhancers and Promoters in Three Drosophila Model Systems
Kyrchanova, O., Sokolov, V., & Georgiev, P. G. (2023) · International Journal of Molecular Sciences · doi:10.3390/ijms24032855 · Cited by 32
Quantitative Modeling of a Gene's Expression from Its Intergenic Sequence
Samee, M. A. H., & Sinha, S. (2014) · PLoS Computational Biology · doi:10.1371/journal.pcbi.1003467 · Cited by 34
Developmental Transcriptional Enhancers: A Subtle Interplay between Accessibility and Activity
Bozek, M., & Gompel, N. (2020) · BioEssays · doi:10.1002/bies.201900188 · Cited by 32
Gibson, T. J., Larson, E. D., & Harrison, M. M. (2024) · Nature Structural & Molecular Biology · doi:10.1038/s41594-024-01231-8 · Cited by 32
Self-citationA Fully Synthetic Transcriptional Platform for a Multicellular Eukaryote
Crocker, J., Tsai, A., & Stern, D. L. (2017) · Cell Reports · doi:10.1016/j.celrep.2016.12.025 · Cited by 33
Coordinating transcription and replication to mitigate their conflicts in early Drosophila embryos
Cho, C.-Y., Kemp, J. P., Duronio, R. J., & O’Farrell, P. H. (2022) · Cell Reports · doi:10.1016/j.celrep.2022.111507 · Cited by 29
Zygotic Genome Activators, Developmental Timing, and Pluripotency
Onichtchouk, D., & Driever, W. (2016) · Current topics in developmental biology/Current Topics in Developmental Biology · doi:10.1016/bs.ctdb.2015.12.004 · Cited by 30
Animal Cognition: An End to Insight?
Seed, A. M., & Boogert, N. J. (2013) · Current Biology · doi:10.1016/j.cub.2012.11.043 · Cited by 28
Dynamic modulation of enhancer responsiveness by core promoter elements in living Drosophila embryos
Yokoshi, M., Kawasaki, K., Cambón, M., & Fukaya, T. (2021) · Nucleic Acids Research · doi:10.1093/nar/gkab1177 · Cited by 28
The role of Dichaete in transcriptional regulation during Drosophila embryonic development
Aleksic, J., Ferrero, E. A., Fischer, B., Shen, S. P., & Russell, S. R. H. (2013) · BMC Genomics · doi:10.1186/1471-2164-14-861 · Cited by 28
The Xenopus Maternal-to-Zygotic Transition from the Perspective of the Germline
Yang, J., Aguero, T. H., & King, M. L. (2015) · Current topics in developmental biology/Current Topics in Developmental Biology · doi:10.1016/bs.ctdb.2015.07.021 · Cited by 32
Simulations of Enhancer Evolution Provide Mechanistic Insights into Gene Regulation
Duque, T. S. P. C., Samee, M. A. H., Kazemian, M., Pham, H., Brodsky, M. H., & Sinha, S. (2013) · Molecular Biology and Evolution · doi:10.1093/molbev/mst170 · Cited by 27
Nair, S. J., Suter, T., Wang, S. S., Lu, Y., Yang, F., & Rosenfeld, M. G. (2022) · Trends in Genetics · doi:10.1016/j.tig.2022.05.015 · Cited by 27
Critical Timing without a Timer for Embryonic Development
Tufcea, D. E., & François, P. (2015) · Biophysical Journal · doi:10.1016/j.bpj.2015.08.024 · Cited by 26
Sequential Regulation of Maternal mRNAs through a Conserved cis-Acting Element in Their 3′ UTRs
Flora, P., Wong-Deyrup, S. W., Martin, E. T., Palumbo, R. J., Nasrallah, M. A., Oligney, A., Blatt, P., Patel, D., Fuchs, G., & Rangan, P. (2018) · Cell Reports · doi:10.1016/j.celrep.2018.12.007 · Cited by 26
Moshe, A., & Kaplan, T. (2017) · Epigenetics & Chromatin · doi:10.1186/s13072-017-0141-5 · Cited by 28
Self-citationAwakening of the zygotic genome by pioneer transcription factors
Kobayashi, W., & Tachibana, K.-E. K. (2021) · Current Opinion in Structural Biology · doi:10.1016/j.sbi.2021.05.013 · Cited by 26
From mother to embryo: A molecular perspective on zygotic genome activation
Wu, E., & Vastenhouw, N. L. (2020) · Current topics in developmental biology/Current Topics in Developmental Biology · doi:10.1016/bs.ctdb.2020.02.002 · Cited by 28
Dynamic interplay between non-coding enhancer transcription and gene activity in development
Hamamoto, K., Umemura, Y., Makino, S., & Fukaya, T. (2023) · Nature Communications · doi:10.1038/s41467-023-36485-1 · Cited by 25
Setting the stage for development: the maternal-to-zygotic transition in Drosophila
Harrison, M. M., Marsh, A. J., & Rushlow, C. A. (2023) · Genetics · doi:10.1093/genetics/iyad142 · Cited by 25
Self-citationNevil, M., Gibson, T. J., Bartolutti, C., Iyengar, A., & Harrison, M. M. (2020) · Development · doi:10.1242/dev.185009 · Cited by 25
Self-citationKuang, Y., Golan, O., Preuße, K., Cain, B., Christensen, C. J., Salomone, J. R., Campbell, I., Okwubido-Williams, F. V., Hass, M. R., Yuan, Z., et al. (2020) · eLife · doi:10.7554/elife.53659 · Cited by 23
Lamparter, D., Marbach, D., Rueedi, R., Bergmann, S., & Kutalik, Z. (2017) · PLoS Computational Biology · doi:10.1371/journal.pcbi.1005311 · Cited by 23
Information theoretical methods for complex network structure reconstruction
Lemus, E. H., & Siqueiros-Garcia, J. M. (2013) · Complex Adaptive Systems Modeling · doi:10.1186/2194-3206-1-8 · Cited by 23
Transcriptional Regulation During Zygotic Genome Activation in Zebrafish and Other Anamniote Embryos
Wragg, J. W., & Müller, F. (2016) · Advances in genetics · doi:10.1016/bs.adgen.2016.05.001 · Cited by 25
Cell Cycle Remodeling and Zygotic Gene Activation at the Midblastula Transition
Zhang, M., Skirkanich, J., Lampson, M. A., & Klein, P. S. (2016) · Advances in experimental medicine and biology · doi:10.1007/978-3-319-46095-6_9 · Cited by 23
Formation, interpretation, and regulation of the Drosophila Dorsal/NF-κB gradient
Schloop, A. E., Bandodkar, P. U., & Reeves, G. T. (2019) · Current topics in developmental biology/Current Topics in Developmental Biology · doi:10.1016/bs.ctdb.2019.11.007 · Cited by 23
Marsh, A. J., Пирогов, С. А., Kaur, Y., Ruffridge, A. J., Sajwan, S., Gibson, T. J., Hunt, G., Harrison, M. M., & Mannervik, M. (2024) · Molecular Cell · doi:10.1016/j.molcel.2025.05.009 · Cited by 22
Self-citationEvaluating thermodynamic models of enhancer activity on cellular resolution gene expression data
Samee, M. A. H., & Sinha, S. (2013) · Methods · doi:10.1016/j.ymeth.2013.03.005 · Cited by 24
Genome-wide measurement of spatial expression in patterning mutants of Drosophila melanogaster
Combs, P. A., & Eisen, M. B. (2017) · F1000Research · doi:10.12688/f1000research.9720.1 · Cited by 23
Self-citationLefebvre, F. A., & Lécuyer, É. (2018) · Journal of Developmental Biology · doi:10.3390/jdb6010005 · Cited by 22
Duque, T. S. P. C., & Sinha, S. (2015) · Genome Biology and Evolution · doi:10.1093/gbe/evv080 · Cited by 21
Chromatin dynamics at the maternal to zygotic transition: recent advances from the zebrafish model
Akdogan‐Ozdilek, B., Duval, K. L., & Goll, M. G. (2020) · F1000Research · doi:10.12688/f1000research.21809.1 · Cited by 21
CCAT: Combinatorial Code Analysis Tool for transcriptional regulation
Jiang, P., & Singh, M. (2013) · Nucleic Acids Research · doi:10.1093/nar/gkt1302 · Cited by 21
Rise and SINE: roles of transcription factors and retrotransposons in zygotic genome activation
Kravchenko, P., & Tachibana, K.-E. K. (2024) · Nature Reviews Molecular Cell Biology · doi:10.1038/s41580-024-00772-6 · Cited by 22
Birnie, A., Plat, A., Korkmaz, C., & Bothma, J. P. (2023) · Current Biology · doi:10.1016/j.cub.2023.04.005 · Cited by 21
Link of Zygotic Genome Activation and Cell Cycle Control
Liu, B., & Großhans, J. (2017) · Methods in molecular biology · doi:10.1007/978-1-4939-6988-3_2 · Cited by 20
Jia, L., Umezawa, K. Y., Scott, T., & Small, S. (2019) · Molecular Cell · doi:10.1016/j.molcel.2019.06.038 · Cited by 21
Pearson, J. C., Watson, J. D., & Crews, S. T. (2012) · Developmental Biology · doi:10.1016/j.ydbio.2012.04.001 · Cited by 20
Canalizing cell fate by transcriptional repression
Lim, B., Domsch, K., Mall, M., & Lohmann, I. (2024) · Molecular Systems Biology · doi:10.1038/s44320-024-00014-z · Cited by 19
Lighting up the central dogma for predictive developmental biology
García, H. G., Berrocal, A., Kim, Y. J., Martini, G. D., & Zhao, J. (2019) · Current topics in developmental biology/Current Topics in Developmental Biology · doi:10.1016/bs.ctdb.2019.10.010 · Cited by 19
Messina, O., Raynal, F., Gurgo, J., Fiche, J.-B., Pancaldi, V., & Nöllmann, M. (2023) · Nature Communications · doi:10.1038/s41467-023-42485-y · Cited by 19
Liu, J., & Ma, J. (2013) · PLoS ONE · doi:10.1371/journal.pone.0062641 · Cited by 19
Fernandes, G., Tran, H., Andrieu, M., Diaw, Y., Perez-Romero, C. A., Fradin, C., Coppey, M., Walczak, A. M., & Dostatni, N. (2022) · eLife · doi:10.7554/elife.74509 · Cited by 20
Predicting Ancestral Segmentation Phenotypes from Drosophila to Anopheles Using In Silico Evolution
Rothschild, J., Tsimiklis, P., Siggia, E. D., & François, P. (2016) · PLoS Genetics · doi:10.1371/journal.pgen.1006052 · Cited by 18
Dynamic patterning by morphogens illuminated by cis-regulatory studies
Irizarry, J., & Stathopoulos, A. (2021) · Development · doi:10.1242/dev.196113 · Cited by 19
The diverging epigenomic landscapes of honeybee queens and workers revealed by multiomic sequencing
Zhang, Y., He, X. J., Barron, A. B., Li, Z., Jin, M. J., Wang, Z. L., Huang, Q., Zhang, L. Z., Wu, X. B., Yan, W., et al. (2023) · Insect Biochemistry and Molecular Biology · doi:10.1016/j.ibmb.2023.103929 · Cited by 17
Initiation of diverse epigenetic states during nuclear programming of the Drosophila body plan
Boija, A., & Mannervik, M. (2016) · Proceedings of the National Academy of Sciences · doi:10.1073/pnas.1516450113 · Cited by 17
Ghotbi, E., Ye, P., Ervin, T., Kum, A., Benes, J. J., & Jones, R. S. (2021) · Science Advances · doi:10.1126/sciadv.abg1556 · Cited by 17
Hunt, G., Vaid, R., Пирогов, С. А., Pfab, A., Ziegenhain, C., Sandberg, R., Reimegård, J., & Mannervik, M. (2024) · Genome biology · doi:10.1186/s13059-023-03135-0 · Cited by 16
Broadly expressed repressors integrate patterning across orthogonal axes in embryos
Koromila, T., & Stathopoulos, A. (2017) · Proceedings of the National Academy of Sciences · doi:10.1073/pnas.1703001114 · Cited by 18
The Role of Chromatin Accessibility in cis-Regulatory Evolution
Peng, P.-C., Khoueiry, P., Girardot, C., Reddington, J. P., Garfield, D. A., Furlong, E. E. M., & Sinha, S. (2019) · Genome Biology and Evolution · doi:10.1093/gbe/evz103 · Cited by 19
Functional regulatory evolution outside of the minimal even-skipped stripe 2 enhancer
Crocker, J., & Stern, D. L. (2017) · Development · doi:10.1242/dev.149427 · Cited by 16
Setting up for gastrulation: D. melanogaster
Stathopoulos, A., & Newcomb, S. (2019) · Current topics in developmental biology/Current Topics in Developmental Biology · doi:10.1016/bs.ctdb.2019.11.004 · Cited by 16
CLAMP regulates zygotic genome activation in Drosophila embryos
Colonnetta, M. M., Abrahante, J. E., Schedl, P. D., Gohl, D. M., & Deshpande, G. (2021) · Genetics · doi:10.1093/genetics/iyab107 · Cited by 16
Darbo, É., Herrmann, C., Lecuit, T., Thieffry, D., & van Helden, J. (2013) · BMC Genomics · doi:10.1186/1471-2164-14-226 · Cited by 18
Fungal Genes in Context: Genome Architecture Reflects Regulatory Complexity and Function
Noble, L. M., & Andrianopoulos, A. (2013) · Genome Biology and Evolution · doi:10.1093/gbe/evt077 · Cited by 16
Stanney, W., Ladam, F., Donaldson, I. J., Parsons, T. J., Maehr, R., Bobola, N., & Sagerström, C. G. (2019) · Developmental Biology · doi:10.1016/j.ydbio.2019.12.003 · Cited by 15
A timer gene network is spatially regulated by the terminal system in the Drosophila embryo
Clark, E., Battistara, M., & Benton, M. A. (2022) · eLife · doi:10.7554/elife.78902 · Cited by 15
lncRNA read-through regulates the BX-C insulator Fub-1
Ibragimov, A. N., Bing, X., Shidlovskii, Y. V., Levine, M., Georgiev, P. G., & Schedl, P. D. (2023) · eLife · doi:10.7554/elife.84711 · Cited by 14
Genome folding and zygotic genome activation in mammalian preimplantation embryos
Bondarieva, A., & Tachibana, K.-E. K. (2024) · Current Opinion in Genetics & Development · doi:10.1016/j.gde.2024.102268 · Cited by 15
Larson, E. D., Komori, H., Fitzpatrick, Z. A., Krabbenhoft, S. D., Lee, C., & Harrison, M. M. (2022) · G3 Genes Genomes Genetics · doi:10.1093/g3journal/jkac159 · Cited by 14
Self-citationKim, Y., Hafner, A., Ishihara, K., Fitzgerald, K. M., Deplancke, B., Papatsenko, D., & Shvartsman, S. Y. (2013) · Chaos An Interdisciplinary Journal of Nonlinear Science · doi:10.1063/1.4808157 · Cited by 14
Comparing mRNA levels using in situ hybridization of a target gene and co-stain
Wunderlich, Z., Bragdon, M. D. J., & DePace, A. H. (2014) · Methods · doi:10.1016/j.ymeth.2014.01.003 · Cited by 14
De novo recruitment of Polycomb-group proteins in Drosophila embryos
Abed, J. A., Ghotbi, E., Ye, P., Frolov, A., Benes, J. J., & Jones, R. S. (2018) · Development · doi:10.1242/dev.165027 · Cited by 14
Distinct Roles of Broadly Expressed Repressors Support Dynamic Enhancer Action and Change in Time
Koromila, T., & Stathopoulos, A. (2019) · Cell Reports · doi:10.1016/j.celrep.2019.06.063 · Cited by 14
A fine kinetic balance of interactions directs transcription factor hubs to genesPreprint
Fallacaro, S., Mukherjee, A., Ratchasanmuang, P., Zinski, J. M., Haloush, Y. I., Shankta, K., & Mir, M. (2024) · bioRxiv (Cold Spring Harbor Laboratory) · doi:10.1101/2024.04.16.589811 · Cited by 15
Hoermann, A., Cicin-Sain, D., & Jaeger, J. (2016) · Developmental Biology · doi:10.1016/j.ydbio.2016.01.005 · Cited by 13
Giannios, P., & Tsitilou, S. G. (2013) · Biochemical and Biophysical Research Communications · doi:10.1016/j.bbrc.2013.07.071 · Cited by 12
Transcriptional Timers Regulating Mitosis in Early Drosophila Embryos
Momen-Roknabadi, A., Talia, S. D., & Wieschaus, E. F. (2016) · Cell Reports · doi:10.1016/j.celrep.2016.08.034 · Cited by 13
Metadata
- Authors
- Harrison, M. M., Li, X.-Y., Kaplan, T., Botchan, M. R., & Eisen, M. B.
- Affiliations
- University of California, Berkeley (US)
- QB3 (US)
- Corresponding author
- Eisen, Michael B.
- Venue
- PLoS Genetics
- Publisher
- Public Library of Science (PLoS)
- Published
- 2011-10-20
- Volume
- 7
- Issue
- 10
- Pages
- e1002266
- ISSN
- 1553-7390 (ISSN-L)
- 1553-7404
- PMC
- PMC3197655
- OpenAlex
- W2004533772
- Cited by
- 338
- References
- 41
- Citations by year
- 2026: 14 · 2025: 17 · 2024: 23 · 2023: 23 · 2022: 20 · 2021: 27 · 2020: 23 · 2019: 26 · 2018: 24 · 2017: 31 · 2016: 20 · 2015: 22 · 2014: 20 · 2013: 28 · 2012: 18
- FWCI
- 8.84
- Type
- journal article
- Language
- en
- Open access
- gold
- doi.org
- Locations
- PLoS Genetics (publishedVersion, cc-by)
- Europe PMC (PubMed Central) (publishedVersion, cc-by)
- PubMed Central (publishedVersion, cc-by)
- PubMed (publishedVersion)
- DOAJ (DOAJ: Directory of Open Access Journals) (submittedVersion, cc-by-sa)
- Figshare (submittedVersion, cc-by)
- Funders
- Howard Hughes Medical Institute
- National Institutes of Health (CA30490)
- National Human Genome Research Institute (HG002779, R01HG002779)
- National Cancer Institute (R37 CA3049, R37CA030490)
- Topics
- Life Sciences › Biochemistry, Genetics and Molecular Biology › Molecular Biology › Genomics and Chromatin Dynamics
- Life Sciences › Biochemistry, Genetics and Molecular Biology › Molecular Biology › Developmental Biology and Gene Regulation
- Life Sciences › Biochemistry, Genetics and Molecular Biology › Molecular Biology › Epigenetics and DNA Methylation
- Keywords
- Zelda, maternal-to-zygotic transition, Drosophila melanogaster embryo, transcriptional activation, enhancer binding, promoter binding, mitotic cycle, chromatin binding, sex determination
- MeSH terms
- Animals, Drosophila melanogaster, Female, Mitosis, Nuclear Proteins, Promoter Regions, Genetic, Protein Binding, Transcription Factors, Transcription, Genetic, Zygote, Transcriptional Activation, Genome, Gene Expression Regulation, Developmental, Body Patterning, Sex Determination Processes, Drosophila Proteins, Embryonic Development, Chromatin Immunoprecipitation
About these checks
Registry, retraction, Cites and statistics results are computed, not judged, with one exception: a printed reference that no index lists is read once by a model before it counts as a citation error. Claims are extracted by a model and kept only when their quote appears verbatim in the text; each cited source is then checked, with a model’s help, for whether it says what the claim relies on. Those verdicts can be wrong — read the claim’s quote and the cited source before relying on one.
Statistics and arithmetic are recomputed, not judged.
Confidence bands are shown only for fields calibrated on our annotated test set. None is calibrated yet, so no band is shown.
What counts as a claim ›How we measure confidence ›How we check this ›
Are you an author, or do you see a problem with this page? Request a review
