

The DOI matches its Crossref record; 59 of the 60 references it cites were found in a registry or an index.
Loss of ATRX, Genome Instability, and an Altered DNA Damage Response Are Hallmarks of the Alternative Lengthening of Telomeres Pathway
Open accessAbstract
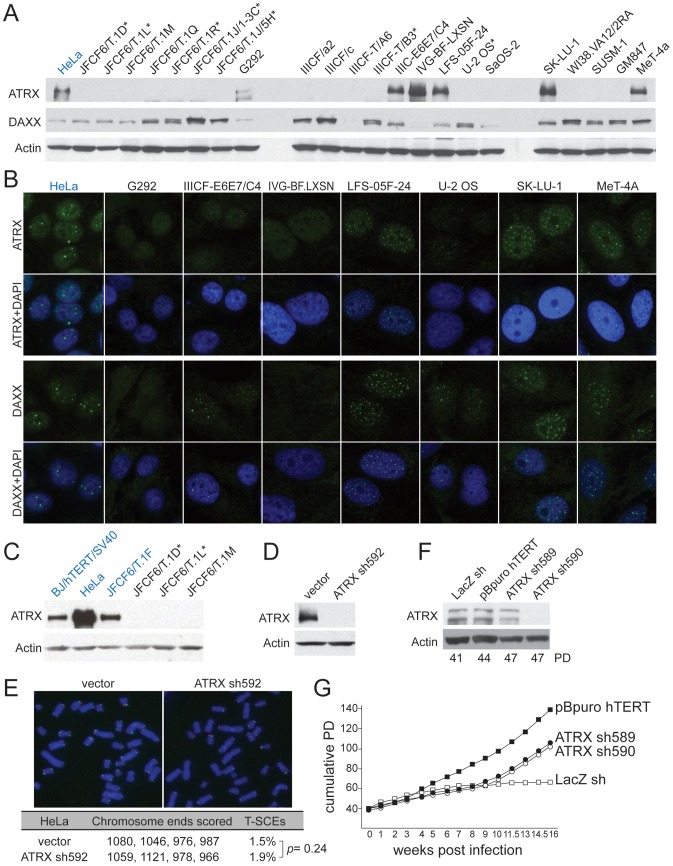
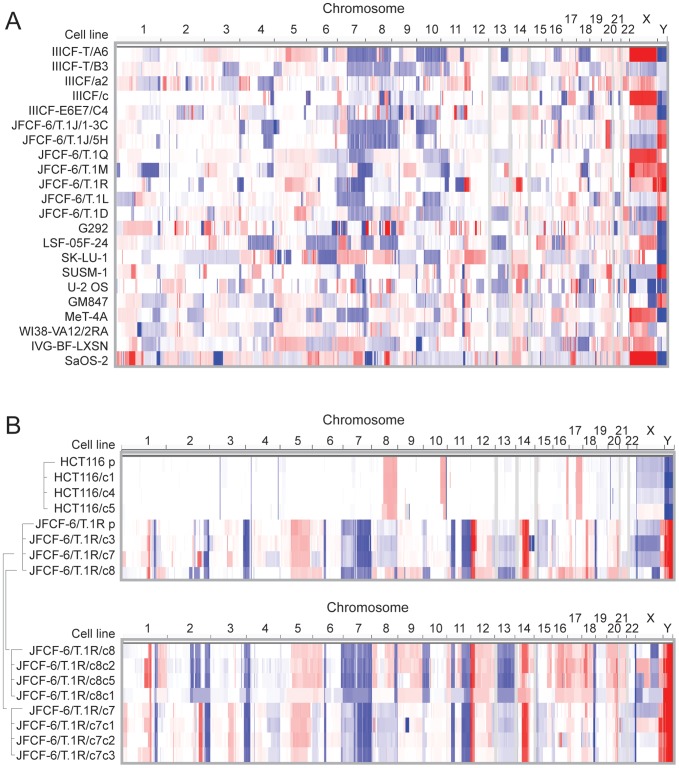
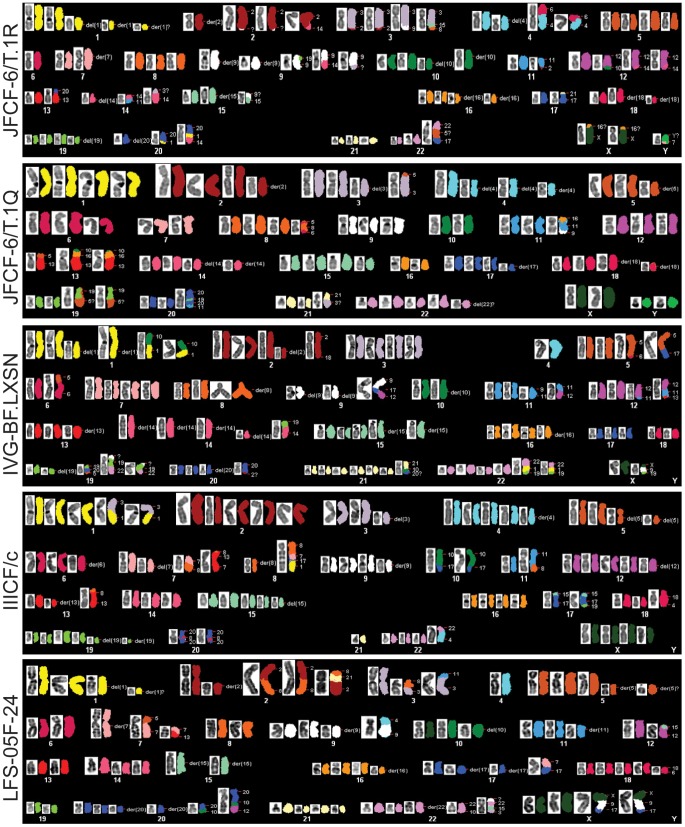
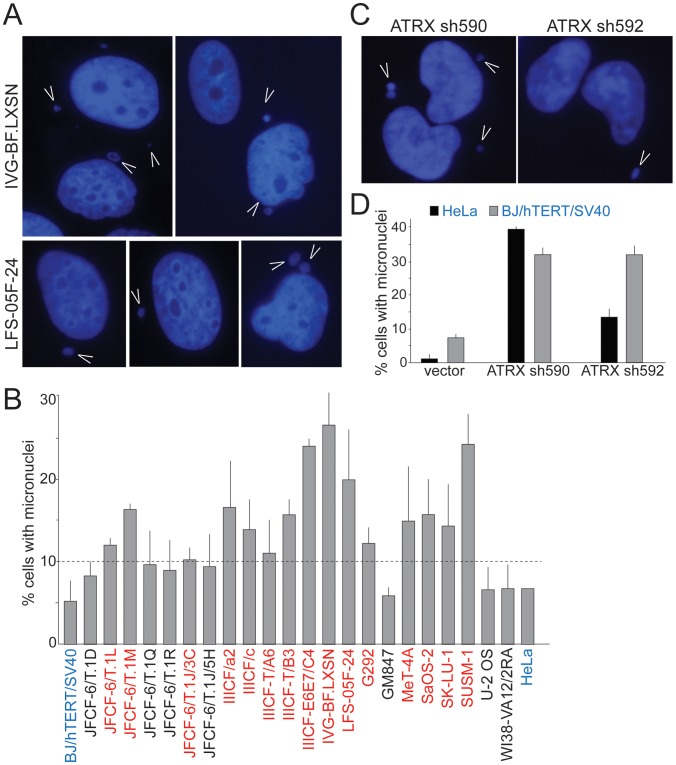
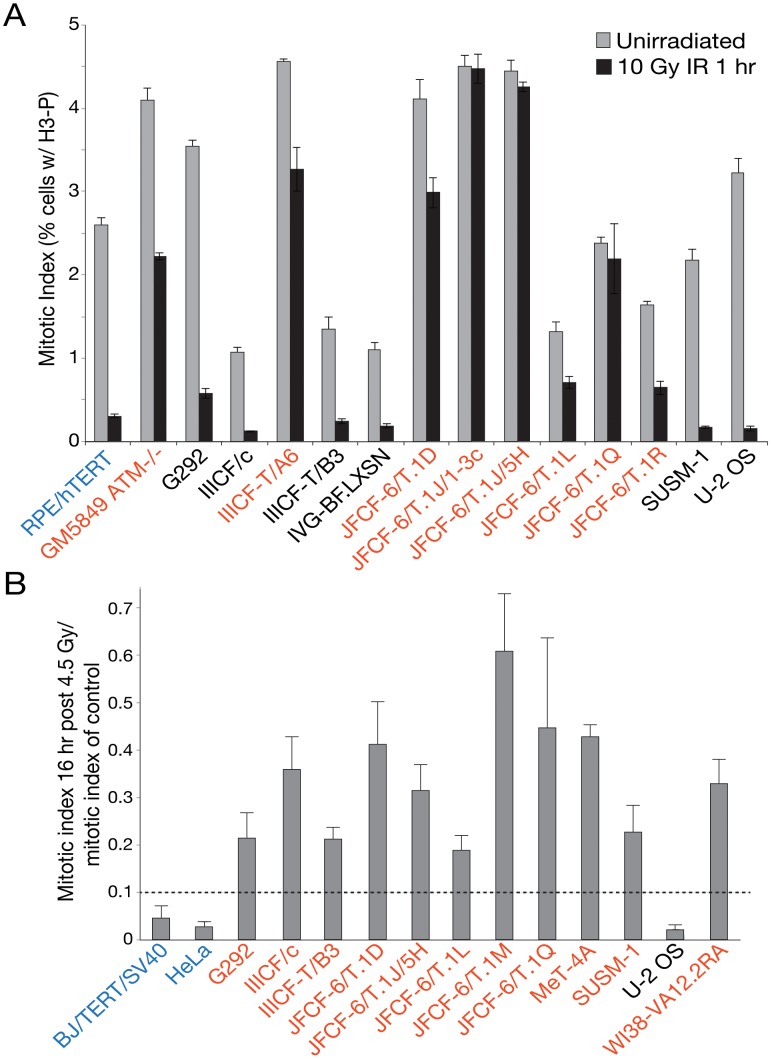
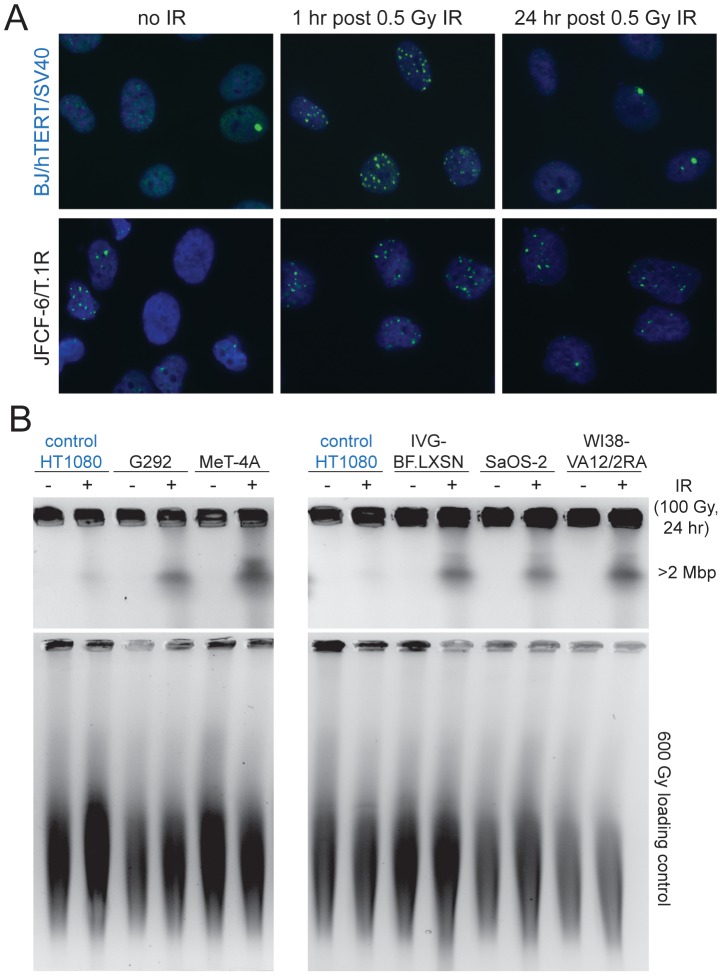
The Alternative Lengthening of Telomeres (ALT) pathway is a telomerase-independent pathway for telomere maintenance that is active in a significant subset of human cancers and in vitro immortalized cell lines. ALT is thought to involve templated extension of telomeres through homologous recombination, but the genetic or epigenetic changes that unleash ALT are not known. Recently, mutations in the ATRX/DAXX chromatin remodeling complex and histone H3.3 were found to correlate with features of ALT in pancreatic neuroendocrine cancers, pediatric glioblastomas, and other tumors of the central nervous system, suggesting that these mutations might contribute to the activation of the ALT pathway in these cancers. We have taken a comprehensive approach to deciphering ALT by applying genomic, molecular biological, and cell biological approaches to a panel of 22 ALT cell lines, including cell lines derived in vitro. Here we show that loss of ATRX protein and mutations in the ATRX gene are hallmarks of ALT-immortalized cell lines. In addition, ALT is associated with extensive genome rearrangements, marked micronucleation, defects in the G2/M checkpoint, and altered double-strand break (DSB) repair. These attributes will facilitate the diagnosis and treatment of ALT positive human cancers.
Overview
The claims and statistics of this paper haven’t been checked yet.
Run the check — free, no account needed. It reads the open-access text and checks the sources it cites.
Integrity signals
Registry
Cites
Statistics
Figures
Verification
Claims the paper makes
The claims and statistics of this paper haven’t been checked yet.
Run the check — free, no account needed. It reads the open-access text and checks the sources it cites.
Claims other papers make about this one
Each is checked against this paper’s own text: does it say what the citing paper says it does?
In the citing paper
“ALT is associated with mutations in the chromatin remodeller α-thalassaemia/mental retardation syndrome X-linked (AT R X ) both in vitro and in several human cancers, including glioblastomas162–165.”
From Telomeres in cancer: tumour suppression and genome instability (2017) · cites this paper as [162]
Self-check
Percentages, sums and reported differences re-computed from the paper’s own numbers.
The self-check needs the paper’s full text.
Citations
Cites
Comprehensive genomic characterization defines human glioblastoma genes and core pathways
The Cancer Genome Atlas Research Network (2008) · Nature · doi:10.1038/nature07385 · Cited by 7,735
The DNA-damage response in human biology and disease
Jackson, S. P., & Bartek, J. (2009) · Nature · doi:10.1038/nature08467 · Cited by 6,092 · cited 1×
“The implication of ATRX and DAXX in the ALT phenotype may have some relevance to the checkpoint defects observed, as the involvement of chromatin remodelers in the DDR becomes increasingly clear [55].”
BackgroundThe landscape of somatic copy-number alteration across human cancers
Beroukhim, R., Mermel, C. H., Porter, D., Wei, G., Raychaudhuri, S., Donovan, J., Barretina, J., Boehm, J. S., Dobson, J., Urashima, M., et al. (2010) · Nature · doi:10.1038/nature08822 · Cited by 4,017 · cited 2×
“0 algorithm was performed as previously described on the resulting segmented copy number data from the 22 ALT lines [39,59].”
BackgroundMethodSelf-citationMermel, C. H., Schumacher, S. E., Hill, B., Meyerson, M. M., Beroukhim, R., & Getz, G. A. (2011) · Genome biology · doi:10.1186/gb-2011-12-4-r41 · Cited by 3,520 · cited 1×
“0 algorithm was performed as previously described on the resulting segmented copy number data from the 22 ALT lines [39,59].”
MethodThe Consensus Coding Sequences of Human Breast and Colorectal Cancers
Sjöblom, T., Jones, S., Wood, L. D., Parsons, D. W., Lin, J., Barber, T. D., Mandelker, D. L., Leary, R. J., Ptak, J., Silliman, N., et al. (2006) · Science · doi:10.1126/science.1133427 · Cited by 3,161
Self-citationDriver mutations in histone H3.3 and chromatin remodelling genes in paediatric glioblastoma
Schwartzentruber, J., Korshunov, A., Liu, X.-Y., Jones, D. T. W., Pfaff, E., Jacob, K., Sturm, D., Fontebasso, A. M., Quang, D.-A. K., Tönjes, M., et al. (2012) · Nature · doi:10.1038/nature10833 · Cited by 2,631 · cited 1×
“The same correlation between inactivation of the ATRX pathway and the ALT-like phenotype was observed in pediatric glioblastoma and several other cancers [16,26].”
BackgroundCounter, C. M., Avilion, A. A., LeFeuvre, C. E., Stewart, N. G., Greider, C. W., Harley, C. B., & Bacchetti, S. (1992) · The EMBO Journal · doi:10.1002/j.1460-2075.1992.tb05245.x · Cited by 2,096 · cited 1×
“In cells that have been immortalized by telomerase activation, the telomere-driven genome instability is largely dampened, resulting in a rearranged but now relatively stable karyotype [43,44].”
BackgroundJiao, Y., Shi, C., Edil, B. H., de Wilde, R. F., Klimstra, D. S., Maitra, A., Schulick, R. D., Tang, L. H., Wolfgang, C. L., Choti, M. A., et al. (2011) · Science · doi:10.1126/science.1200609 · Cited by 1,744 · cited 1×
“Recently, a subset of pancreatic neuroendocrine tumors (PanNETs) were found to have ultrabright telomeric FISH signals, suggesting the presence of ALT-like long telomeres [24,25].”
BackgroundSelf-citationTelomeric Repeat–Containing RNA and RNA Surveillance Factors at Mammalian Chromosome Ends
Azzalin, C. M., Reichenbach, P., Khoriauli, L., Giulotto, E., & Lingner, J. (2007) · Science · doi:10.1126/science.1147182 · Cited by 1,379 · cited 9×
“In addition to shelterin and TERRA, we analyzed 299 genes with potential relevance to telomeres and the ALT pathway.”
BackgroundInfluentialDistinct Factors Control Histone Variant H3.3 Localization at Specific Genomic Regions
Goldberg, A. D., Banaszynski, L. A., Noh, K., Lewis, P. W., Elsässer, S. J., Stadler, S. C., Dewell, S. B., Law, M. J., Guo, X., Li, X., et al. (2010) · Cell · doi:10.1016/j.cell.2010.01.003 · Cited by 1,351
Cited by
Sorted by citations
The Somatic Genomic Landscape of Glioblastoma
Brennan, C. W., Verhaak, R. G. W., McKenna, A., Campos, B., Noushmehr, H., Salama, S. R., Zheng, S., Chakravarty, D., Sanborn, J. Z., Berman, S. H., et al. (2013) · Cell · doi:10.1016/j.cell.2013.09.034 · Cited by 5,016
Epidemiologic and Molecular Prognostic Review of Glioblastoma
Thakkar, J. P., Dolecek, T. A., Horbinski, C., Ostrom, Q. T., Lightner, D. D., Barnholtz‐Sloan, J. S., & Villano, J. L. (2014) · Cancer Epidemiology Biomarkers & Prevention · doi:10.1158/1055-9965.epi-14-0275 · Cited by 1,473
“Mutations in ATRX have been identified in multiple tumor types and appear to cause alternative lengthening of telomeres (ALT), a presumed precursor to genomic instability (130, 131).”
Whole-genome landscape of pancreatic neuroendocrine tumours
Initiative, A. P. C. G., Scarpa, A., Chang, D. K., Nones, K., Corbo, V., Patch, A.-M., Bailey, P., Lawlor, R. T., Johns, A. L., Miller, D. K., et al. (2017) · Nature · doi:10.1038/nature21063 · Cited by 999
Self-citationAdvances in Risk Classification and Treatment Strategies for Neuroblastoma
Pinto, N. R., Applebaum, M. A., Volchenboum, S. L., Matthay, K. K., London, W. B., Ambros, P. F., Nakagawara, A., Berthold, F., Schleiermacher, G., Park, J. R., et al. (2015) · Journal of Clinical Oncology · doi:10.1200/jco.2014.59.4648 · Cited by 924
Shelterin-Mediated Telomere Protection
de Lange, T. (2018) · Annual Review of Genetics · doi:10.1146/annurev-genet-032918-021921 · Cited by 816
Metadata
- Authors
- Lovejoy, C. A., Li, W., Reisenweber, S., Thongthip, S., Bruno, J., de Lange, T., De, S., Petrini, J. H. J., Sung, P. A., Jasin, M., Rosenbluh, J., Zwang, Y., Weir, B. A., Hatton, C., Ivanova, E., Macconaill, L., Hanna, M., Hahn, W. C., Lue, N. F., Reddel, R. R., Jiao, Y., Kinzler, K., Vogelstein, B., Papadopoulos, N., Meeker, A. K., & for the ALT Starr Cancer Consortium
- Affiliations
- Rockefeller University (US)
- Memorial Sloan Kettering Cancer Center (US)
- Broad Institute (US)
- Dana-Farber Cancer Institute (US)
- Cornell University (US)
- The University of Sydney (AU)
- Johns Hopkins University (US)
- ORCID
- Lovejoy, Courtney A.
- Thongthip, Supawat
- Bruno, Joanne
- De, Saurav
- Petrini, John H. J.
- Sung, Patricia A.
- Jasin, Maria
- Rosenbluh, Joseph
- Zwang, Yaara
- Hatton, Charlie
- Ivanova, Elena
- Macconaill, Laura
- Hahn, William C.
- Lue, Neal F.
- Reddel, Roger R.
- Jiao, Yuchen
- Kinzler, Kenneth
- Vogelstein, Bert
- Papadopoulos, Nickolas
- Meeker, Alan K.
- Venue
- PLoS Genetics
- Publisher
- Public Library of Science (PLoS)
- Published
- 2012-07-19
- Volume
- 8
- Issue
- 7
- Pages
- e1002772
- ISSN
- 1553-7390 (ISSN-L)
- 1553-7404
- PMC
- PMC3400581
- OpenAlex
- W1999626396
- Cited by
- 629
- References
- 60
- Citations by year
- 2026: 34 · 2025: 41 · 2024: 33 · 2023: 44 · 2022: 51 · 2021: 52 · 2020: 49 · 2019: 54 · 2018: 53 · 2017: 44 · 2016: 41 · 2015: 49 · 2014: 44 · 2013: 33 · 2012: 6
- FWCI
- 28.08
- Type
- journal article
- Language
- en
- Open access
- gold
- doi.org
- Locations
- PLoS Genetics (publishedVersion, cc-by)
- Europe PMC (PubMed Central) (publishedVersion, cc-by)
- PubMed Central (publishedVersion, cc-by)
- PubMed (publishedVersion)
- Digital Access to Scholarship at Harvard (DASH) (Harvard University) (submittedVersion, cc-by)
- DOAJ (DOAJ: Directory of Open Access Journals) (submittedVersion, cc-by-sa)
- Figshare (submittedVersion, cc-by)
- Funders
- U.S. Department of Defense
- National Institutes of Health
- Cancer Council NSW
- National Institute on Aging (R01AG023145)
- National Cancer Institute (CA076027, R01CA076027, R37CA043460, R13CA162528)
- National Institute of General Medical Sciences (R37GM059413, R37GM049046, R01GM049046, F32GM090437, GM049046, R01GM056888)
- Topics
- Life Sciences › Biochemistry, Genetics and Molecular Biology › Cell Biology › Telomeres, Telomerase, and Senescence
- Life Sciences › Biochemistry, Genetics and Molecular Biology › Molecular Biology › DNA Repair Mechanisms
- Life Sciences › Biochemistry, Genetics and Molecular Biology › Molecular Biology › DNA and Nucleic Acid Chemistry
- Keywords
- alternative lengthening of telomeres, ATRX, histone H3.3, genomic instability, DNA damage response, DNA double-strand break repair, G2/M checkpoint, micronucleation, genome rearrangement, telomere maintenance
- MeSH terms
- X-linked Nuclear Protein, DNA Damage, DNA Repair, DNA Helicases, HeLa Cells, Histones, Humans, Nuclear Proteins, Signal Transduction, Telomere, Molecular Chaperones, Telomerase, Chromatin Assembly and Disassembly, Genomic Instability, Adaptor Proteins, Signal Transducing, DNA Breaks, Double-Stranded, Co-Repressor Proteins, Telomere Homeostasis, G2 Phase Cell Cycle Checkpoints, Homologous Recombination
About these checks
Registry, retraction, Cites and statistics results are computed, not judged, with one exception: a printed reference that no index lists is read once by a model before it counts as a citation error. Claims are extracted by a model and kept only when their quote appears verbatim in the text; each cited source is then checked, with a model’s help, for whether it says what the claim relies on. Those verdicts can be wrong — read the claim’s quote and the cited source before relying on one.
Statistics and arithmetic are recomputed, not judged.
Confidence bands are shown only for fields calibrated on our annotated test set. None is calibrated yet, so no band is shown.
What counts as a claim ›How we measure confidence ›How we check this ›
Are you an author, or do you see a problem with this page? Request a review
