

The DOI matches its Crossref record; 115 of the 115 references it cites were found in a registry or an index.
Transposable Elements Are Major Contributors to the Origin, Diversification, and Regulation of Vertebrate Long Noncoding RNAs
Open accessAbstract
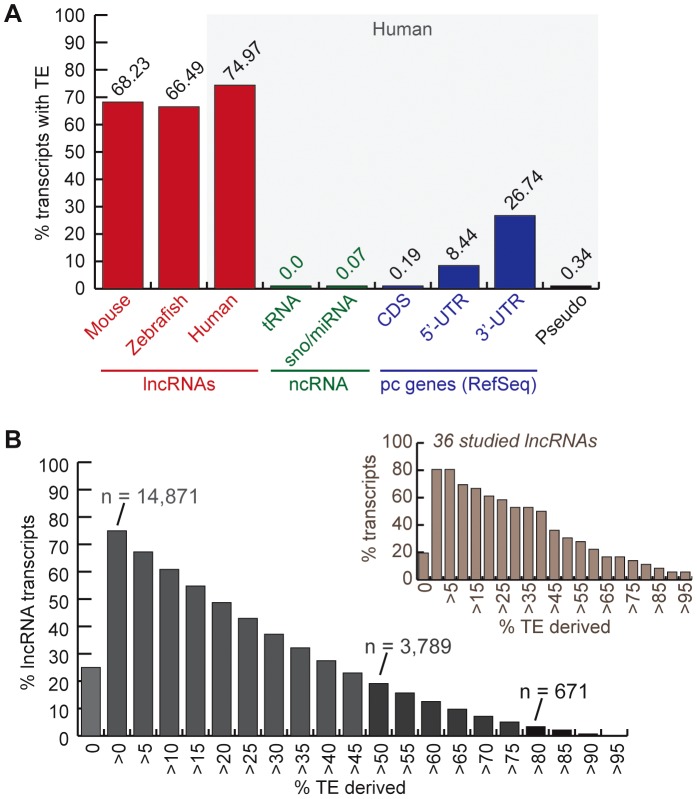
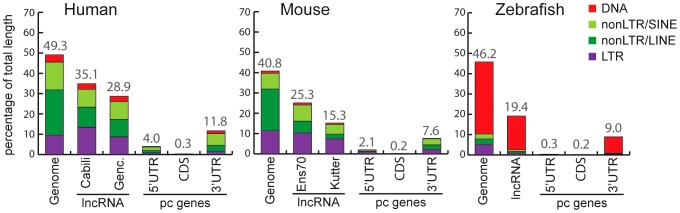
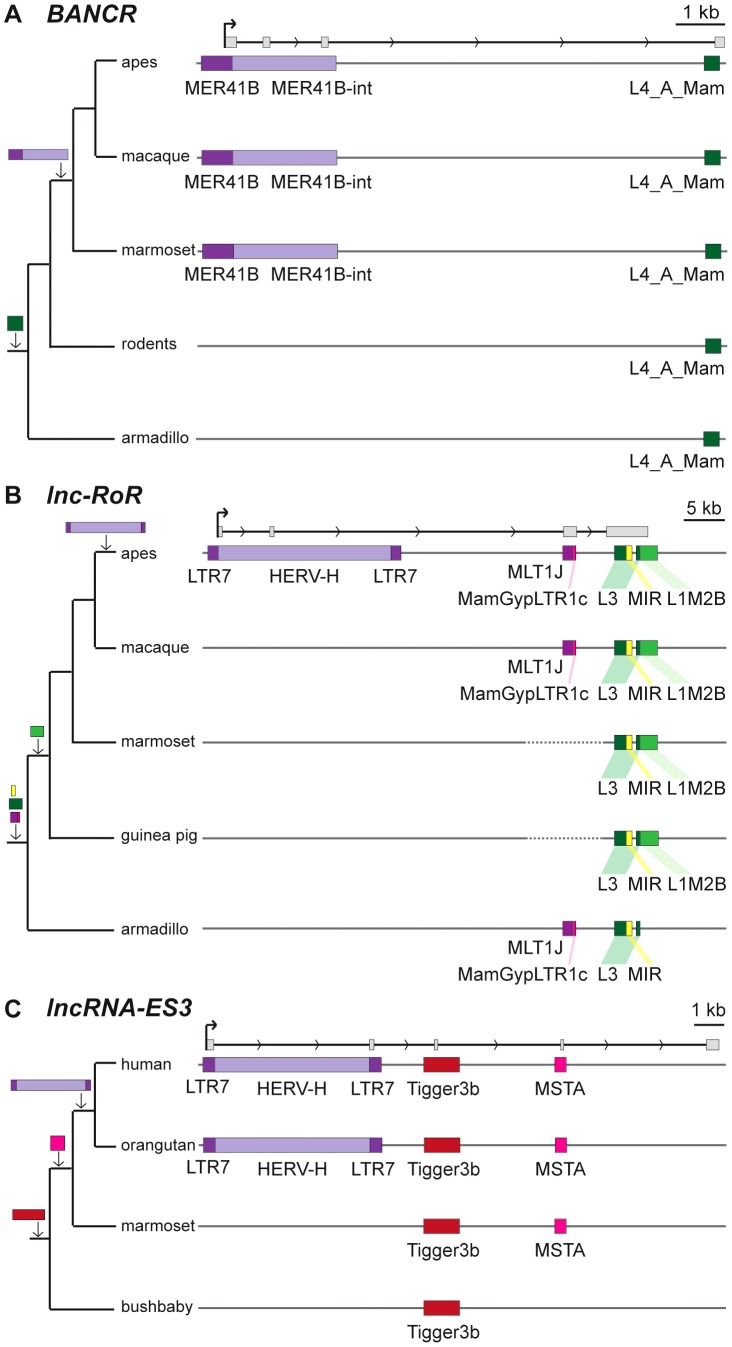
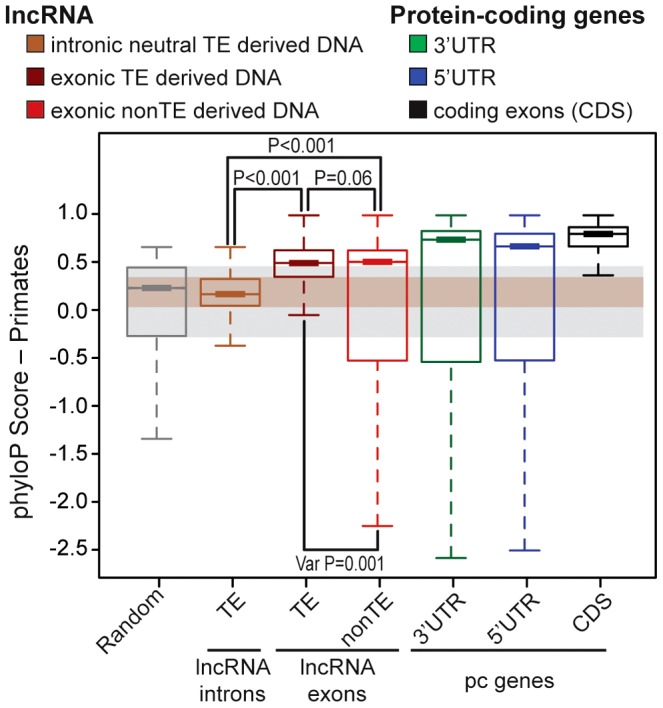
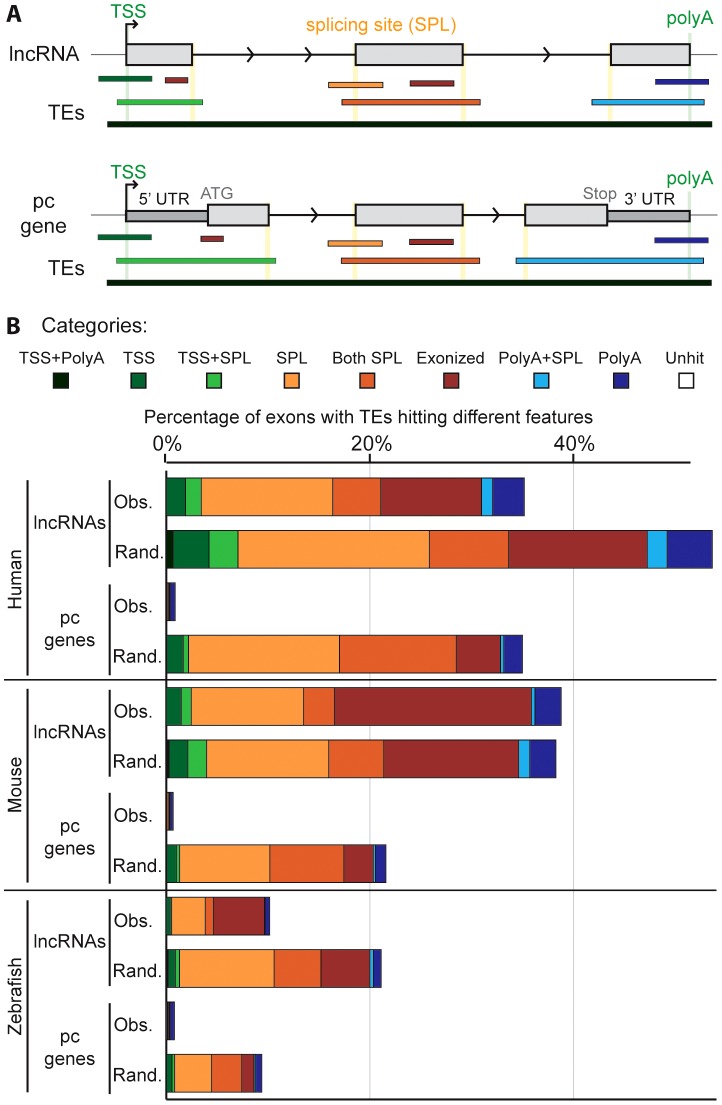
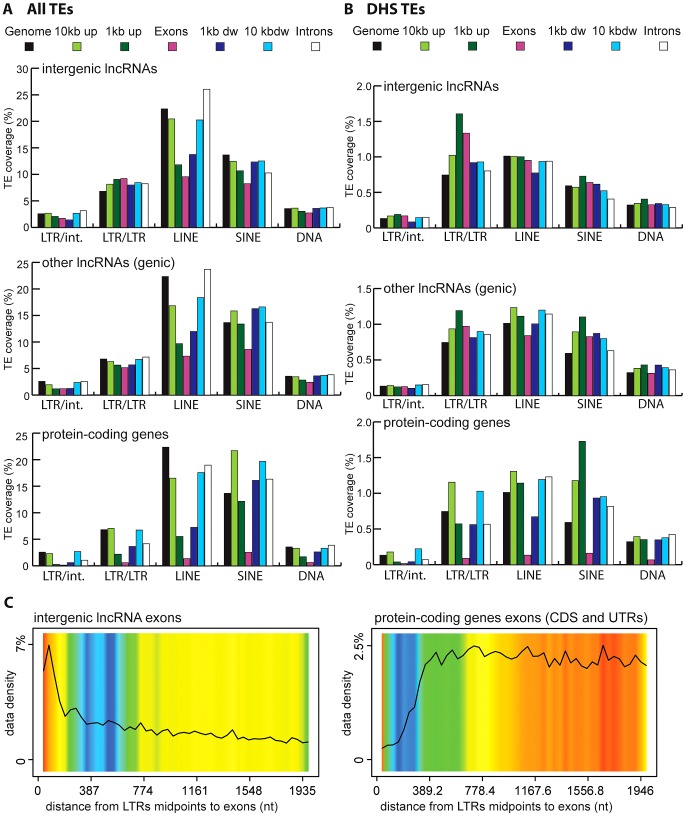
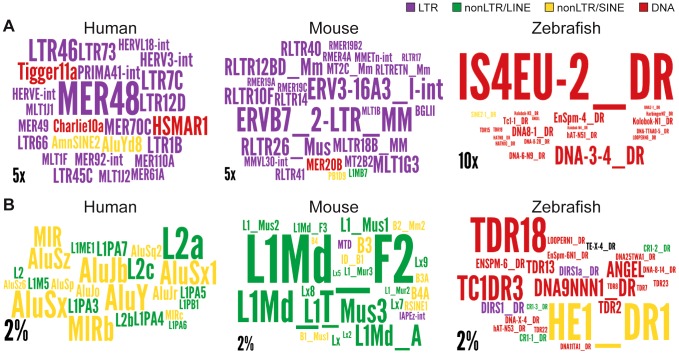
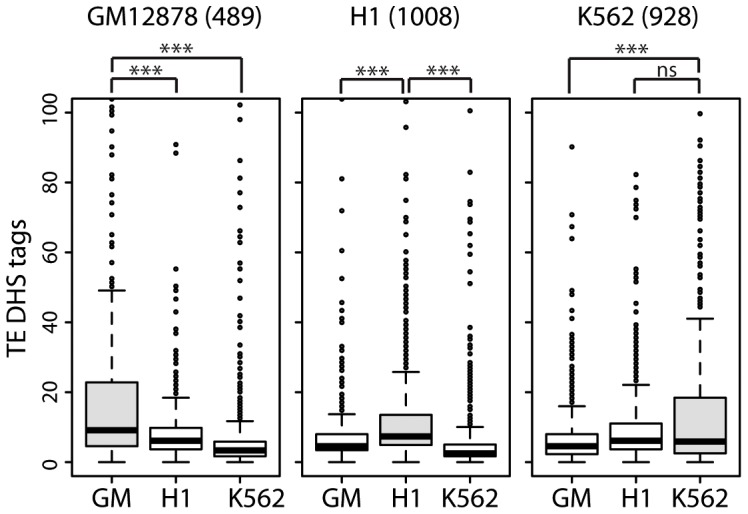
Advances in vertebrate genomics have uncovered thousands of loci encoding long noncoding RNAs (lncRNAs). While progress has been made in elucidating the regulatory functions of lncRNAs, little is known about their origins and evolution. Here we explore the contribution of transposable elements (TEs) to the makeup and regulation of lncRNAs in human, mouse, and zebrafish. Surprisingly, TEs occur in more than two thirds of mature lncRNA transcripts and account for a substantial portion of total lncRNA sequence (~30% in human), whereas they seldom occur in protein-coding transcripts. While TEs contribute less to lncRNA exons than expected, several TE families are strongly enriched in lncRNAs. There is also substantial interspecific variation in the coverage and types of TEs embedded in lncRNAs, partially reflecting differences in the TE landscapes of the genomes surveyed. In human, TE sequences in lncRNAs evolve under greater evolutionary constraint than their non-TE sequences, than their intronic TEs, or than random DNA. Consistent with functional constraint, we found that TEs contribute signals essential for the biogenesis of many lncRNAs, including ~30,000 unique sites for transcription initiation, splicing, or polyadenylation in human. In addition, we identified ~35,000 TEs marked as open chromatin located within 10 kb upstream of lncRNA genes. The density of these marks in one cell type correlate with elevated expression of the downstream lncRNA in the same cell type, suggesting that these TEs contribute to cis-regulation. These global trends are recapitulated in several lncRNAs with established functions. Finally a subset of TEs embedded in lncRNAs are subject to RNA editing and predicted to form secondary structures likely important for function. In conclusion, TEs are nearly ubiquitous in lncRNAs and have played an important role in the lineage-specific diversification of vertebrate lncRNA repertoires.
Overview
The claims and statistics of this paper haven’t been checked yet.
Run the check — free, no account needed. It reads the open-access text and checks the sources it cites.
Integrity signals
Registry
Cites
Statistics
Figures
Verification
Claims the paper makes
The claims and statistics of this paper haven’t been checked yet.
Run the check — free, no account needed. It reads the open-access text and checks the sources it cites.
Claims other papers make about this one
Each is checked against this paper’s own text: does it say what the citing paper says it does?
The cited source says what the claim attributes to it.
In the citing paper
“Notably, 11 of these elements overlapped with the promoters of annotated lncRNAs (Fig. 5a), consistent with the previous finding that LTRs are enriched in the transcription start sites (TSSs) of lncRNAs80.”
From Multi-omic analysis of hepatocellular carcinoma reveals aberrant cis-regulatory changes and dysregulated retrotransposons with prognostic potential (2025) · cites this paper as [80]
In the citing paper
“as sources of long non-coding RNAs [10]”
From The case for not masking away repetitive DNA (2018) · cites this paper as [10]
Self-check
Percentages, sums and reported differences re-computed from the paper’s own numbers.
The self-check needs the paper’s full text.
Citations
Cites
BEDTools: a flexible suite of utilities for comparing genomic features
Quinlan, A. R., & Hall, I. M. (2010) · Bioinformatics · doi:10.1093/bioinformatics/btq033 · Cited by 27,437
Initial sequencing and analysis of the human genome
International Human Genome Sequencing Consortium, Whitehead Institute for Biomedical Research, C. F. G. R., Lander, E. S., Linton, L. M., Birren, B., Nusbaum, C., Zody, M. C., Baldwin, J., Devon, K., Dewar, K., et al. (2001) · Nature · doi:10.1038/35057062 · Cited by 24,216
An integrated encyclopedia of DNA elements in the human genome
The ENCODE Project Consortium (2012) · Nature · doi:10.1038/nature11247 · Cited by 18,072
The Human Genome Browser at UCSC
Kent, W. J., Sugnet, C. W., Furey, T. S., Roskin, K. M., Pringle, T. H., Zahler, A. M., & Haussler, A. D. (2002) · Genome Research · doi:10.1101/gr.229102 · Cited by 10,400
<tt>BLAT</tt> —The <tt>BLAST</tt> -Like Alignment Tool
Kent, W. J. (2002) · Genome Research · doi:10.1101/gr.229202 · Cited by 8,480
Initial sequencing and comparative analysis of the mouse genome
Mouse Genome Sequencing Consortium (2002) · Nature · doi:10.1038/nature01262 · Cited by 7,187
Long non-coding RNAs: insights into functions
Mercer, T. R., Dinger, M. E., & Mattick, J. S. (2009) · Nature Reviews Genetics · doi:10.1038/nrg2521 · Cited by 5,654
Long non-coding RNA HOTAIR reprograms chromatin state to promote cancer metastasis
Gupta, R. A., Shah, N., Wang, K., Kim, J., Horlings, H. M., Wong, D. J., Tsai, M.-C., Hung, T., Argani, P., Rinn, J. L., et al. (2010) · Nature · doi:10.1038/nature08975 · Cited by 5,205
Landscape of transcription in human cells
Djebali, S., Davis, C. A., Merkel, A., Dobin, A., Lassmann, T., Mortazavi, A., Tanzer, A., Lagarde, J., Lin, W., Schlesinger, F., et al. (2012) · Nature · doi:10.1038/nature11233 · Cited by 5,187
Derrien, T., Johnson, R., Bussotti, G., Andrea Tanzer, A., Djebali, S., Tilgner, H., Guernec, G., Martin, D., Merkel, A., Knowles, D. G., et al. (2012) · Genome Research · doi:10.1101/gr.132159.111 · Cited by 5,135
Cited by
Sorted by citations
Items 301–400 of 713
Retroelement-derived RNA and its role in the brain
Evans, T. A., & Erwin, J. A. (2020) · Seminars in Cell and Developmental Biology · doi:10.1016/j.semcdb.2020.11.001 · Cited by 25
Kirov, I. V., Dudnikov, M., Merkulov, P., Shingaliev, A. S., Omarov, M., Kolganova, E., Sigaeva, A., Karlov, G. I., & Soloviev, A. (2020) · Plants · doi:10.3390/plants9121794 · Cited by 24
Nicolescu, C., Schilb, A. L., Kim, J., Sun, D., Hall, R. C. W., Gao, S., Gilmore, H. L., Schiemann, W. P., & Lu, Z. (2023) · Chemical & Biomedical Imaging · doi:10.1021/cbmi.3c00011 · Cited by 24
Age‐dependent differential expression profile of a novel intergenic long noncoding RNA in rat brain
Kour, S., & Rath, P. C. (2015) · International Journal of Developmental Neuroscience · doi:10.1016/j.ijdevneu.2015.08.008 · Cited by 24
Loss of p53-inducible long non-coding RNA LINC01021 increases chemosensitivity
Kaller, M., Götz, U., & Hermeking, H. (2017) · Oncotarget · doi:10.18632/oncotarget.22245 · Cited by 24
Ward, M. C., Zhao, S., Luo, K., Pavlovic, B. J., Karimi, M. M., Stephens, M., & Gilad, Y. (2018) · eLife · doi:10.7554/elife.33084 · Cited by 25
Roles of Non-Coding RNAs in Response to Nitrogen Availability in Plants
Fukuda, M., Fujiwara, T., & Nishida, S. (2020) · International Journal of Molecular Sciences · doi:10.3390/ijms21228508 · Cited by 23
Hsu, P., Yu, S., Tsai, Y., Chang, J.-Y., Tsai, L., Ye, C.-H., Song, N.-Y., Yau, L.-C., & Lin, S. (2021) · Journal of Biomedical Science · doi:10.1186/s12929-021-00754-2 · Cited by 24
Lv, J., Huang, Z., Liu, H., Liu, H., Cui, W., Bao, L., He, H., Guo, J., Liu, Q., Zhang, Y., et al. (2014) · Molecular Genetics and Genomics · doi:10.1007/s00438-014-0882-9 · Cited by 23
Long Intergenic Non-Coding RNAs: Novel Drivers of Human Lymphocyte Differentiation
Panzeri, I., Rossetti, G., Abrignani, S., & Pagani, M. (2015) · Frontiers in Immunology · doi:10.3389/fimmu.2015.00175 · Cited by 23
Massive contribution of transposable elements to mammalian regulatory sequences
Rayan, N. A., del Rosario, R. C. H., & Prabhakar, S. (2016) · Seminars in Cell and Developmental Biology · doi:10.1016/j.semcdb.2016.05.004 · Cited by 25
The Role of Long Noncoding RNAs in Plant Stress Tolerance
Song, Y., & Zhang, D. (2017) · Methods in molecular biology · doi:10.1007/978-1-4939-7136-7_3 · Cited by 23
Dynamic Signatures of the Epigenome: Friend or Foe?
Machnik, M., & Oleksiewicz, U. (2020) · Cells · doi:10.3390/cells9030653 · Cited by 23
Long Noncoding RNAs in Plant Viroids and Viruses: A Review
Shrestha, N., & Bujarski, J. J. (2020) · Pathogens · doi:10.3390/pathogens9090765 · Cited by 23
DotAligner: identification and clustering of RNA structure motifs
Smith, M. A., Seemann, S. E., Quek, X. C., & Mattick, J. S. (2017) · Genome biology · doi:10.1186/s13059-017-1371-3 · Cited by 22
Shah, I. M., Dar, M. A., Bhat, K. A., Dar, T. A., Ahmad, F., & Ahmad, S. M. (2022) · IntechOpen eBooks · doi:10.5772/intechopen.104861 · Cited by 23
Plaisance, I., Chouvardas, P., Sun, Y., Nemir, M., Aghagolzadeh, P., Aminfar, F., Shen, S., Shim, W. J., Rochais, F., Johnson, R., et al. (2022) · Cardiovascular Research · doi:10.1093/cvr/cvac191 · Cited by 22
ZBTB12 is a molecular barrier to dedifferentiation in human pluripotent stem cells
Han, D., Liu, G., Oh, Y., Oh, S., Yang, S., Mandjikian, L., Rani, N., Almeida, M. C., Kosik, K. S., & Jang, J. (2023) · Nature Communications · doi:10.1038/s41467-023-36178-9 · Cited by 21
Short Stories on Zebrafish Long Noncoding RNAs
Haque, S., Kaushik, K., Leonard, V. E., Kapoor, S. S., Sivadas, A., Joshi, A., Scaria, V., & Sivasubbu, S. (2014) · Zebrafish · doi:10.1089/zeb.2014.0994 · Cited by 22
Shapiro, J. A. (2016) · Biology · doi:10.3390/biology5020027 · Cited by 23
Transposable element activity, genome regulation and human health
Wang, L., & Jordan, I. K. (2018) · Current Opinion in Genetics & Development · doi:10.1016/j.gde.2018.02.006 · Cited by 23
Landscape of the long non-coding RNA transcriptome in human heart
Jiang, C., Ding, N., Li, J., Jin, X., Li, X., Pan, T., Huo, C., Li, Y., Xu, J., & Li, X. (2018) · Briefings in Bioinformatics · doi:10.1093/bib/bby052 · Cited by 22
New lncRNA annotation reveals extensive functional divergence of the transcriptome in maize
Han, L., Mu, Z., Luo, Z. W., Pan, Q., & Lin, L. (2018) · Journal of Integrative Plant Biology · doi:10.1111/jipb.12708 · Cited by 22
Shimura, H., & Masuta, C. (2015) · Virus Research · doi:10.1016/j.virusres.2015.06.016 · Cited by 22
Epigenetic control of mobile DNA as an interface between experience and genome change
Shapiro, J. A. (2014) · Frontiers in Genetics · doi:10.3389/fgene.2014.00087 · Cited by 21
Hoffmann, L. B., Li, B., Zhao, Q., Wei, W., Leighton, L. J., Bredy, T. W., Pang, T. Y., & Hannan, A. J. (2023) · Molecular Psychiatry · doi:10.1038/s41380-023-02350-2 · Cited by 21
TEtrimmer: a tool to automate the manual curation of transposable elements
Qian, J., Xue, H., Ou, S., Mann, L., Storer, J. M., Fürtauer, L., Heitkam, T., Wildermuth, M. C., Kusch, S., & Panstruga, R. (2025) · Nature Communications · doi:10.1038/s41467-025-63889-y · Cited by 32
Pourrajab, F., & Hekmatimoghaddam, S. (2021) · Heliyon · doi:10.1016/j.heliyon.2021.e06029 · Cited by 20
New genes helped acorn barnacles adapt to a sessile lifestyle
Han, Z., Wang, Z., Rittschof, D., Huang, Z., Chen, L., Hao, H., Yao, S., Su, P., Huang, M., Zhang, Y., et al. (2024) · Nature Genetics · doi:10.1038/s41588-024-01733-7 · Cited by 21
Spadafora, C. (2016) · BioEssays · doi:10.1002/bies.201500197 · Cited by 20
Guichard, E., Peona, V., Tagliazucchi, G. M., Abitante, L., Jagoda, E., Musella, M., Ricci, M., Rubio-Roldán, A., Sarno, S., Luiselli, D., et al. (2018) · Mobile DNA · doi:10.1186/s13100-018-0133-4 · Cited by 22
Satellite DNA-Mediated Gene Expression Regulation: Physiological and Evolutionary Implication
Feliciello, I., Pezer, Ž., Sermek, A., Mađarić, B. B., Ljubić, S., & Ugarković, Đ. (2021) · Progress in molecular and subcellular biology · doi:10.1007/978-3-030-74889-0_6 · Cited by 21
The role of transposable elements in the ecological morphogenesis under the influence of stress
Mustafin, R. N., & Хуснутдинова, Э. К. (2019) · Vavilov Journal of Genetics and Breeding · doi:10.18699/vj19.506 · Cited by 20
Exaptation at the molecular genetic level
Brosius, J. (2018) · Science China Life Sciences · doi:10.1007/s11427-018-9447-8 · Cited by 21
Transcriptome Profiling of Long Non-coding RNAs During the Atlantic Salmon Smoltification Process
Valenzuela‐Muñoz, V., Valdés, J. A., & Gallardo‐Escárate, C. (2021) · Marine Biotechnology · doi:10.1007/s10126-021-10024-9 · Cited by 20
van Calker, D., & Serchov, T. (2021) · Neuroscience & Biobehavioral Reviews · doi:10.1016/j.neubiorev.2021.03.019 · Cited by 19
Zhu, Y., Chen, L., Hong, X., Shi, H., & Li, X. (2022) · BMC Genomics · doi:10.1186/s12864-022-08602-9 · Cited by 18
Ansaloni, F., Gualandi, N., Esposito, M., Gustincich, S., & Sanges, R. (2022) · Bioinformatics · doi:10.1093/bioinformatics/btac526 · Cited by 19
Qian, J., Ibrahim, H. M. M., Erz, M., Kümmel, F., Panstruga, R., & Kusch, S. (2023) · Mobile DNA · doi:10.1186/s13100-023-00305-6 · Cited by 17
Potential of transposon-mediated cellular reprogramming towards cell-based therapies
Kumar, D., Anand, T., Talluri, T. R., & Kues, W. A. (2020) · World Journal of Stem Cells · doi:10.4252/wjsc.v12.i7.527 · Cited by 19
Ranz, J. M., González, P. M., Clifton, B. D., Nazario-Yepiz, N. O., Hernández-Cervantes, P. L., Palma-Martínez, M. J., Valdivia, D. I., Jimenez-Kaufmann, A., Lu, M., Markow, T. A., et al. (2021) · Communications Biology · doi:10.1038/s42003-021-02335-3 · Cited by 19
Evolution of TERT-interacting lncRNAs: expanding the regulatory landscape of telomerase
Nelson, A. D. L., & Shippen, D. E. (2015) · Frontiers in Genetics · doi:10.3389/fgene.2015.00277 · Cited by 19
Liu, W., Tsai, Z. T., & Tsai, H. (2017) · BMC Genomics · doi:10.1186/s12864-017-4156-x · Cited by 18
lncRNAs in fertility: redefining the gene expression paradigm?
Tzur, Y. B. (2022) · Trends in Genetics · doi:10.1016/j.tig.2022.05.013 · Cited by 19
The evolutionary landscape and expression pattern of plant lincRNAs
Chen, L., & Zhu, Q. (2022) · RNA Biology · doi:10.1080/15476286.2022.2144609 · Cited by 17
Identification of miRNA858 long-loop precursors in seed plants
Wang, W., Liu, X., Zhu, Y.-J., Zhu, J.-Z., Liu, C., Wang, Z., Shen, X., Allan, A. C., & Yin, X.-R. (2023) · The Plant Cell · doi:10.1093/plcell/koad315 · Cited by 18
Gualandi, N., Iperi, C., Esposito, M., Ansaloni, F., Gustincich, S., & Sanges, R. (2022) · Biology · doi:10.3390/biology11060826 · Cited by 18
Rapid evolution of piRNA clusters in the Drosophila melanogaster ovaryPreprint
Srivastav, S. P., Feschotte, C., & Clark, A. G. (2024) · Genome Research · doi:10.1101/gr.278062.123 · Cited by 22
Self-citationLongitudinal genetic studies of cognitive characteristics
Mustafin, R. N., Kazantseva, A. V., Enikeeva, R. F., Malykh, S. B., & Хуснутдинова, Э. К. (2020) · Vavilov Journal of Genetics and Breeding · doi:10.18699/vj20.599 · Cited by 18
Long non-coding RNAs: A double-edged sword in aging kidney and renal disease
Wang, Y., Yang, C.-E., Zhang, D., Chen, Y., Yu, X.-Y., Zhao, Y., & Miao, H. (2021) · Chemico-Biological Interactions · doi:10.1016/j.cbi.2021.109396 · Cited by 17
The Combined Regulation of Long Non-coding RNA and RNA-Binding Proteins in Atherosclerosis
Ding, Y., Yin, R., Zhang, S., Xiao, Q., Zhao, H., Pan, X., & Zhu, X. (2021) · Frontiers in Cardiovascular Medicine · doi:10.3389/fcvm.2021.731958 · Cited by 17
The transcriptome of human pluripotent stem cells
Au, K. F., & Sebastiano, V. (2014) · Current Opinion in Genetics & Development · doi:10.1016/j.gde.2014.09.012 · Cited by 17
Localization is the key to action: regulatory peculiarities of lncRNAs
Poloni, J. D. F., de Oliveira, F. H. S., & Feltes, B. C. (2024) · Frontiers in Genetics · doi:10.3389/fgene.2024.1478352 · Cited by 16
Long non-coding RNAs and splicing
Staněk, D. (2021) · Essays in Biochemistry · doi:10.1042/ebc20200087 · Cited by 17
Mammalian Endogenous Retroviruses
Mager, D. L., & Stoye, J. P. (2015) · ASM Press eBooks · doi:10.1128/9781555819217.ch47 · Cited by 16
Human Genetics and Clinical Aspects of Neurodevelopmental Disorders
Lyon, G. J., & O'Rawe, J. (2015) · Wiley eBooks · doi:10.1002/9781118524947.ch13 · Cited by 16
The Persistent Contributions of RNA to Eukaryotic Gen(om)e Architecture and Cellular FunctionPreprint
Brosius, J. (2014) · Cold Spring Harbor Perspectives in Biology · doi:10.1101/cshperspect.a016089 · Cited by 15
Transposable elements as genome regulators in normal and malignant haematopoiesis
Prokopov, D., Tunbak, H., Leddy, E., Drylie, B., Camera, F., & Deniz, Ö. (2025) · Blood Cancer Journal · doi:10.1038/s41408-025-01295-9 · Cited by 15
Chen, M., Jia, L., Zheng, X., Han, M., Li, L., & Zhang, L. (2022) · Cancer Research · doi:10.1158/0008-5472.can-22-0290 · Cited by 15
Basu, S., Hadzhiev, Y., Petrosino, G., Nepal, C., Gehrig, J., Armant, O., Ferg, M., Strähle, U., Sanges, R., & Müller, F. (2016) · Scientific Reports · doi:10.1038/srep33210 · Cited by 15
Dong, Y., Huang, Z., Kuang, Q., Wen, Z., Liu, Z., Li, Y., Yang, Y., & Li, M. (2017) · BMC Genomics · doi:10.1186/s12864-017-4078-7 · Cited by 15
Telomeric TART elements target the piRNA machinery in Drosophila
Ellison, C. E., Kagda, M. S., & Cao, W. (2020) · PLoS Biology · doi:10.1371/journal.pbio.3000689 · Cited by 14
Dechaud, C., Miyake, S., Martinez‐Bengochea, A., Schartl, M., Volff, J., & Naville, M. (2021) · Genome Biology and Evolution · doi:10.1093/gbe/evab230 · Cited by 14
The Roles and Mechanisms of lncRNAs in Liver Fibrosis
Wang, Z., Yang, X., Gui, S., Yang, F., Cao, Z., Cheng, R., Xia, X., & Li, C. (2021) · Frontiers in Pharmacology · doi:10.3389/fphar.2021.779606 · Cited by 19
Feng, W., Huang, J., Zhang, Z., Nie, H., Lin, Y., Li, Z., & Su, S. (2022) · Insects · doi:10.3390/insects13020111 · Cited by 15
Xu, H., Nelson, A. D. L., & Shippen, D. E. (2015) · PLoS Genetics · doi:10.1371/journal.pgen.1005281 · Cited by 15
Assessing Recent Selection and Functionality at Long Noncoding RNA Loci in the Mouse Genome
Wiberg, R. A. W., Halligan, D. L., Ness, R. W., Necşulea, A., Kaessmann, H., & Keightley, P. D. (2015) · Genome Biology and Evolution · doi:10.1093/gbe/evv155 · Cited by 15
Long noncoding RNA: noncoding and not coded
Toiber, D., Leprivier, G., & Rotblat, B. (2017) · Cell Death Discovery · doi:10.1038/cddiscovery.2016.104 · Cited by 15
Low, Y., Tan, D. E. K., Hu, Z., Tan, S. Y. X., & Tee, W. (2021) · Stem Cells International · doi:10.1155/2021/1624669 · Cited by 14
Long noncoding RNAs: biogenesis, regulation, function, and their emerging significance in toxicology
Choudhuri, S. (2023) · Toxicology Mechanisms and Methods · doi:10.1080/15376516.2023.2197489 · Cited by 14
Molecular Mimicry of Transposable Elements in Plants
Chu, J., Newman, J., & Cho, J. (2024) · Plant and Cell Physiology · doi:10.1093/pcp/pcae058 · Cited by 14
Marasca, F., Gasparotto, E., Polimeni, B., Vadalà, R., Ranzani, V., & Bodega, B. (2020) · International Journal of Molecular Sciences · doi:10.3390/ijms21093201 · Cited by 14
Long noncoding RNAs as tumorigenic factors and therapeutic targets for renal cell carcinoma
Shen, H., Luo, G., & Chen, Q. (2021) · Cancer Cell International · doi:10.1186/s12935-021-01805-2 · Cited by 14
Functional examination of lncRNAs in allotetraploid Gossypium hirsutum
Wang, L., Han, J., Lu, K., Li, M., Gao, M., Cao, Z., Zhao, T., Xue, C., Tao, X., Chen, Q., et al. (2021) · BMC Genomics · doi:10.1186/s12864-021-07771-3 · Cited by 14
The dynamic genomes of Hydra and the anciently active repeat complement of animal chromosomes
Kon‐Nanjo, K., Kon, T., Koubková-Yu, T. C.-T., Rodriguez‐Terrones, D., Falcon, F., Martínez, D. E., Steele, R. E., Tanaka, E. M., Holstein, T. W., & Simakov, O. (2025) · Genome biology · doi:10.1186/s13059-025-03653-z · Cited by 17
New insights into the functional role of retrotransposon dynamics in mammalian somatic cells
Mangiavacchi, A., Liu, P., Valle, F. D., & Orlando, V. (2021) · Cellular and Molecular Life Sciences · doi:10.1007/s00018-021-03851-5 · Cited by 16
Distribution, Diversity, and Evolution of Endogenous Retroviruses in Perissodactyl Genomes
Zhu, H., Gifford, R. J., & Murcia, P. R. (2018) · Journal of Virology · doi:10.1128/jvi.00927-18 · Cited by 14
Identification and characterization of ERV transcripts in goat embryos
Deng, R., Han, C., Zhao, L., Zhang, Q., Yan, B., Cheng, R., Wei, B., Meng, P., Mao, T., Zhang, Y., et al. (2018) · Reproduction · doi:10.1530/rep-18-0336 · Cited by 13
Age‐dependent differential expression profile of a novel intergenic long noncoding RNA in rat brain
Kour, S., & Rath, P. C. (2015) · International Journal of Developmental Neuroscience · doi:10.1016/j.ijdevneu.2015.07.011 · Cited by 13
Micropeptides: origins, identification, and potential role in metabolism-related diseases
Lu, Y., Ran, Y., Li, H., Wen, J., Cui, X., Zhang, X., Guan, X., & Cheng, M. (2023) · Journal of Zhejiang University SCIENCE B · doi:10.1631/jzus.b2300128 · Cited by 12
Shao, Z., Hu, J., Jandura, A., Wilk, R., Jachimowicz, M., Ma, L., Hu, C., Sundquist, A., Das, I., Samuel-Larbi, P., et al. (2024) · Nature Communications · doi:10.1038/s41467-024-47346-w · Cited by 12
Lebherz, M. K., Fouks, B., Schmidt, J., Bornberg‐Bauer, E., & Grandchamp, A. (2024) · Genome Biology and Evolution · doi:10.1093/gbe/evae134 · Cited by 11
Novel insights on the positive correlation between sense and antisense pairs on gene expression
Das, S., Rojas, M. P. Z., & Tran, E. J. (2024) · Wiley Interdisciplinary Reviews - RNA · doi:10.1002/wrna.1864 · Cited by 11
LINE-1 retrotransposons and let-7 miRNA: partners in the pathogenesis of cancer?
Ohms, S., Lee, S.-H., & Rangasamy, D. (2014) · Frontiers in Genetics · doi:10.3389/fgene.2014.00338 · Cited by 12
Identification and evolutionary analysis of long non-coding RNAs in zebra finch
Chen, C.-K., Yu, C.-P., Li, S., Wu, S.-M., Lu, M. J., Chen, Y.-H., Chen, D., Ng, C. S., Ting, C., & Li, W. (2017) · BMC Genomics · doi:10.1186/s12864-017-3506-z · Cited by 13
Transposable Elements in Pluripotent Stem Cells and Human Disease
Ma, G., Babarinde, I. A., Zhou, X., & Hutchins, A. P. (2022) · Frontiers in Genetics · doi:10.3389/fgene.2022.902541 · Cited by 12
Regulation of endogenous retroviruses in murine embryonic stem cells and early embryos
Lu, X. (2023) · Journal of Molecular Cell Biology · doi:10.1093/jmcb/mjad052 · Cited by 14
Enlightening the contribution of the dark matter to the X chromosome inactivation process in mammals
Casanova, M., Ali, T. M. L., & Rougeulle, C. (2016) · Seminars in Cell and Developmental Biology · doi:10.1016/j.semcdb.2016.05.003 · Cited by 11
Subburaj, S., Jeon, Y., Tu, L., Jin, Y.-T., Kumari, S., & Lee, G. (2018) · Plant Growth Regulation · doi:10.1007/s10725-018-0410-8 · Cited by 12
Viruses and long non-coding RNAs: implicating an evolutionary conserved region
Mohebbi, A., Tahamtan, A., Eskandarian, S., Askari, F. S., Fallah, M. S., & Lorestani, N. (2018) · VirusDisease · doi:10.1007/s13337-018-0486-9 · Cited by 12
Gerhard, G. S., Davis, B., Wu, X., Hanson, A., Wilhelmsen, D., Piras, I. S., Still, C. D., Chu, X., Petrick, A. T., & DiStefano, J. K. (2020) · Biochemistry and Biophysics Reports · doi:10.1016/j.bbrep.2020.100753 · Cited by 12
Rayford, K. J., Cooley, A., Arun, A., Rachakonda, G., Kleschenko, Y., Villalta, F., Pratap, S., Lima, M. F., & Nde, P. N. (2020) · International Journal of Molecular Sciences · doi:10.3390/ijms21249439 · Cited by 12
Helitrons, the Eukaryotic Rolling-circle Transposable Elements
Thomas, J., & Pritham, E. J. (2015) · ASM Press eBooks · doi:10.1128/9781555819217.ch40 · Cited by 12
Falese, J. P., McFadden, E. J., D'Inzeo, C. A., & Hargrove, A. E. (2025) · RNA · doi:10.1261/rna.080488.125 · Cited by 11
Alu Elements as Novel Regulators of Gene Expression in Type 1 Diabetes Susceptibility Genes?
Kaur, S., & Pociot, F. (2015) · Genes · doi:10.3390/genes6030577 · Cited by 11
Sequence repetitiveness quantification and de novo repeat detection by weighted k-mer coverage
Feng, C., Dai, M., Liu, Y., & Chen, M. (2020) · Briefings in Bioinformatics · doi:10.1093/bib/bbaa086 · Cited by 12
Prabhakar, B., Lee, S., Bochanis, A., Wu, H., Manautou, J. E., & Rasmussen, T. P. (2021) · Cell Proliferation · doi:10.1111/cpr.12978 · Cited by 11
Chen, S., Zhao, R., Wu, T., Wang, D., Wang, B., Pan, S., Hu, X., Pan, Z., & Cui, H. (2021) · Frontiers in Microbiology · doi:10.3389/fmicb.2021.788317 · Cited by 11
Influence of retroelements on oncogenes and tumor suppressors in carcinogenesis: A review
Mustafin, R. N. (2021) · Journal of Modern Oncology · doi:10.26442/18151434.2021.4.201199 · Cited by 11
Hypomethylation marks enhancers within transposable elements
Mukamel, Z., & Tanay, A. (2013) · Nature Genetics · doi:10.1038/ng.2680 · Cited by 11
Metadata
- Authors
- Kapusta, A., Kronenberg, Z., Lynch, V. J., Zhuo, X., Ramsay, L., Bourque, G., Yandell, M., & Feschotte, C.
- Affiliations
- University of Utah (US)
- University of Chicago (US)
- McGill University and Génome Québec Innovation Centre (CA)
- Corresponding author
- Feschotte, Cédric
- ORCID
- Venue
- PLoS Genetics
- Publisher
- Public Library of Science (PLoS)
- Published
- 2013-04-25
- Volume
- 9
- Issue
- 4
- Pages
- e1003470
- ISSN
- 1553-7390 (ISSN-L)
- 1553-7404
- PMC
- PMC3636048
- OpenAlex
- W2029868997
- Cited by
- 687
- References
- 115
- Citations by year
- 2026: 21 · 2025: 27 · 2024: 60 · 2023: 52 · 2022: 57 · 2021: 70 · 2020: 53 · 2019: 52 · 2018: 68 · 2017: 58 · 2016: 50 · 2015: 62 · 2014: 42 · 2013: 13
- FWCI
- 67.23
- Type
- journal article
- Language
- en
- Open access
- gold
- doi.org
- Locations
- PLoS Genetics (publishedVersion, cc-by)
- Europe PMC (PubMed Central) (publishedVersion, cc-by)
- PubMed Central (publishedVersion, cc-by)
- PubMed (publishedVersion)
- Knowledge@UChicago (University of Chicago) (submittedVersion, cc-by-nc-nd)
- DOAJ (DOAJ: Directory of Open Access Journals) (submittedVersion, cc-by-sa)
- Figshare (submittedVersion, cc-by)
- University of Chicago (cc-by)
- Funders
- National Science Foundation (1126998)
- National Institutes of Health
- Canadian Institutes of Health Research (115090_1)
- National Human Genome Research Institute (R01HG004694)
- National Institute of General Medical Sciences (T32GM007464, R01GM077582)
- Topics
- Life Sciences › Biochemistry, Genetics and Molecular Biology › Genetics › Chromosomal and Genetic Variations
- Life Sciences › Biochemistry, Genetics and Molecular Biology › Cancer Research › Cancer-related molecular mechanisms research
- Life Sciences › Biochemistry, Genetics and Molecular Biology › Molecular Biology › Genomics and Chromatin Dynamics
- Keywords
- transposable elements, long non-coding RNA, lncRNA evolution, lncRNA biogenesis, cis-regulation, open chromatin, RNA editing, secondary structure, transcription initiation, splicing, polyadenylation, human, mice, zebrafish
- MeSH terms
- Animals, DNA Transposable Elements, Exons, Humans, Introns, Vertebrates, RNA, Long Noncoding
About these checks
Registry, retraction, Cites and statistics results are computed, not judged, with one exception: a printed reference that no index lists is read once by a model before it counts as a citation error. Claims are extracted by a model and kept only when their quote appears verbatim in the text; each cited source is then checked, with a model’s help, for whether it says what the claim relies on. Those verdicts can be wrong — read the claim’s quote and the cited source before relying on one.
Statistics and arithmetic are recomputed, not judged.
Confidence bands are shown only for fields calibrated on our annotated test set. None is calibrated yet, so no band is shown.
What counts as a claim ›How we measure confidence ›How we check this ›
Are you an author, or do you see a problem with this page? Request a review
