

The DOI matches its Crossref record; 58 of the 58 references it cites were found in a registry or an index.
Admixture in Latin America: Geographic Structure, Phenotypic Diversity and Self-Perception of Ancestry Based on 7,342 Individuals
Open accessAbstract
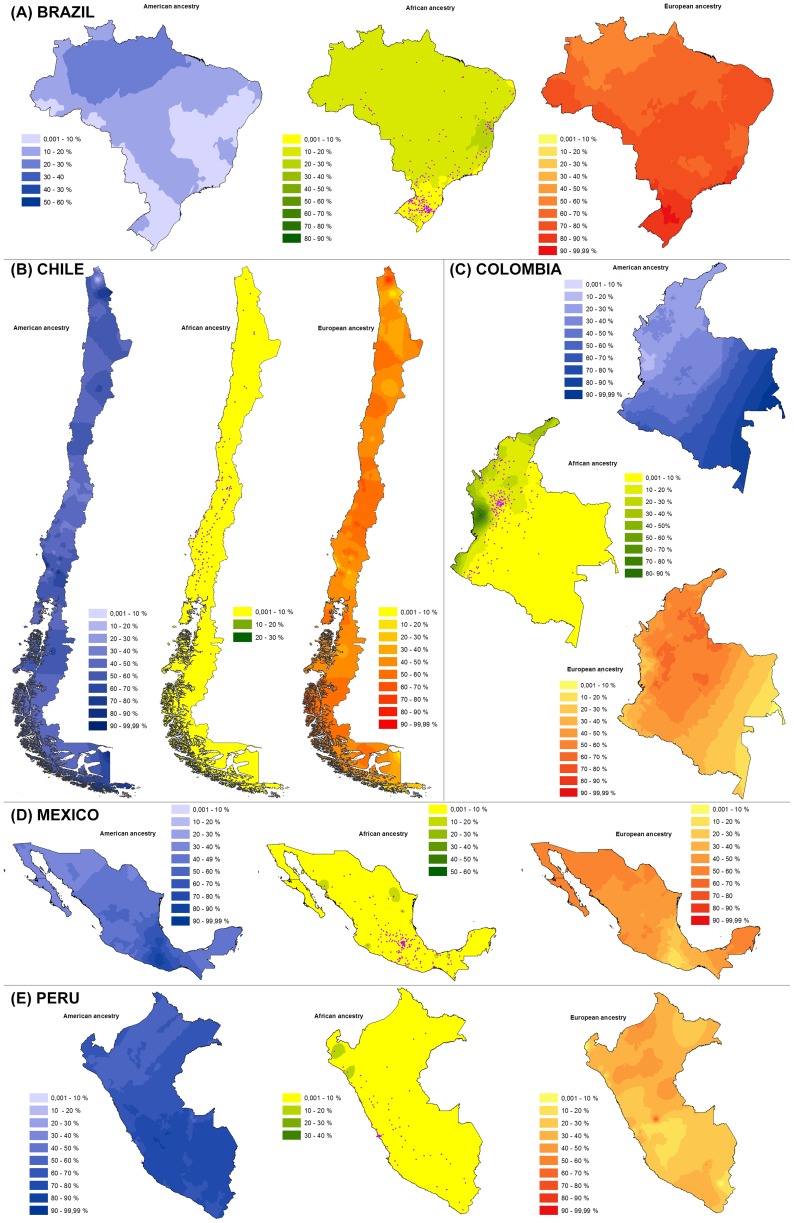
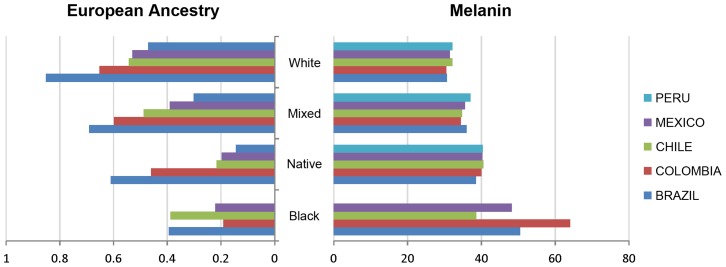
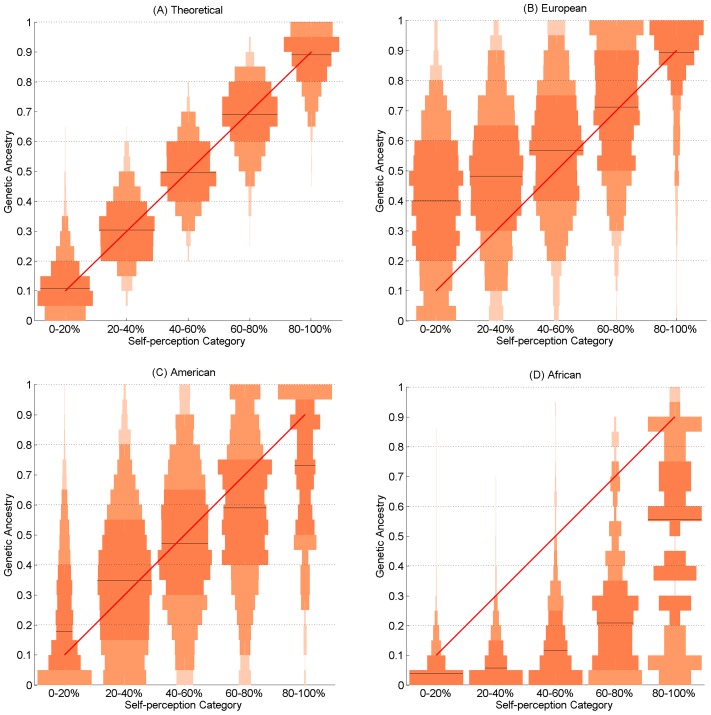
The current genetic makeup of Latin America has been shaped by a history of extensive admixture between Africans, Europeans and Native Americans, a process taking place within the context of extensive geographic and social stratification. We estimated individual ancestry proportions in a sample of 7,342 subjects ascertained in five countries (Brazil, Chile, Colombia, México and Perú). These individuals were also characterized for a range of physical appearance traits and for self-perception of ancestry. The geographic distribution of admixture proportions in this sample reveals extensive population structure, illustrating the continuing impact of demographic history on the genetic diversity of Latin America. Significant ancestry effects were detected for most phenotypes studied. However, ancestry generally explains only a modest proportion of total phenotypic variation. Genetically estimated and self-perceived ancestry correlate significantly, but certain physical attributes have a strong impact on self-perception and bias self-perception of ancestry relative to genetically estimated ancestry.
Overview
The claims and statistics of this paper haven’t been checked yet.
Run the check — free, no account needed. It reads the open-access text and checks the sources it cites.
Integrity signals
Registry
Cites
Statistics
Figures
Verification
Claims the paper makes
The claims and statistics of this paper haven’t been checked yet.
Run the check — free, no account needed. It reads the open-access text and checks the sources it cites.
Claims other papers make about this one
Each is checked against this paper’s own text: does it say what the citing paper says it does?
The cited source doesn’t support the claim as written.
In the citing paper
“They assessed genetic ancestry with 15,000 SNPs, making their index highly-reliable [56].”
From Global Ancestry and Cognitive Ability (2019) · cites this paper as [56]
Checked by a reasoning model — may be wrong.
Experimental — accuracy not yet measured
Self-check
Percentages, sums and reported differences re-computed from the paper’s own numbers.
The self-check needs the paper’s full text.
Citations
Cites
R: A Language and Environment for Statistical Computing
R Core Team (2000) · doi:10.32614/r.manuals · Cited by 355,893
Fast model-based estimation of ancestry in unrelated individuals
Alexander, D. H., Novembre, J., & Lange, K. (2009) · Genome Research · doi:10.1101/gr.094052.109 · Cited by 9,898 · cited 2×
“Individual African, European and Native American ancestry proportions were estimated using the ADMIXTURE program [17] using supervised runs where African, European and Native American reference groups (K = 3) were provided (see below).”
MethodCommon SNPs explain a large proportion of the heritability for human height
Yang, J., Benyamin, B., McEvoy, B. P., Gordon, S., Henders, A. K., Nyholt, D. R., Madden, P. A., Heath, A. C., Martin, N. G., Montgomery, G. W., et al. (2010) · Nature Genetics · doi:10.1038/ng.608 · Cited by 4,446 · cited 1×
“Recent genome-wide association analyses in Europeans have implicated loci for variation in height and related anthropometric traits [43,44].”
BackgroundThe History and Geography of Human Genes
Cavalli-Sforza, L. L., Menozzi, P., & Piazza, A. (2018) · Princeton University Press eBooks · doi:10.2307/j.ctv301gjp · Cited by 3,175
Hundreds of variants clustered in genomic loci and biological pathways affect human height
Lango Allen, H., Estrada, K., Lettre, G., Berndt, S. I., Weedon, M. N., Rivadeneira, F., Willer, C. J., Jackson, A. U., Vedantam, S., Raychaudhuri, S., et al. (2010) · Nature · doi:10.1038/nature09410 · Cited by 1,945
Worldwide Human Relationships Inferred from Genome-Wide Patterns of Variation
Li, J. Z., Absher, D. M., Tang, H., Southwick, A. M., Casto, A. M., Ramachandran, S., Cann, H. M., Barsh, G. S., Feldman, M. W., Cavalli-Sforza, L. L., et al. (2008) · Science · doi:10.1126/science.1153717 · Cited by 1,915
Color and genomic ancestry in Brazilians
Parra, F. C., Amado, R. C., Lambertucci, J., Rocha, J., Antunes, C., & Pena, S. D. (2002) · Proceedings of the National Academy of Sciences of the United States of America · doi:10.1073/pnas.0126614100 · Cited by 939 · cited 1×
“Few studies have examined the impact of genetic ancestry on physical appearance or the relationship of these to individual notions of ethnicity and ancestry [15,16].”
BackgroundRace and Ethnicity in Latin America
Wade, P. (2010) · Pluto Press eBooks · doi:10.2307/j.ctt183p73f · Cited by 822
Informativeness of Genetic Markers for Inference of Ancestry*
Rosenberg, N. A., Li, L. M., Ward, R. H., & Pritchard, J. K. (2003) · The American Journal of Human Genetics · doi:10.1086/380416 · Cited by 710 · cited 2×
“…of 5,000 markers, highly informative for world-wide continental ancestry estimation, identified by Paschou et al (2010) [18] using the approach of Rosenberg et al. (2003) [55] based on the worldwide CEPH-HGDP cell panel genotyped with Illumina’s Human610-Quad beadchip (including data for about…”
MethodReconstructing Native American population history
Reich, D., Patterson, N., Campbell, D., Tandon, A., Mazieres, S., Ray, N., Parra, M. V., Rojas, W., Duque, C., Mesa, N., et al. (2012) · Nature · doi:10.1038/nature11258 · Cited by 696 · cited 5×
“Of the final set of 30 markers retained, 13 are monomorphic in 408 Native Americans (from 47 populations from México Southwards [57]), the rest have minor allele frequencies ranging from 0.01 to 0.15 (median 0.06) in that group of populations.”
BackgroundMethodInfluentialSelf-citation
Cited by
Sorted by citations
Human Demographic History Impacts Genetic Risk Prediction across Diverse Populations
Martin, A. R., Gignoux, C. R., Walters, R. K., Wojcik, G. L., Neale, B. M., Gravel, S., Daly, M. J., Bustamante, C. D., & Kenny, E. E. (2017) · The American Journal of Human Genetics · doi:10.1016/j.ajhg.2017.03.004 · Cited by 1,391
A method for genome-wide genealogy estimation for thousands of samples
Speidel, L., Forest, M., Shi, S., & Myers, S. R. (2019) · Nature Genetics · doi:10.1038/s41588-019-0484-x · Cited by 480
Parker, H. G., Dreger, D. L., Rimbault, M., Davis, B. W., Mullen, A. B., Carpintero-Ramirez, G., & Ostrander, E. A. (2017) · Cell Reports · doi:10.1016/j.celrep.2017.03.079 · Cited by 455
“…may retain the aboriginal NewWorld dog genomic signatures intermixed with the European breed haplotypes, similar to the admixture among European, African, and Native American genomes that can be found inmodern South American human populations (Mathias et al., 2016; Ruiz-Linares et al., 2014).”
BackgroundLoci associated with skin pigmentation identified in African populations
Crawford, N. G., Kelly, D. E., Hansen, M. E. B., Beltrame, M. H., Fan, S., Bowman, S. L., Jewett, E., Ranciaro, A., Thompson, S., Lo, Y., et al. (2017) · Science · doi:10.1126/science.aan8433 · Cited by 321
Kehdy, F. S. G., Gouveia, M. H., Machado, M., Magalhães, W. C. S., Horimoto, A. R. V. R., Horta, B. L., MOREIRA, R. G., Leal, T. P., Scliar, M. O., Soares‐Souza, G. B., et al. (2015) · Proceedings of the National Academy of Sciences · doi:10.1073/pnas.1504447112 · Cited by 278
Metadata
- Authors
- Ruiz-Linares, A., Adhikari, K., Acuña-Alonzo, V., Quinto-Sanchez, M., Jaramillo, C., Arias, W., Fuentes, M., Pizarro, M., Everardo, P., de Avila, F., Gómez-Valdés, J., León-Mimila, P., Hunemeier, T., Ramallo, V., Silva de Cerqueira, C. C., Burley, M.-W., Konca, E., de Oliveira, M. Z., Veronez, M. R., Rubio-Codina, M., Attanasio, O., Gibbon, S., Ray, N., Gallo, C., Poletti, G., Rosique, J., Schuler-Faccini, L., Salzano, F. M., Bortolini, M.-C., Canizales-Quinteros, S., Rothhammer, F., Bedoya, G., Balding, D., & Gonzalez-José, R.
- Affiliations
- University College London (GB)
- Universidad de Antioquia (CO)
- University of Tarapacá (CL)
- National Institute of Anthropology and History (MX)
- Universidade Federal do Rio Grande do Sul (BR)
- Institute for Fiscal Studies (GB)
- University of Geneva (CH)
- Universidad Peruana Cayetano Heredia (PE)
- ORCID
- Venue
- PLoS Genetics
- Publisher
- Public Library of Science (PLoS)
- Published
- 2014-09-25
- Volume
- 10
- Issue
- 9
- Pages
- e1004572
- ISSN
- 1553-7390 (ISSN-L)
- 1553-7404
- PMC
- PMC4177621
- OpenAlex
- W2112602049
- Cited by
- 442
- References
- 58
- Citations by year
- 2026: 24 · 2025: 39 · 2024: 25 · 2023: 40 · 2022: 27 · 2021: 45 · 2020: 41 · 2019: 46 · 2018: 41 · 2017: 38 · 2016: 45 · 2015: 28 · 2014: 2
- FWCI
- 24.74
- Type
- journal article
- Language
- en
- Open access
- gold
- doi.org
- Locations
- PLoS Genetics (publishedVersion, cc-by)
- Europe PMC (PubMed Central) (publishedVersion, cc-by)
- PubMed Central (publishedVersion, cc-by)
- PubMed (publishedVersion)
- Archive ouverte UNIGE (University of Geneva) (publishedVersion, other-oa)
- Open Research Online (The Open University) (acceptedVersion)
- Minerva Access (University of Melbourne) (submittedVersion, cc-by)
- LA Referencia (Red Federada de Repositorios Institucionales de Publicaciones Científicas) (submittedVersion, cc-by-nc-sa)
- Americanae (AECID Library) (submittedVersion, cc-by)
- Institutional Repository University of Antioquia (University of Antioquia) (submittedVersion, cc-by-nc-nd)
- DOAJ (DOAJ: Directory of Open Access Journals) (submittedVersion, cc-by-sa)
- UCL Discovery (University College London) (submittedVersion)
- Figshare (submittedVersion, cc-by)
- Universidad de Chile (submittedVersion, cc-by-nc-nd)
- LA Referencia (Red Federada de Repositorios Institucionales de Publicaciones Científicas) (submittedVersion, cc-by)
- Archive ouverte UNIGE (University of Geneva) (submittedVersion, cc-by)
- Greater South Information System
- Funders
- Leverhulme Trust (F/07 134/DF)
- Biotechnology and Biological Sciences Research Council (BB/I021213/1)
- Economic and Social Research Council (ES/H021221/1)
- Topics
- Life Sciences › Biochemistry, Genetics and Molecular Biology › Genetics › Forensic and Genetic Research
- Life Sciences › Biochemistry, Genetics and Molecular Biology › Genetics › Genetic diversity and population structure
- Social Sciences › Anthropology › Race, Genetics, and Society
- Keywords
- admixture, genetic ancestry estimation, population structure, phenotypic diversity, demographic history, genetic diversity, self-perception bias
- MeSH terms
- Ethnicity, Biological Evolution, Female, Genetics, Population, Geography, Humans, Latin America, Male, Phenotype, Self Concept, Genetic Variation, Quantitative Trait, Heritable
About these checks
Registry, retraction, Cites and statistics results are computed, not judged, with one exception: a printed reference that no index lists is read once by a model before it counts as a citation error. Claims are extracted by a model and kept only when their quote appears verbatim in the text; each cited source is then checked, with a model’s help, for whether it says what the claim relies on. Those verdicts can be wrong — read the claim’s quote and the cited source before relying on one.
Statistics and arithmetic are recomputed, not judged.
Confidence bands are shown only for fields calibrated on our annotated test set. None is calibrated yet, so no band is shown.
What counts as a claim ›How we measure confidence ›How we check this ›
Are you an author, or do you see a problem with this page? Request a review
