

The DOI matches its Crossref record; 6 of the 6 references it cites were found in a registry or an index.
The Genetic Legacy of the Expansion of Turkic-Speaking Nomads across Eurasia
Published version of a preprint
Overview
The claims and statistics of this paper haven’t been checked yet.
Run the check — free, no account needed. It reads the open-access text and checks the sources it cites.
Integrity signals
Registry
Cites
Statistics
Figures
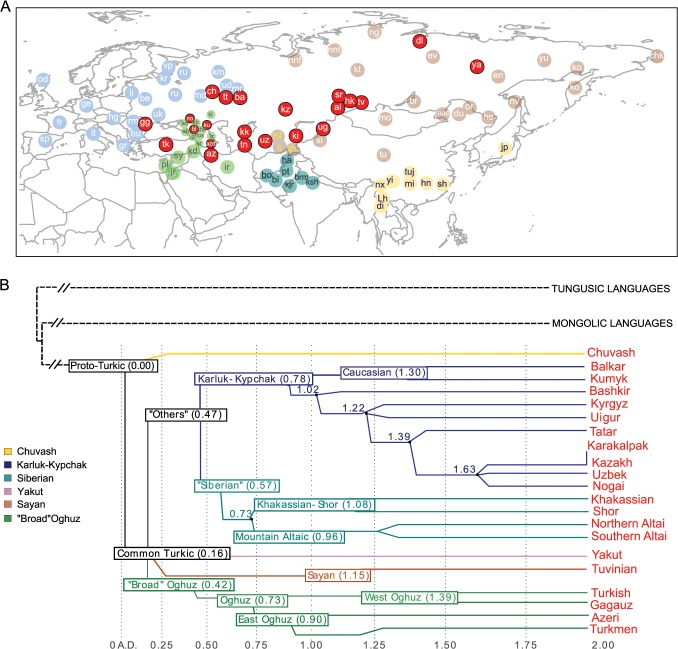
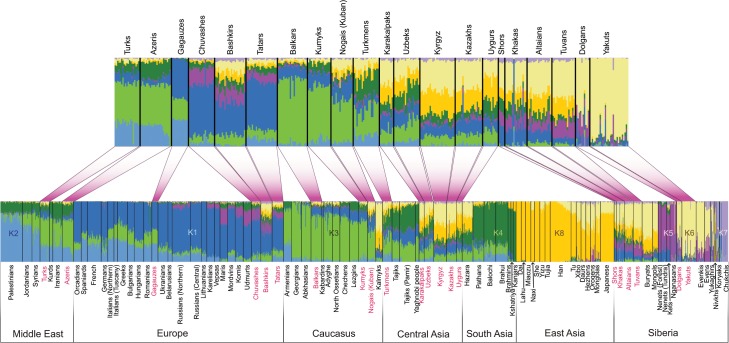
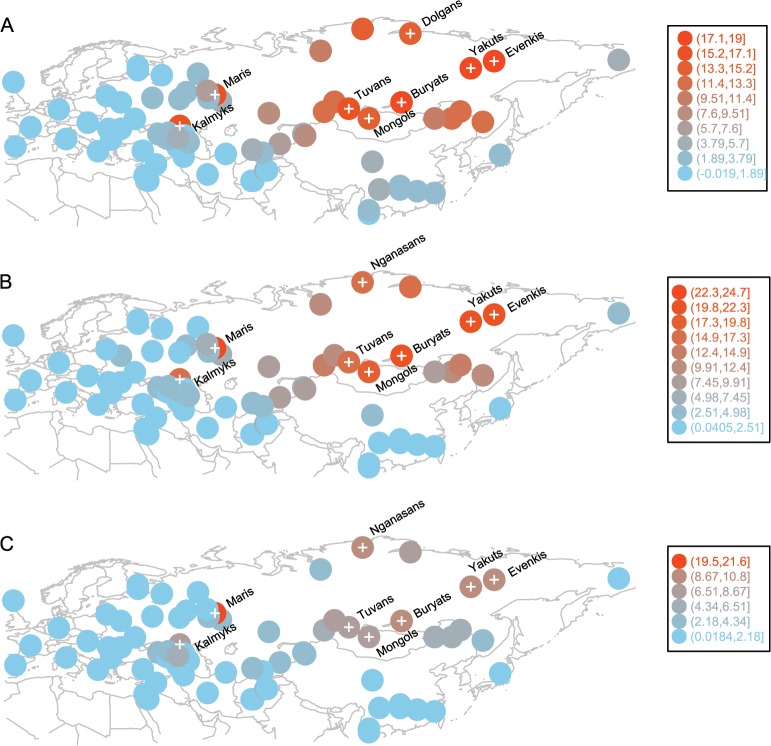
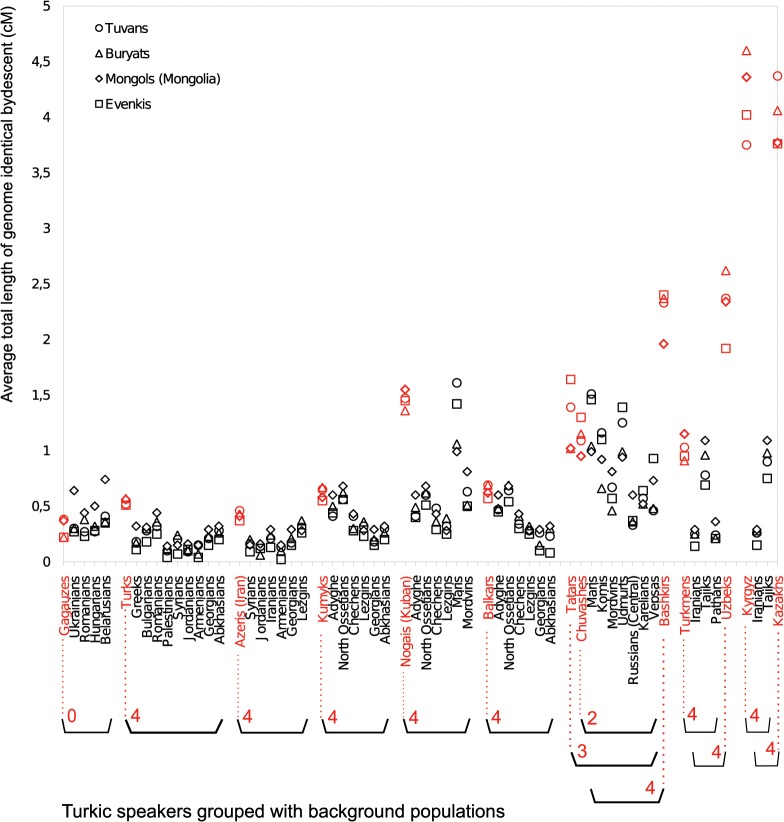
Verification
Claims the paper makes
The claims and statistics of this paper haven’t been checked yet.
Run the check — free, no account needed. It reads the open-access text and checks the sources it cites.
Claims other papers make about this one
Each is checked against this paper’s own text: does it say what the citing paper says it does?
In the citing paper
“However, genome wide studies have revealed large scale recent expansions in Eurasia [2,3] and it is still unclear whether or not there is a connection between the origin of C2*-ST and Genghis Khan.”
From Whole-sequence analysis indicates that the Y chromosome C2*-Star Cluster traces back to ordinary Mongols, rather than Genghis Khan (2018) · cites this paper as [2]
In the citing paper
“Since Q1a2-M346 spread across Europe at that time, it probably brought Q1a2b2-F1161 to Western and Northern Europe, and even to Western and Southern Asia (Khurana et al. 2014; Yunusbayev et al. 2015).”
From Dispersals of the Siberian Y-chromosome haplogroup Q in Eurasia (2018) · cites this paper as Yunusbayev et al. 2015
In the citing paper
“The results coincided with Turkic nomadic migrations from Southern Siberia and Mongolia to Central and Western Asia, Caucasus, and Eastern Europe (Yunusbayev et al. 2015).”
From Dispersals of the Siberian Y-chromosome haplogroup Q in Eurasia (2018) · cites this paper as Yunusbayev et al. 2015
In the citing paper
“A few Q1a1b-M25 and Q1a2-M346 samples in Mongolic-speaking populations probably indicated that Turkic nomads had overlapped with Mongolic-speaking populations when they lived in the present Mongolian territory (Yunusbayev et al. 2015).”
From Dispersals of the Siberian Y-chromosome haplogroup Q in Eurasia (2018) · cites this paper as Yunusbayev et al. 2015
Self-check
Percentages, sums and reported differences re-computed from the paper’s own numbers.
The self-check needs the paper’s full text.
Citations
Cites
A second generation human haplotype map of over 3.1 million SNPs
The International HapMap Consortium (2007) · Nature · doi:10.1038/nature06258 · Cited by 4,438
Robust relationship inference in genome-wide association studies
Manichaikul, A., Mychaleckyj, J. C., Rich, S. S., Daly, K., Sale, M., & Chen, W.-M. (2010) · Bioinformatics · doi:10.1093/bioinformatics/btq559 · Cited by 3,541
Ancient Admixture in Human History
Patterson, N., Moorjani, P., Luo, Y., Mallick, S., Rohland, N., Zhan, Y., Genschoreck, T., Webster, T., & Reich, D. (2012) · Genetics · doi:10.1534/genetics.112.145037 · Cited by 2,848
Reconstructing Indian population history
Reich, D., Thangaraj, K., Patterson, N., Price, A. L., & Singh, L. (2009) · Nature · doi:10.1038/nature08365 · Cited by 1,674
Upper Palaeolithic Siberian genome reveals dual ancestry of Native Americans
Raghavan, M., Skoglund, P., Graf, K. E., Metspalu, M., Albrechtsen, A., Moltke, I., Rasmussen, S., Stafford Jr, T. W., Orlando, L., Metspalu, E., et al. (2014) · Nature · doi:10.1038/nature12736 · Cited by 963
Self-citationAncient human genome sequence of an extinct Palaeo-Eskimo
Rasmussen, M., Li, Y., Lindgreen, S., Pedersen, J. S., Albrechtsen, A., Moltke, I., Metspalu, M., Metspalu, E., Kivisild, T., Gupta, R., et al. (2010) · Nature · doi:10.1038/nature08835 · Cited by 849
Self-citation
Research works printed but not linked: 35
- C Renfrew, 2010, Archaeogenetics—towards a 'new synthesis'?, Curr Biol, 20, R162, 10.1016/j.cub.2009.11.056 · DOI
- D Sinor, 1990, The Cambridge History of Early Inner Asia, 285
- M Bermisheva, 2002, Diversity of mitochondrial DNA haplotypes in ethnic populations of the Volga-Ural region of Russia, Mol Biol (Mosk), 36, 990, 10.1023/A:1021677708482 · DOI
- I Nasidze, 2003, Testing hypotheses of language replacement in the Caucasus: evidence from the Y-chromosome, Hum Genet, 112, 255, 10.1007/s00439-002-0874-4 · DOI
- C Cinnioglu, 2004, Excavating Y-chromosome haplotype strata in Anatolia, Hum Genet, 114, 127, 10.1007/s00439-003-1031-4 · DOI · Paper page
- A Varzari, 2009, Searching for the origin of Gagauzes: inferences from Y-chromosome analysis, Am J Hum Biol, 21, 326, 10.1002/ajhb.20863 · DOI
- B Malyarchuk, 2010, Mitogenomic diversity in Tatars from the Volga-Ural region of Russia, Mol Biol Evol, 27, 2220, 10.1093/molbev/msq065 · DOI
- B Yunusbayev, 2012, The Caucasus as an Asymmetric Semipermeable Barrier to Ancient Human Migrations, Mol Biol Evol, 29, 359, 10.1093/molbev/msr221 · DOI
- D Comas, 2004, Admixture, migrations, and dispersals in Central Asia: evidence from maternal DNA lineages, Eur J Hum Genet, 12, 495, 10.1038/sj.ejhg.5201160 · DOI · Paper page
- L Quintana-Murci, 2004, Where West meets East: The complex mtDNA landscape of the Southwest and Central Asian corridor, Am J Hum Genet, 74, 827, 10.1086/383236 · DOI · Paper page
- M Derenko, 2006, Contrasting patterns of Y-chromosome variation in south Siberian populations from Baikal and Altai-Sayan regions, Hum Genet, 118, 591, 10.1007/s00439-005-0076-y · DOI
- M Derenko, 2007, Phylogeographic analysis of mitochondrial DNA in northern Asian Populations, Am J Hum Genet, 81, 1025, 10.1086/522933 · DOI
- JZ Li, 2008, Worldwide human relationships inferred from genome-wide patterns of variation, Science, 319, 1100, 10.1126/science.1153717 · DOI
- DM Behar, 2010, The genome-wide structure of the Jewish people, Nature, 466, 238, 10.1038/nature09103 · DOI
- SA Fedorova, 2013, Autosomal and uniparental portraits of the native populations of Sakha (Yakutia): implications for the peopling of Northeast Eurasia, BMC evolutionary biology, 13, 127, 10.1186/1471-2148-13-127 · DOI
- J Di Cristofaro, 2013, Afghan Hindu Kush: where Eurasian sub-continent gene flows converge, PLoS One, 8, e76748, 10.1371/journal.pone.0076748 · DOI · Paper page
- U Hodoglugil, 2012, Turkish population structure and genetic ancestry reveal relatedness among Eurasian populations, Ann Hum Genet, 76, 128, 10.1111/j.1469-1809.2011.00701.x · DOI
- G Hellenthal, 2014, A genetic atlas of human admixture history, Science, 343, 747, 10.1126/science.1243518 · DOI · Paper page
- JK Pritchard, 2000, Association mapping in structured populations, Am J Hum Genet, 67, 170, 10.1086/302959 · DOI
- DH Alexander, 2009, Fast model-based estimation of ancestry in unrelated individuals, Genome Research, 19, 1655, 10.1101/gr.094052.109 · DOI · Paper page
- M Metspalu, 2011, Shared and Unique Components of Human Population Structure and Genome-Wide Signals of Positive Selection in South Asia, Am J Hum Genet, 89, 731, 10.1016/j.ajhg.2011.11.010 · DOI
- P Ralph, 2013, The Geography of Recent Genetic Ancestry across Europe, PLoS Biol, 11, 10.1371/journal.pbio.1001555 · DOI
- SR Browning, 2008, Estimation of pairwise identity by descent from dense genetic marker data in a population sample of haplotypes, Genetics, 178, 2123, 10.1534/genetics.107.084624 · DOI
- PR Loh, 2013, Inferring admixture histories of human populations using linkage disequilibrium, Genetics, 193, 1233, 10.1534/genetics.112.147330 · DOI · Paper page
- I Pugach, 2011, Dating the age of admixture via wavelet transform analysis of genome-wide data, Genome Biology, 12, R19, 10.1186/gb-2011-12-2-r19 · DOI
- AL Williams, 2012, Phasing of many thousands of genotyped samples, Am J Hum Genet, 91, 238, 10.1016/j.ajhg.2012.06.013 · DOI
- JJ Saunders, 1971
- G Mako, 2011, The Islamization of the Volga Bulghars: A Question Reconsidered, Archivum Eurasiae Medii Aevi, 18, 199
- DM Behar, 2013, No Evidence from Genome-Wide Data of a Khazar Origin for the Ashkenazi Jews, Human Biology, 85, 859, 10.3378/027.085.0604 · DOI
- BL Browning, 2011, A fast, powerful method for detecting identity by descent, Am J Hum Genet, 88, 173, 10.1016/j.ajhg.2011.01.010 · DOI
- S Banerjee, 2005, On geodetic distance computations in spatial modelling, Biometrics, 61, 617, 10.1111/j.1541-0420.2005.00320.x · DOI
- HM Cann, 2002, A human genome diversity cell line panel, Science, 296, 261, 10.1126/science.296.5566.261b · DOI
- J Ma, 2012, Principal components analysis of population admixture, Plos One, 7, e40115, 10.1371/journal.pone.0040115 · DOI
- GK Chen, 2009, Fast and flexible simulation of DNA sequence data, Genome Research, 19, 136, 10.1101/gr.083634.108 · DOI
- SF Schaffner, 2005, Calibrating a coalescent simulation of human genome sequence variation, Genome Research, 15, 1576, 10.1101/gr.3709305 · DOI · Paper page
Cited by
Genomic evidence for the Pleistocene and recent population history of Native Americans
Raghavan, M., Steinrücken, M., Harris, K., Schiffels, S., Rasmussen, S., DeGiorgio, M., Albrechtsen, A., Valdiosera, C., Ávila-Arcos, M. C., Malaspinas, A.-S., et al. (2015) · Science · doi:10.1126/science.aab3884 · Cited by 540
Self-citationWei, L.-H., Yan, S., Lu, Y., Wen, S.-Q., Huang, Y.-Z., Wang, L.-X., Li, S.-L., Yang, Y.-J., Wang, X.-F., Zhang, C., et al. (2018) · European Journal of Human Genetics · doi:10.1038/s41431-017-0012-3 · Cited by 57
The Connection of the Genetic, Cultural and Geographic Landscapes of Transoxiana
Zhabagin, M., Balanovska, E., Sabitov, Z., Kuznetsova, M., Agdzhoyan, A., Balaganskaya, O., Chukhryaeva, M., Markina, N., Romanov, A., Skhalyakho, R., et al. (2017) · Scientific Reports · doi:10.1038/s41598-017-03176-z · Cited by 39
Self-citationSex‐specific genetic diversity is shaped by cultural factors in Inner Asian human populations
Marchi, N., Hegay, T., Mennecier, P., Georges, M., Laurent, R., Whitten, M., Endicott, P., Aldashev, A., Dorzhu, C., Nasyrova, F., et al. (2017) · American Journal of Physical Anthropology · doi:10.1002/ajpa.23151 · Cited by 38
Dispersals of the Siberian Y-chromosome haplogroup Q in Eurasia
Huang, Y.-Z., Pamjav, H., Flegontov, P., Stenzl, V., Wen, S.-Q., Tong, X.-Z., Wang, C.-C., Wang, L.-X., Wei, L.-H., Gao, J.-Y., et al. (2018) · Molecular Genetics and Genomics · doi:10.1007/s00438-017-1363-8 · Cited by 34
Metadata
- Authors
- Yunusbayev, B., Metspalu, M., Metspalu, E., Valeev, A., Litvinov, S., Valiev, R., Akhmetova, V., Balanovska, E., Balanovsky, O., Turdikulova, S., Dalimova, D., Nymadawa, P., Bahmanimehr, A., Sahakyan, H., Tambets, K., Fedorova, S., Barashkov, N., Khidiyatova, I., Mihailov, E., Khusainova, R., Damba, L., Derenko, M., Malyarchuk, B., Osipova, L., Voevoda, M., Yepiskoposyan, L., Kivisild, T., Khusnutdinova, E., & Villems, R.
- Venue
- PLOS Genetics
- Publisher
- Public Library of Science (PLoS)
- Published
- 2015-04-21
- Volume
- 11
- Issue
- 4
- Pages
- e1005068
- ISSN
- 1553-7404
- PMC
- PMC4405460
- Cited by
- 176
- References
- 6
- Language
- en
About these checks
Registry, retraction, Cites and statistics results are computed, not judged, with one exception: a printed reference that no index lists is read once by a model before it counts as a citation error. Claims are extracted by a model and kept only when their quote appears verbatim in the text; each cited source is then checked, with a model’s help, for whether it says what the claim relies on. Those verdicts can be wrong — read the claim’s quote and the cited source before relying on one.
Statistics and arithmetic are recomputed, not judged.
Confidence bands are shown only for fields calibrated on our annotated test set. None is calibrated yet, so no band is shown.
What counts as a claim ›How we measure confidence ›How we check this ›
Are you an author, or do you see a problem with this page? Request a review
