

The DOI matches its Crossref record; 96 of the 96 references it cites were found in a registry or an index.
Deep learning for lung cancer prognostication: A retrospective multi-cohort radiomics study
Open accessAbstract
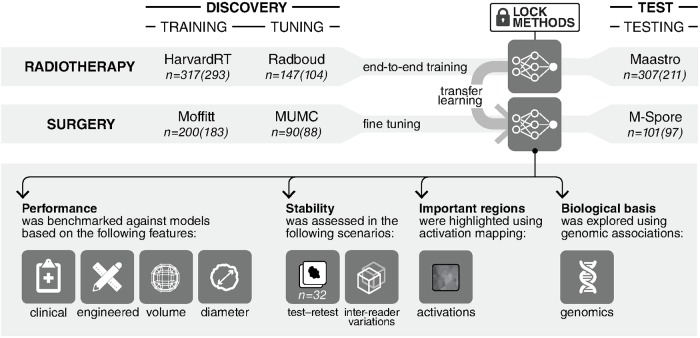
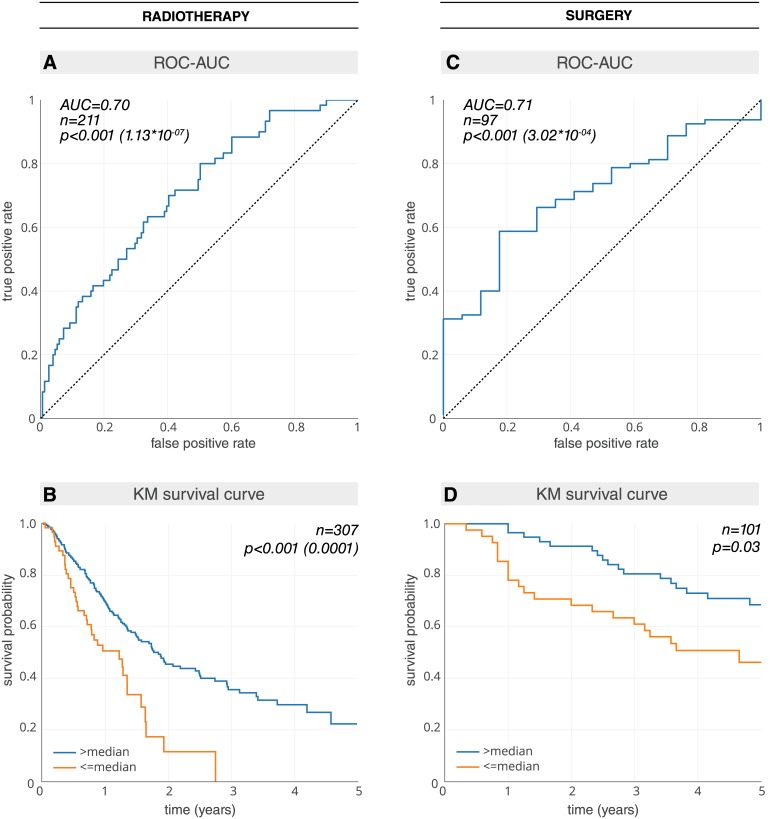
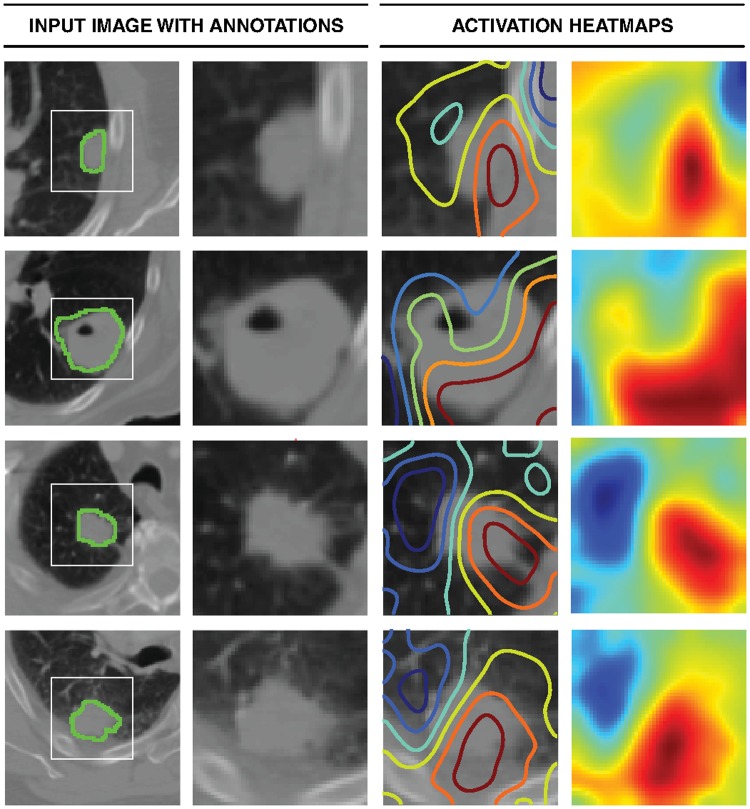
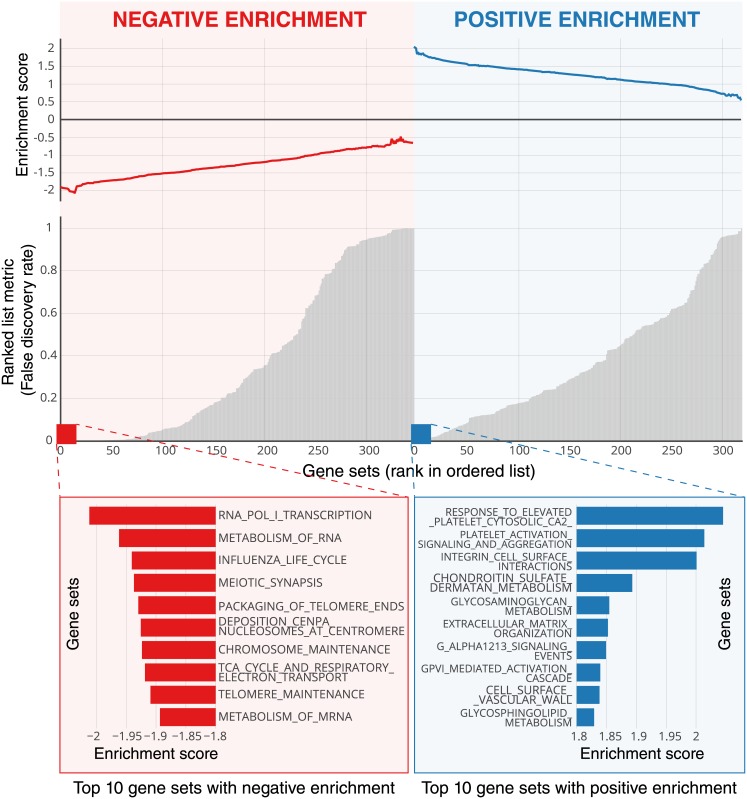
BACKGROUND: Non-small-cell lung cancer (NSCLC) patients often demonstrate varying clinical courses and outcomes, even within the same tumor stage. This study explores deep learning applications in medical imaging allowing for the automated quantification of radiographic characteristics and potentially improving patient stratification. METHODS AND FINDINGS: We performed an integrative analysis on 7 independent datasets across 5 institutions totaling 1,194 NSCLC patients (age median = 68.3 years [range 32.5-93.3], survival median = 1.7 years [range 0.0-11.7]). Using external validation in computed tomography (CT) data, we identified prognostic signatures using a 3D convolutional neural network (CNN) for patients treated with radiotherapy (n = 771, age median = 68.0 years [range 32.5-93.3], survival median = 1.3 years [range 0.0-11.7]). We then employed a transfer learning approach to achieve the same for surgery patients (n = 391, age median = 69.1 years [range 37.2-88.0], survival median = 3.1 years [range 0.0-8.8]). We found that the CNN predictions were significantly associated with 2-year overall survival from the start of respective treatment for radiotherapy (area under the receiver operating characteristic curve [AUC] = 0.70 [95% CI 0.63-0.78], p < 0.001) and surgery (AUC = 0.71 [95% CI 0.60-0.82], p < 0.001) patients. The CNN was also able to significantly stratify patients into low and high mortality risk groups in both the radiotherapy (p < 0.001) and surgery (p = 0.03) datasets. Additionally, the CNN was found to significantly outperform random forest models built on clinical parameters-including age, sex, and tumor node metastasis stage-as well as demonstrate high robustness against test-retest (intraclass correlation coefficient = 0.91) and inter-reader (Spearman's rank-order correlation = 0.88) variations. To gain a better understanding of the characteristics captured by the CNN, we identified regions with the most contribution towards predictions and highlighted the importance of tumor-surrounding tissue in patient stratification. We also present preliminary findings on the biological basis of the captured phenotypes as being linked to cell cycle and transcriptional processes. Limitations include the retrospective nature of this study as well as the opaque black box nature of deep learning networks. CONCLUSIONS: Our results provide evidence that deep learning networks may be used for mortality risk stratification based on standard-of-care CT images from NSCLC patients. This evidence motivates future research into better deciphering the clinical and biological basis of deep learning networks as well as validation in prospective data.
Overview
The claims and statistics of this paper haven’t been checked yet.
Run the check — free, no account needed. It reads the open-access text and checks the sources it cites.
Integrity signals
Registry
Cites
Statistics
Figures
Verification
Claims the paper makes
The claims and statistics of this paper haven’t been checked yet.
Run the check — free, no account needed. It reads the open-access text and checks the sources it cites.
Claims other papers make about this one
Each is checked against this paper’s own text: does it say what the citing paper says it does?
The source backs part of the claim, not all of it — or backs it for a different population, condition or comparison.
In the citing paper
“Especially in medical imaging there is a large potential as deep learning can successfully be used for identifying and segmenting objects within the 3-dimensional (3D) image space13–16.”
From Deep convolutional neural networks to predict cardiovascular risk from computed tomography (2021) · cites this paper as [15]
Experimental — accuracy not yet measuredIn the citing paper
“Deep-learning methods, in comparison, are robust to differences in acquisition and segmentation variability and provide improved performance10.”
From Foundation Model for Cancer Imaging Biomarkers (2024) · cites this paper as [10]
In the citing paper
“While many studies investigating imaging-based biomarkers incorporate supervised deep-learning algorithms into their models9–11, they are typically applied in scenarios where large datasets are available for training and testing.”
From Foundation Model for Cancer Imaging Biomarkers (2024) · cites this paper as [10]
Self-check
Percentages, sums and reported differences re-computed from the paper’s own numbers.
The self-check needs the paper’s full text.
Citations
Cites
ImageNet classification with deep convolutional neural networks
Krizhevsky, A., Sutskever, I., & Hinton, G. E. (2017) · Communications of the ACM · doi:10.1145/3065386 · Cited by 112,155
Controlling the False Discovery Rate: A Practical and Powerful Approach to Multiple Testing
Benjamini, Y., & Hochberg, Y. (1995) · Journal of the Royal Statistical Society Series B: Statistical Methodology · doi:10.1111/j.2517-6161.1995.tb02031.x · Cited by 109,482
Adam: A Method for Stochastic Optimization
Kingma, D. P., & Ba, J. (2014) · arXiv · doi:10.48550/arxiv.1412.6980 · Cited by 98,946
Jemal, A., Bray, F., Ferlay, J., Ward, E., & Forman, D. (2011) · CA A Cancer Journal for Clinicians · doi:10.3322/caac.20107 · Cited by 55,077
Subramanian, A., Tamayo, P., Mootha, V. K., Mukherjee, S., Ebert, B. L., Gillette, M. A., Paulovich, A., Pomeroy, S. L., Golub, T. R., Lander, E. S., et al. (2005) · Proceedings of the National Academy of Sciences · doi:10.1073/pnas.0506580102 · Cited by 53,625
Fully convolutional networks for semantic segmentation
Long, J., Shelhamer, E., & Darrell, T. (2015) · 2015 IEEE Conference on Computer Vision and Pattern Recognition (CVPR) · doi:10.1109/cvpr.2015.7298965 · Cited by 38,834
(2014) · Cited by 33,419
Batch Normalization: Accelerating Deep Network Training by Reducing Internal Covariate Shift
Ioffe, S., & Szegedy, C. (2015) · arXiv · doi:10.48550/arxiv.1502.03167 · Cited by 27,818
Global cancer statistics, 2012
Torre, L. A., Bray, F., Siegel, R. L., Ferlay, J., Lortet‐Tieulent, J., & Jemal, A. (2015) · CA A Cancer Journal for Clinicians · doi:10.3322/caac.21262 · Cited by 27,235
Grad-CAM: Visual Explanations from Deep Networks via Gradient-Based Localization
Selvaraju, R. R., Cogswell, M., Das, A., Vedantam, R., Parikh, D., & Batra, D. (2017) · 2017 IEEE International Conference on Computer Vision (ICCV) · doi:10.1109/iccv.2017.74 · Cited by 24,513
Pan, S. J., & Yang, Q. (2010) · IEEE Transactions on Knowledge and Data Engineering · doi:10.1109/tkde.2009.191 · Cited by 23,387
Advances in neural information processing systems 7
Cios, K. J., & Shields, M. E. (1997) · Neurocomputing · doi:10.1016/s0925-2312(97)90018-7 · Cited by 22,093
A survey on deep learning in medical image analysis
Litjens, G., Kooi, T., Bejnordi, B. E., Setio, A. A. A., Ciompi, F., Ghafoorian, M., van der Laak, J. A. W. M., van Ginneken, B., & Sánchez, C. I. (2017) · Medical Image Analysis · doi:10.1016/j.media.2017.07.005 · Cited by 15,332
Batch Normalization: Accelerating Deep Network Training by Reducing Internal Covariate ShiftPreprint
Ioffe, S. (2024) · arXiv (Cornell University) · doi:10.57702/o9raffed · Cited by 15,273
Dermatologist-level classification of skin cancer with deep neural networks
Esteva, A., Kuprel, B., Novoa, R. A., Ko, J., Swetter, S. M., Blau, H. M., & Thrun, S. (2017) · Nature · doi:10.1038/nature21056 · Cited by 14,362
Advances in Neural Information Processing Systems 25
Zhang, Y., Sutton, C. A., Storkey, A., & Zoubin Ghahramani, A. (2012) · Cited by 12,653
V-Net: Fully Convolutional Neural Networks for Volumetric Medical Image Segmentation
Milletari, F., Navab, N., & Ahmadi, S.-A. (2016) · 2016 Fourth International Conference on 3D Vision (3DV) · doi:10.1109/3dv.2016.79 · Cited by 11,931
Fully convolutional networks for semantic segmentation
Shelhamer, E., Long, J., & Darrell, T. (2017) · IEEE Transactions on Pattern Analysis and Machine Intelligence · doi:10.1109/tpami.2016.2572683 · Cited by 11,898
Exploration, normalization, and summaries of high density oligonucleotide array probe level data
Irizarry, R. A. (2003) · Biostatistics · doi:10.1093/biostatistics/4.2.249 · Cited by 10,603
TensorFlow: Large-Scale Machine Learning on Heterogeneous Distributed Systems
Abadi, M., Agarwal, A., Barham, P., Brevdo, E., Chen, Z., Citro, C., Corrado, G. S., Davis, A., Dean, J., Devin, M., et al. (2016) · arXiv · doi:10.48550/arxiv.1603.04467 · Cited by 9,408
Building Predictive Models in R Using the caret Package
Kuhn, M. (2008) · Journal of Statistical Software · doi:10.18637/jss.v028.i05 · Cited by 8,863
Gulshan, V., Peng, L., Coram, M., Stumpe, M. C., Wu, D., Narayanaswamy, A., Venugopalan, S., Widner, K., Madams, T., Cuadros, J., et al. (2016) · JAMA · doi:10.1001/jama.2016.17216 · Cited by 7,697
Molecular signatures database (MSigDB) 3.0
Liberzon, A., Subramanian, A., Pinchback, R., Thorvaldsdóttir, H., Tamayo, P., & Mesirov, J. P. (2011) · Bioinformatics · doi:10.1093/bioinformatics/btr260 · Cited by 7,111
Computational Radiomics System to Decode the Radiographic Phenotype
(2017) · doi:10.1158/0008-5472.can-17-0339 · Cited by 6,593
Self-citationAmin, M. B., Greene, F. L., Edge, S. B., Compton, C. C., Gershenwald, J. E., Brookland, R. K., Meyer, L., Gress, D. M., Byrd, D. R., & Winchester, D. P. (2017) · CA A Cancer Journal for Clinicians · doi:10.3322/caac.21388 · Cited by 6,531
Radiomics: extracting more information from medical images using advanced feature analysis
Lambin, P., Rios-Velazquez, E., Leijenaar, R., Carvalho, S., van Stiphout, R. G. P. M., Granton, P., Zegers, C. M. L., Gillies, R., Boellard, R., Dekker, A., et al. (2012) · European Journal of Cancer · doi:10.1016/j.ejca.2011.11.036 · Cited by 6,084
Self-citationRadiomics: the bridge between medical imaging and personalized medicine
Lambin, P., Leijenaar, R. T. H., Deist, T. M., Peerlings, J., de Jong, E. E. C., van Timmeren, J., Sanduleanu, S., Larue, R. T. H. M., Even, A. J. G., Jochems, A., et al. (2017) · Nature Reviews Clinical Oncology · doi:10.1038/nrclinonc.2017.141 · Cited by 5,688
Decoding tumour phenotype by noninvasive imaging using a quantitative radiomics approach
Aerts, H. J. W. L., Velazquez, E. R., Leijenaar, R. T. H., Parmar, C., Grossmann, P., Carvalho, S., Bussink, J., Monshouwer, R., Haibe-Kains, B., Rietveld, D., et al. (2014) · Nature Communications · doi:10.1038/ncomms5006 · Cited by 5,132
Self-citationNon-Small Cell Lung Cancer: Epidemiology, Risk Factors, Treatment, and Survivorship
Molina, J. R., Yang, P., Cassivi, S. D., Schild, S. E., & Adjei, A. A. (2008) · Mayo Clinic Proceedings · doi:10.4065/83.5.584 · Cited by 3,991
Artificial intelligence in radiology
Hosny, A., Parmar, C., Quackenbush, J., Schwartz, L. H., & Aerts, H. J. W. L. (2018) · Nature Reviews Cancer · doi:10.1038/s41568-018-0016-5 · Cited by 3,803
Self-citationNon-small Cell Lung Cancer Collaborative Group (1995) · BMJ · doi:10.1136/bmj.311.7010.899 · Cited by 3,054
(2011) · Cited by 2,752
Villalba, J. B. (1996) · Lung Cancer · doi:10.1016/0169-5002(96)85918-6 · Cited by 2,510
Medical Image Computing and Computer-Assisted Intervention -- MICCAI 2015
Navab, N., Joachim Hornegger, A., Wells, W. M., & Frangi, A. F. (2015) · Lecture notes in computer science · doi:10.1007/978-3-319-24553-9 · Cited by 2,288
The causes and consequences of genetic heterogeneity in cancer evolution
Burrell, R. A., McGranahan, N., Bartek, J., & Swanton, C. (2013) · Nature · doi:10.1038/nature12625 · Cited by 2,262
Non-small cell lung cancer: current treatment and future advances
Zappa, C., & Mousa, S. A. (2016) · Translational Lung Cancer Research · doi:10.21037/tlcr.2016.06.07 · Cited by 1,944
Adversarial Examples: Attacks and Defenses for Deep Learning
Yuan, X., He, P., Zhu, Q., & Li, X. (2019) · IEEE Transactions on Neural Networks and Learning Systems · doi:10.1109/tnnls.2018.2886017 · Cited by 1,733
Opening the Black Box of Deep Neural Networks via InformationPreprint
Shwartz-Ziv, R., & Tishby, N. (2017) · arXiv.org · doi:10.48550/arxiv.1703.00810 · Cited by 1,674
Feature selection, L 1 vs. L 2 regularization, and rotational invariance
Ng, A. Y. (2004) · Twenty-first international conference on Machine learning - ICML '04 · doi:10.1145/1015330.1015435 · Cited by 1,572 · cited 1×
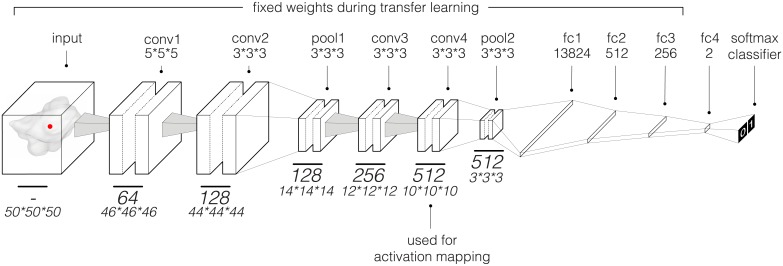
“Training details are as follows: We used the gradient-based stochastic optimizer Adam [34] with a global learning rate of 1 × 10 without decay, a batch size of 16, dropout [35] of 25% and 50% on the convolutional and fully connected layers, respectively, and a L2 regularization [36] penalty term of 1 × 10.”
MethodTumors as Organs: Complex Tissues that Interface with the Entire Organism
Egeblad, M., Nakasone, E. S., & Werb, Z. (2010) · Developmental Cell · doi:10.1016/j.devcel.2010.05.012 · Cited by 1,294
Machine Learning methods for Quantitative Radiomic Biomarkers
Parmar, C., Großmann, P., Bussink, J., Lambin, P., & Aerts, H. J. W. L. (2015) · Scientific Reports · doi:10.1038/srep13087 · Cited by 1,062
Self-citationMedical Image Computing and Computer Assisted Intervention – MICCAI 2018
Frangi, A. F., Schnabel, J. A., Davatzikos, C. A., Alberola-López, C., & Fichtinger, G. (2018) · Lecture notes in computer science · doi:10.1007/978-3-030-00937-3 · Cited by 1,049
Visual interpretability for deep learning: a survey
Zhang, Q., & Zhu, S. C. (2018) · Frontiers of Information Technology & Electronic Engineering · doi:10.1631/fitee.1700808 · Cited by 1,018
Large scale deep learning for computer aided detection of mammographic lesions
Kooi, T., Litjens, G., van Ginneken, B., Gubern-Mérida, A., Sánchez, C. I., Mann, R., den Heeten, A., & Karssemeijer, N. (2017) · Medical Image Analysis · doi:10.1016/j.media.2016.07.007 · Cited by 965
Prechelt, L. (2012) · Lecture notes in computer science · doi:10.1007/978-3-642-35289-8_5 · Cited by 952
Neural Networks: Tricks of the Trade
Orr, G., & Müller, K.-R. (1998) · Lecture notes in computer science · doi:10.1007/3-540-49430-8 · Cited by 817
CT-based radiomic signature predicts distant metastasis in lung adenocarcinoma
Coroller, T. P., Grossmann, P., Hou, Y., Rios Velazquez, E., Leijenaar, R. T. H., Hermann, G., Lambin, P., Haibe-Kains, B., Mak, R. H., & Aerts, H. J. W. L. (2015) · Radiotherapy and Oncology · doi:10.1016/j.radonc.2015.02.015 · Cited by 695
Self-citationQuicksilver: Fast predictive image registration – A deep learning approach
Yang, X., Kwitt, R., Styner, M., & Niethammer, M. (2017) · NeuroImage · doi:10.1016/j.neuroimage.2017.07.008 · Cited by 630 · cited 1×
“Deep learning methods have outperformed their engineered feature counterparts in many tasks including mammographic lesion detection [21], mortality prediction [22], and multimodal image registration [23].”
MethodA deep learning-based radiomics model for prediction of survival in glioblastoma multiforme
Lao, J., Chen, Y., Li, Z.-C., Li, Q., Zhang, J., Liu, J., & Zhai, G. (2017) · Scientific Reports · doi:10.1038/s41598-017-10649-8 · Cited by 630
Recurrence after surgery in patients with NSCLC.
Uramoto, H., & Tanaka, F. (2014) · PubMed · doi:10.3978/j.issn.2218-6751.2013.12.05 · Cited by 545
Roa, Á. A. C., Gilmore, H. L., Basavanhally, A. N., Feldman, M. D., Ganesan, S., Shih, N. N. C., Tomaszewski, J., Gonzalez, F. A., & Madabhushi, A. (2017) · Scientific Reports · doi:10.1038/srep46450 · Cited by 542
A CNN Regression Approach for Real-Time 2D/3D Registration
Miao, S., Wang, Z. J., & Liao, R. (2016) · IEEE Transactions on Medical Imaging · doi:10.1109/tmi.2016.2521800 · Cited by 514
survcomp : an R/Bioconductor package for performance assessment and comparison of survival models
Schröder, M., Culhane, A. C., Quackenbush, J. F., & Haibe‐Kains, B. (2011) · Bioinformatics · doi:10.1093/bioinformatics/btr511 · Cited by 472
Non–Small Cell Lung Cancer: Histopathologic Correlates for Texture Parameters at CT
Ganeshan, B., Goh, V., Mandeville, H., Ng, Q. S., Hoskin, P., & Miles, K. A. (2012) · Radiology · doi:10.1148/radiol.12112428 · Cited by 447
Arriagada, R., Dunant, A., Pignon, J., Bergman, B., Chabowski, M., Grunenwald, D. H., Kozłowski, M., Pechoux, C. L., Pirker, R., Pinel, M. I. S., et al. (2009) · Journal of Clinical Oncology · doi:10.1200/jco.2009.23.2272 · Cited by 394
Defining the biological basis of radiomic phenotypes in lung cancer
Grossmann, P., Stringfield, O., El-Hachem, N., Bui, M. M., Rios Velazquez, E., Parmar, C., Leijenaar, R. T., Haibe-Kains, B., Lambin, P., Gillies, R. J., et al. (2017) · eLife · doi:10.7554/elife.23421 · Cited by 365
Self-citationSculier, J., Chansky, K., Crowley, J. J., van Meerbeeck, J. P., & Goldstraw, P. G. (2008) · Journal of Thoracic Oncology · doi:10.1097/jto.0b013e31816de2b8 · Cited by 337
Zhao, B., James, L. P., Moskowitz, C. S., Guo, P., Ginsberg, M. S., Lefkowitz, R. A., Qin, Y., Riely, G. J., Kris, M. G., & Schwartz, L. H. (2009) · Radiology · doi:10.1148/radiol.2522081593 · Cited by 337
Radiomic phenotype features predict pathological response in non-small cell lung cancer
Coroller, T. P., Agrawal, V., Narayan, V., Hou, Y., Großmann, P., Lee, S. W., Mak, R. H., & Aerts, H. J. W. L. (2016) · Radiotherapy and Oncology · doi:10.1016/j.radonc.2016.04.004 · Cited by 331
Self-citationGaneshan, B., Abaleke, S., Young, R. C. D., Chatwin, C. R., & Miles, K. A. (2010) · Cancer Imaging · doi:10.1102/1470-7330.2010.0021 · Cited by 324
Adversarial Attacks Against Medical Deep Learning SystemsPreprint
Finlayson, S. G., Chung, H. W., Kohane, I. S., & Beam, A. L. (2018) · arXiv (Cornell University) · doi:10.48550/arxiv.1804.05296 · Cited by 289
mRMRe: an R package for parallelized mRMR ensemble feature selection
Jay, N. D., Papillon‐Cavanagh, S., Olsen, C., El-Hachem, N., Bontempi, G., & Haibe‐Kains, B. (2013) · Bioinformatics · doi:10.1093/bioinformatics/btt383 · Cited by 278
The 7th lung cancer TNM classification and staging system: Review of the changes and implications
Mirsadraee, S. (2012) · World Journal of Radiology · doi:10.4329/wjr.v4.i4.128 · Cited by 263
HOANG, T. N., Xu, R., Schiller, J. H., Bonomi, P., & Johnson, D. H. (2004) · Journal of Clinical Oncology · doi:10.1200/jco.2005.04.177 · Cited by 262
The process for continuous improvement of the TNM classification
Gospodarowicz, M. K., Miller, D., Groome, P., Greene, F., Logan, P., & Sobin, L. (2004) · Cancer · doi:10.1002/cncr.11898 · Cited by 257
Brain tumor grading based on Neural Networks and Convolutional Neural Networks
Pan, Y., Huang, W., Lin, Z., Zhu, W., Zhou, J., Wong, J., & Ding, Z. (2015) · Annual International Conference of the IEEE Engineering in Medicine and Biology Society (EMBC) · doi:10.1109/embc.2015.7318458 · Cited by 247
Radiomic machine-learning classifiers for prognostic biomarkers of advanced nasopharyngeal carcinoma
Zhang, B., He, X. J., Ouyang, F., Gu, D., Dong, Y., Zhang, L., Mo, X., Huang, W., Tian, J., & Zhang, S. (2017) · Cancer Letters · doi:10.1016/j.canlet.2017.06.004 · Cited by 246
Ghafoorian, M., Karssemeijer, N., Heskes, T., van Uden, I. W. M., Sanchez, C. I., Litjens, G., de Leeuw, F.-E., van Ginneken, B., Marchiori, E., & Platel, B. (2017) · Scientific Reports · doi:10.1038/s41598-017-05300-5 · Cited by 236
p53 Mutations and Survival in Stage I Non-Small-Cell Lung Cancer: Results of a Prospective Study
Ahrendt, S. A., Hu, Y. C., Buta, M. R., McDermott, M., Benoit, N. E., Yang, S. C., Wu, L., & Sidransky, D. (2003) · JNCI Journal of the National Cancer Institute · doi:10.1093/jnci/95.13.961 · Cited by 220
CT-based radiomic analysis of stereotactic body radiation therapy patients with lung cancer
Huynh, E., Coroller, T. P., Narayan, V., Agrawal, V., Hou, Y., Romano, J., Franco, I. “., Mak, R. H., & Aerts, H. J. W. L. (2016) · Radiotherapy and Oncology · doi:10.1016/j.radonc.2016.05.024 · Cited by 215
Self-citationPaul, R., Hawkins, S. H., Balagurunathan, Y., Schabath, M. B., Gillies, R. J., Hall, L., & Goldgof, D. B. (2016) · Tomography · doi:10.18383/j.tom.2016.00211 · Cited by 183
Self-citationZhang, J. J., Gold, K. A., Lin, H. Y., Swisher, S. G., Xing, Y., Lee, J. J., Kim, E. S., & William, W. N. (2015) · Journal of Thoracic Oncology · doi:10.1097/jto.0000000000000456 · Cited by 175
Variability of Lung Tumor Measurements on Repeat Computed Tomography Scans Taken Within 15 Minutes
Oxnard, G. R., Zhao, B., Sima, C. S., Ginsberg, M. S., James, L. P., Lefkowitz, R. A., Guo, P., Kris, M. G., Schwartz, L. H., & Riely, G. J. (2011) · Journal of Clinical Oncology · doi:10.1200/jco.2010.33.7071 · Cited by 161
3D Deep Learning for Efficient and Robust Landmark Detection in Volumetric Data
Zheng, Y., Liu, D., Georgescu, B., Nguyen, H. V., & Comaniciu, D. (2015) · Lecture notes in computer science · doi:10.1007/978-3-319-24553-9_69 · Cited by 151
Ghafoorian, M., Karssemeijer, N., Heskes, T., Bergkamp, M. I., Wissink, J., Obels, J., Keizer, K., de Leeuw, F., van Ginneken, B., Marchiori, E., et al. (2017) · NeuroImage Clinical · doi:10.1016/j.nicl.2017.01.033 · Cited by 151
Oikonomou, A., Khalvati, F., Tyrrell, P. N., Haider, M. A., Tarique, U., Jiménez‐Juan, L., Tjong, M. C., Poon, I., Eilaghi, A., Ehrlich, L. E., et al. (2018) · Scientific Reports · doi:10.1038/s41598-018-22357-y · Cited by 151
Wang, X., Janowczyk, A. R., Zhou, Y., Thawani, R., Fu, P., Schalper, K. A., Velcheti, V., & Madabhushi, A. (2017) · Scientific Reports · doi:10.1038/s41598-017-13773-7 · Cited by 131
Imaging genomics in cancer research: limitations and promises
Bai, H. X., Lee, A. M., Yang, L., Zhang, P. J., Davatzikos, C. A., Maris, J. M., & Diskin, S. J. (2016) · British Journal of Radiology · doi:10.1259/bjr.20151030 · Cited by 114
Forsberg, D., Sjöblom, E., & Sunshine, J. L. (2017) · Journal of Imaging Informatics in Medicine · doi:10.1007/s10278-017-9945-x · Cited by 113
Oberije, C., Nalbantov, G. I., Dekker, A. L. A. J., Boersma, L. J., Borger, J. H., Reymen, B. J. T., van Baardwijk, A. A. W., Wanders, R., Ruysscher, D. D., Steyerberg, E. W., et al. (2014) · Radiotherapy and Oncology · doi:10.1016/j.radonc.2014.04.012 · Cited by 96
Großmann, P., Gutman, D. A., Dunn, W. D., Holder, C. A., & Aerts, H. J. W. L. (2016) · BMC Cancer · doi:10.1186/s12885-016-2659-5 · Cited by 77
Self-citationBiomarkers in Early-Stage Non-Small Cell Lung Cancer: Current Concepts and Future Directions
Burotto, M., Thomas, A., Subramaniam, D. S., Giaccone, G., & Rajan, A. (2014) · Journal of Thoracic Oncology · doi:10.1097/jto.0000000000000302 · Cited by 62
Beyer, T., Fournier, L. S., Goldberg, N. S., Kauczor, H., Lotz, J. W., Manfredi, R. M., Ratib, O. M., & Rodriguez-Carnero, P. (2015) · Archive ouverte UNIGE (University of Geneva) · Cited by 62
Predictive and Prognostic Biomarkers in Non-Small Cell Lung Cancer
Gadgeel, S. M., & Thakur, M. K. (2016) · Seminars in Respiratory and Critical Care Medicine · doi:10.1055/s-0036-1592337 · Cited by 62
A Deep Learning Architecture for Limited-Angle Computed Tomography Reconstruction
Hammernik, K., Würfl, T., Pock, T., & Maier, A. (2017) · Informatik aktuell · doi:10.1007/978-3-662-54345-0_25 · Cited by 58
Recurrence Risk Factors Analysis for Stage I Non-small Cell Lung Cancer
Wu, C., Fu, J., Yeh, C., Liu, Y., Hsieh, M., Wu, Y., Wu, C.-Y., Tsai, Y., & Chou, W. (2015) · Medicine · doi:10.1097/md.0000000000001337 · Cited by 57
European Society of Radiology (2011) · Insights into Imaging · doi:10.1007/s13244-011-0125-0 · Cited by 45
Pepek, J. M., Chino, J., Marks, L. B., D’Amico, T. A., Yoo, D. S., Onaitis, M. W., Ready, N., Hubbs, J. L., Boyd, J. A., & Kelsey, C. R. (2011) · Journal of Thoracic Oncology · doi:10.1097/jto.0b013e31821038c0 · Cited by 43
Lundström, C. F., Gilmore, H. L., & Ros, P. R. (2017) · Radiology · doi:10.1148/radiol.2017170062 · Cited by 35
Cistaro, A., Quartuccio, N., Mojtahedi, A., Fania, P., Filosso, P. L., Campennì, A., Ficola, U., & Baldari, S. (2013) · Radiology and Oncology · doi:10.2478/raon-2013-0023 · Cited by 31
Carneiro, G., Oakden‐Rayner, L., Bradley, A. P., Nascimento, J. C., & Palmer, L. J. (2017) · IEEE International Symposium on Biomedical Imaging (ISBI) · doi:10.1109/isbi.2017.7950485 · Cited by 31
Kim, H., Park, C. M., Keam, B., Park, S. J., Kim, M., Kim, T. M., Kim, D., Heo, D. S., & Goo, J. M. (2017) · PLoS ONE · doi:10.1371/journal.pone.0187500 · Cited by 31
El-Hachem, N., Großmann, P., Blanchet-Cohen, A., Bateman, A. R., Bouchard, N., Archambault, J., Aerts, H. J. W. L., & Haibe‐Kains, B. (2015) · Environmental Health Perspectives · doi:10.1289/ehp.1409157 · Cited by 20
Self-citationShien, K., Toyooka, S., Soh, J., Yamamoto, H., & Miyoshi, S. (2017) · Journal of Thoracic Disease · doi:10.21037/jtd.2017.03.183 · Cited by 4
Zhang, J. J., Gold, K. A., Lin, H. Y., Swisher, S. G., Lippman, S. M., Lee, J. J., Kim, E. S., & William, W. (2012) · Journal of Clinical Oncology · doi:10.1200/jco.2012.30.15_suppl.7047 · Cited by 3
Research works printed but not linked: 1
- Maas AL, Hannun AY, Ng AY. Rectifier nonlinearities improve neural network acoustic models. 30th International Conference on Machine Learning; 2013 Jun 16–21; Atlanta, GA, US.
Cited by
Sorted by citations
Explainable artificial intelligence (XAI) in deep learning-based medical image analysis
van der Velden, B. H. M., Kuijf, H. J., Gilhuijs, K. G. A., & Viergever, M. A. (2022) · Medical Image Analysis · doi:10.1016/j.media.2022.102470 · Cited by 1,328
Predicting cancer outcomes with radiomics and artificial intelligence in radiology
Bera, K., Braman, N., Gupta, A., Velcheti, V., & Madabhushi, A. (2022) · Nature Reviews Clinical Oncology · doi:10.1038/s41571-021-00560-7 · Cited by 819
Harnessing multimodal data integration to advance precision oncology
Boehm, K. M., Khosravi, P., Vanguri, R., Gao, J., & Shah, S. P. (2022) · Nature Reviews Cancer · doi:10.1038/s41568-021-00408-3 · Cited by 662
The Future of Sensitivity Analysis: An essential discipline for systems modeling and policy support
Razavi, S., Jakeman, A. J., Saltelli, A., Prieur, C., Iooss, B., Borgonovo, E., Plischke, E., Piano, S. L., Iwanaga, T., Becker, W., et al. (2020) · Environmental Modelling & Software · doi:10.1016/j.envsoft.2020.104954 · Cited by 703
Deep Learning Predicts Lung Cancer Treatment Response from Serial Medical Imaging
Xu, Y., Hosny, A., Zeleznik, R., Parmar, C., Coroller, T. P., Franco, I. “., Mak, R. H., & Aerts, H. J. W. L. (2019) · Clinical Cancer Research · doi:10.1158/1078-0432.ccr-18-2495 · Cited by 658
Self-citation
Metadata
- Authors
- Hosny, A., Parmar, C., Coroller, T. P., Grossmann, P., Zeleznik, R., Kumar, A., Bussink, J., Gillies, R. J., Mak, R. H., & Aerts, H. J. W. L.
- Affiliations
- Brigham and Women's Hospital (US)
- Radboud University Medical Center (NL)
- Moffitt Cancer Center (US)
- Corresponding author
- Aerts, Hugo J. W. L.
- ORCID
- Venue
- PLOS Medicine
- Publisher
- Public Library of Science (PLoS)
- Published
- 2018-11-30
- Volume
- 15
- Issue
- 11
- Pages
- e1002711
- ISSN
- 1549-1277 (ISSN-L)
- 1549-1676
- PMC
- PMC6269088
- OpenAlex
- W2903150666
- Cited by
- 579
- References
- 95
- Citations by year
- 2026: 30 · 2025: 61 · 2024: 78 · 2023: 93 · 2022: 95 · 2021: 103 · 2020: 84 · 2019: 33 · 2018: 1
- FWCI
- 38.12
- Type
- journal article
- Language
- en
- Open access
- gold
- doi.org
- Licence
- Locations
- PLoS Medicine (publishedVersion, cc-by)
- Europe PMC (PubMed Central) (publishedVersion, cc-by)
- PubMed Central (publishedVersion, cc-by)
- PubMed (publishedVersion)
- DOAJ (DOAJ: Directory of Open Access Journals) (submittedVersion, cc-by-sa)
- Figshare (submittedVersion, cc-by)
- Radboud Repository (Radboud University) (submittedVersion)
- Radboud Repository (Radboud University) (submittedVersion, other-oa)
- Funders
- National Institutes of Health (U24CA194354, U01CA190234)
- Topics
- Health Sciences › Medicine › Radiology, Nuclear Medicine and Imaging › Radiomics and Machine Learning in Medical Imaging
- Physical Sciences › Computer Science › Artificial Intelligence › AI in cancer detection
- Health Sciences › Medicine › Pulmonary and Respiratory Medicine › Lung Cancer Diagnosis and Treatment
- Keywords
- non-small cell lung cancer, outcome prediction, radiomics, 3D convolutional neural networks, computed tomography, transfer learning, overall survival, radiotherapy, surgical resection, patient stratification, deep learning interpretability, random forest comparison, prognostic signature
- MeSH terms
- Clinical Decision-Making, Preliminary Data, Deep Learning, Adult, Aged, Aged, 80 and over, Carcinoma, Non-Small-Cell Lung, Diagnosis, Computer-Assisted, Female, Humans, Lung Neoplasms, Male, Middle Aged, Neoplasm Staging, Predictive Value of Tests, Radiographic Image Interpretation, Computer-Assisted, Retrospective Studies, Risk Factors, Tomography, X-Ray Computed, Reproducibility of Results, Risk Assessment
About these checks
Registry, retraction, Cites and statistics results are computed, not judged, with one exception: a printed reference that no index lists is read once by a model before it counts as a citation error. Claims are extracted by a model and kept only when their quote appears verbatim in the text; each cited source is then checked, with a model’s help, for whether it says what the claim relies on. Those verdicts can be wrong — read the claim’s quote and the cited source before relying on one.
Statistics and arithmetic are recomputed, not judged.
Confidence bands are shown only for fields calibrated on our annotated test set. None is calibrated yet, so no band is shown.
What counts as a claim ›How we measure confidence ›How we check this ›
Are you an author, or do you see a problem with this page? Request a review
