

The DOI matches its Crossref record; 27 of the 28 references it cites were found in a registry or an index.
Increased Level of Extracellular ATP at Tumor Sites: In Vivo Imaging with Plasma Membrane Luciferase
Open accessAbstract
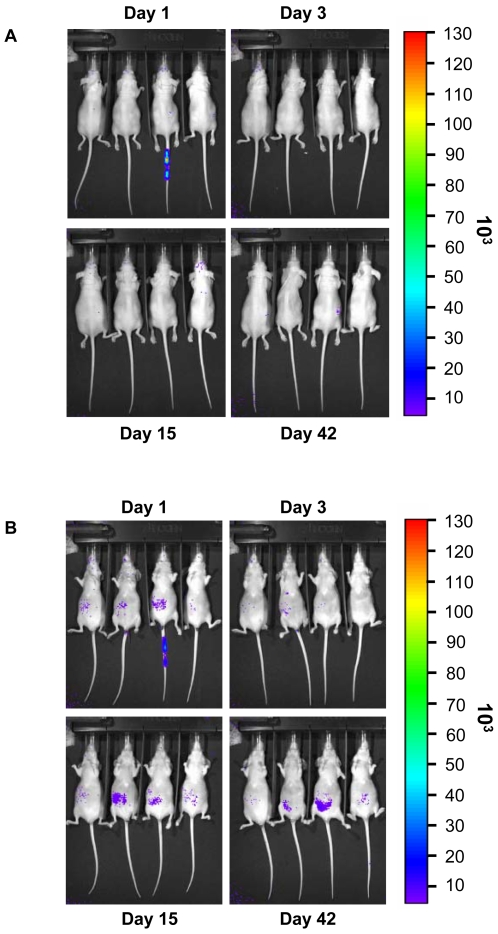
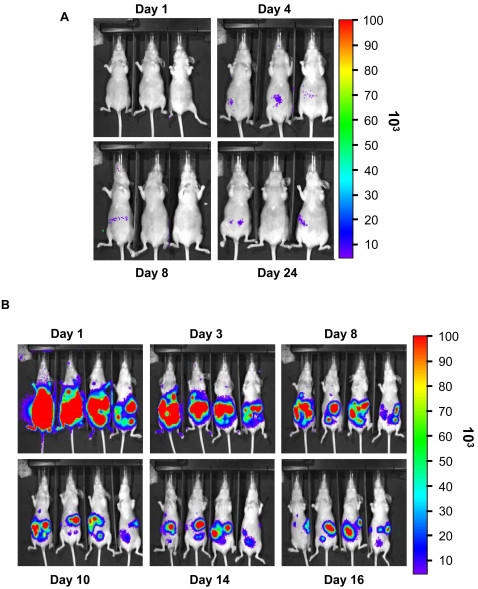
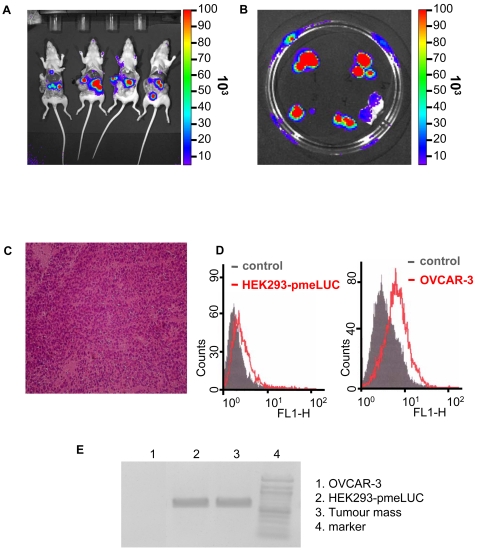
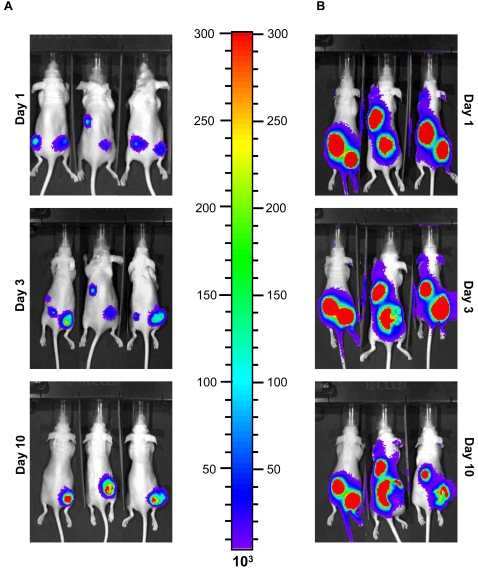
BACKGROUND: There is growing awareness that tumour cells build up a "self-advantageous" microenvironment that reduces effectiveness of anti-tumour immune response. While many different immunosuppressive mechanisms are likely to come into play, recent evidence suggests that extracellular adenosine acting at A2A receptors may have a major role in down-modulating the immune response as cancerous tissues contain elevated levels of adenosine and adenosine break-down products. While there is no doubt that all cells possess plasma membrane adenosine transporters that mediate adenosine uptake and may also allow its release, it is now clear that most of extracellularly-generated adenosine originates from the catabolism of extracellular ATP. METHODOLOGY/PRINCIPAL FINDINGS: Measurement of extracellular ATP is generally performed in cell supernatants by HPLC or soluble luciferin-luciferase assay, thus it generally turns out to be laborious and inaccurate. We have engineered a chimeric plasma membrane-targeted luciferase that allows in vivo real-time imaging of extracellular ATP. With this novel probe we have measured the ATP concentration within the tumour microenvironment of several experimentally-induced tumours. CONCLUSIONS/SIGNIFICANCE: Our results show that ATP in the tumour interstitium is in the hundreds micromolar range, while it is basically undetectable in healthy tissues. Here we show that a chimeric plasma membrane-targeted luciferase allows in vivo detection of high extracellular ATP concentration at tumour sites. On the contrary, tumour-free tissues show undetectable extracellular ATP levels. Extracellular ATP may be crucial for the tumour not only as a stimulus for growth but also as a source of an immunosuppressive agent such as adenosine. Our approach offers a new tool for the investigation of the biochemical composition of tumour milieu and for development of novel therapies based on the modulation of extracellular purine-based signalling.
Overview
The claims and statistics of this paper haven’t been checked yet.
Run the check — free, no account needed. It reads the open-access text and checks the sources it cites.
Integrity signals
Registry
Cites
Statistics
Figures
Verification
Claims the paper makes
The claims and statistics of this paper haven’t been checked yet.
Run the check — free, no account needed. It reads the open-access text and checks the sources it cites.
Claims other papers make about this one
Each is checked against this paper’s own text: does it say what the citing paper says it does?
The source backs part of the claim, not all of it — or backs it for a different population, condition or comparison.
In the citing paper
“Conversely, in a disease state as infection or brain disease, extracellular ATP levels largely increase and activate P2X7 receptors [68–70].”
From Hyperactivation of P2X7 receptors as a culprit of COVID-19 neuropathology (2021) · cites this paper as [68]
Experimental — accuracy not yet measured
Self-check
Percentages, sums and reported differences re-computed from the paper’s own numbers.
The self-check needs the paper’s full text.
Citations
Cites
Deaglio, S., Dwyer, K. M., Gao, W., Friedman, D. J., Usheva, A., Erat, A., Chen, J., Enjyoji, K., Linden, J. M., Oukka, M., et al. (2007) · The Journal of Experimental Medicine · doi:10.1084/jem.20062512 · Cited by 2,613
A Perivascular Niche for Brain Tumor Stem Cells
Calabrese, C. R., Poppleton, H., Koçak, M., Hogg, T. L., Fuller, C. E., Hamner, J. B., Oh, E. Y., Gaber, M. W., Finklestein, D., Allen, M., et al. (2007) · Cancer Cell · doi:10.1016/j.ccr.2006.11.020 · Cited by 2,253
A cytokine-mediated link between innate immunity, inflammation, and cancer
Lin, W.-W., & Karin, M. (2007) · Journal of Clinical Investigation · doi:10.1172/jci31537 · Cited by 1,940
A2A adenosine receptor protects tumors from antitumor T cells
Ohta, A., Gorelik, E., Prasad, S. J., Ronchese, F., Lukashev, D. E., Wong, M. K. K., Huang, X., Caldwell, S. A., Liu, K., Smith, P. T., et al. (2006) · Proceedings of the National Academy of Sciences · doi:10.1073/pnas.0605251103 · Cited by 1,095
The tumour microenvironment as a target for chemoprevention
Albini, A., & Sporn, M. B. (2007) · Nature reviews. Cancer · doi:10.1038/nrc2067 · Cited by 828
Tumors induce a subset of inflammatory monocytes with immunosuppressive activity on CD8+ T cells
Gallina, G., Dolcetti, L., Serafini, P., Santo, C. D., Marigo, I., Colombo, M. P., Basso, G., Brombacher, F., Borrello, I., Zanovello, P., et al. (2006) · Journal of Clinical Investigation · doi:10.1172/jci28828 · Cited by 807
Adenosine, an endogenous distress signal, modulates tissue damage and repair
Fredholm, B. B. (2007) · Cell Death and Differentiation · doi:10.1038/sj.cdd.4402132 · Cited by 704
Sitkovsky, M. V., Lukashev, D. E., Apasov, S. G., Kojima, H., Koshiba, M., Caldwell, C. C., Ohta, A., & Thiel, M. (2004) · Annual Review of Immunology · doi:10.1146/annurev.immunol.22.012703.104731 · Cited by 697
ATP is a mediator of chemosensory transduction in the central nervous system
Gourine, A. V., Llaudet, E., Dale, N., & Spyer, K. M. (2005) · Nature · doi:10.1038/nature03690 · Cited by 537
Context, tissue plasticity, and cancer
Bissell, M. J., & LaBarge, M. A. (2005) · Cancer Cell · doi:10.1016/j.ccr.2004.12.013 · Cited by 517
Cited by
Sorted by citations
Items 501–600 of 670
Alnassar, N., Hajto, J., Rumney, R. M. H., Verma, S., Borczyk, M., Saha, C., Kanczler, J. M., Butt, A. M., Occhipinti, A., Pomeroy, J., et al. (2024) · Human Molecular Genetics · doi:10.1093/hmg/ddae094 · Cited by 7
Liu, Y., Wu, Y., Deng, H., Li, W., Cui, L., Rong, J., & Zhao, J. (2024) · International Journal of Biological Macromolecules · doi:10.1016/j.ijbiomac.2024.134188 · Cited by 7
Can the Tumor Microenvironment Alter Ion Channels? Unraveling Their Role in Cancer
Gentile, R., Feudi, D., Sallicandro, L., & Biagini, A. (2025) · Cancers · doi:10.3390/cancers17071244 · Cited by 7
Sugyo, A., Tsuji, A. B., Sudo, H., Narita, Y., Taniguchi, K., Nemoto, T., Isomura, F., Awaya, N., Kamata‐Sakurai, M., & Higashi, T. (2022) · Translational Oncology · doi:10.1016/j.tranon.2022.101481 · Cited by 7
Purinergic Signaling Within the Tumor Microenvironment
Draganov, D., & Lee, P. P. (2020) · Advances in experimental medicine and biology · doi:10.1007/978-3-030-47189-7_5 · Cited by 7
P2X7: a receptor with a split personality that raises new hopes for anti-cancer therapy
Sarti, A. C., Vultaggio-Poma, V., & Virgilio, F. D. (2021) · Purinergic Signalling · doi:10.1007/s11302-021-09783-w · Cited by 7
An ultrasensitive GRAB sensor for detecting extracellular ATP in vitro and in vivoPreprint
Wu, Z., He, K., Chen, Y., Li, H., Pan, S., Li, B., Liu, T., Wang, H., Du, J., Jing, M., et al. (2021) · bioRxiv (Cold Spring Harbor Laboratory) · doi:10.1101/2021.02.24.432680 · Cited by 7
Bergero, G., Mazzocco, Y. L., Rosso, S. D., Liu, R., Gallardo, Z. M. C., Robson, S. C., Rottenberg, M. E., & Aoki, M. P. (2025) · Journal of Clinical Investigation · doi:10.1172/jci186785 · Cited by 6
Jafari-Matanagh, S., Razavi, S. E., Ehghaghi Bonab, M. B., Omidian, H., & Omidi, Y. (2023) · Computers in Biology and Medicine · doi:10.1016/j.compbiomed.2022.106477 · Cited by 6
Anti-Angiogenic Effect of P2X7 Receptor Antagonist Oxidized ATP as a Mechanism of Anti-Tumor Growth
Seki, S. (2012) · Pharmaceutica Analytica Acta · doi:10.4172/2153-2435.1000190 · Cited by 6
Lau, C. C., Aminuddin, A., Chan, K. M., Paterson, I. C., Law, L. M., & Ng, P. Y. (2021) · Life · doi:10.3390/life11111170 · Cited by 6
The Purinergic Landscape of Non-Small Cell Lung Cancer
Hreich, S. J. D., Benzaquen, J., Hofman, P. M., & Vouret‐Craviari, V. (2022) · Cancers · doi:10.3390/cancers14081926 · Cited by 6
Cui, Y., Li, C., Zeng, X., Wei, X., Li, P., Cheng, J., Xu, Q., & Yang, Y. M. (2023) · Cell Communication and Signaling · doi:10.1186/s12964-023-01185-2 · Cited by 6
Extracellular ATP/P2X7 receptor, a regulatory axis of migration in ovarian carcinoma-derived cells
Núñez-Ríos, J. D., Reyna‐Jeldes, M., Martínez, E. M., Campos‐Contreras, A. D. R., Lazcano-Sánchez, I., González‐Gallardo, A., Díaz‐Muñoz, M., Coddou, C., & Vázquez‐Cuevas, F. G. (2024) · PLoS ONE · doi:10.1371/journal.pone.0304062 · Cited by 6
Strong Inhibition of Xenografted Tumor Growth by Low-Level Doses of [32P]ATP
Cheng, Y., Yang, J., Agarwal, R., Green, G. M., Mease, R. C., Pomper, M. G., Meltzer, S. J., & Abraham, J. M. (2011) · Oncotarget · doi:10.18632/oncotarget.289 · Cited by 6
Windows to cell function and dysfunction: Signatures written in the boundary layers
Smith, P. J., Collis, L. P., & Messerli, M. A. (2010) · BioEssays · doi:10.1002/bies.200900173 · Cited by 6
Adenosine-mediated immunosuppression in patients with squamous cell carcinoma of the head and neck
Mandapathil, M. (2016) · HNO · doi:10.1007/s00106-016-0137-7 · Cited by 6
Evers, M., Song, J., Shriwas, P., Greenbaum, H. S., & Chen, X. (2022) · Frontiers in Oncology · doi:10.3389/fonc.2022.912065 · Cited by 6
Purinergic Regulation of Respiratory Diseases
Picher, M., & Boucher, R. C. (2011) · Sub-cellular biochemistry/Subcellular biochemistry · doi:10.1007/978-94-007-1217-1 · Cited by 7
Scherer, E. B. S., Savio, L. E. B., Vuaden, F. C., Ferreira, A. G. K., Bogo, M. R., Bonan, C. D., & Wyse, Â. T. D. S. (2011) · Molecular and Cellular Biochemistry · doi:10.1007/s11010-011-1141-6 · Cited by 6
Evers, M., Song, J., & Chen, X. (2022) · Sub-cellular biochemistry/Subcellular biochemistry · doi:10.1007/978-3-030-94004-1_4 · Cited by 5
Chemoproteomics reveals immunogenic and tumor-associated cell surface substrates of ectokinase CK2α
Delaveris, C. S., Kong, S., Glasgow, J. E., Loudermilk, R. P., Kirkemo, L. L., Zhao, F., Salangsang, F., Phojanakong, P. J., Cámara, J. A., Steri, V., et al. (2024) · Cell chemical biology · doi:10.1016/j.chembiol.2024.07.018 · Cited by 4
Protocol for Evaluating In Vivo the Activation of the P2RX7 Immunomodulator
Hreich, S. J. D., Juhel, T., Hofman, P. M., & Vouret‐Craviari, V. (2023) · Biological Procedures Online · doi:10.1186/s12575-022-00188-6 · Cited by 5
Wang, J., Chang, Y., Yu, Y., Chen, C., Kao, M., Li, T., & Lin, W. (2012) · Cancer Science · doi:10.1111/j.1349-7006.2012.02376.x · Cited by 5
Immunogenic Stress and Death of Cancer Cells in Natural and Therapy-Induced Immunosurveillance
Kepp, O., Pol, J. G., Zitvogel, L., & Kroemer, G. (2017) · Springer eBooks · doi:10.1007/978-3-319-62431-0_12 · Cited by 6
Augmentation of Extracellular ATP Synergizes With Chemotherapy in Triple Negative Breast Cancer
Manouchehri, J. M., Datta, J., Willingham, N., Wesolowski, R., Stover, D. G., Ganju, R. K., Carson, W. E., Ramaswamy, B., & Cherian, M. A. (2022) · Frontiers in Oncology · doi:10.3389/fonc.2022.855032 · Cited by 5
Adenosine Triphosphate in Health and Disease
Mózsik, G. (2019) · IntechOpen eBooks · doi:10.5772/intechopen.73455 · Cited by 5
[32P]ATP inhibits the growth of xenografted tumors in nude mice
Cheng, Y., Senthamizhchelvan, S., Agarwal, R., Green, G. M., Mease, R. C., Sgouros, G., Huso, D. L., Pomper, M. G., Meltzer, S. J., & Abraham, J. M. (2012) · Cell Cycle · doi:10.4161/cc.19955 · Cited by 5
Rodríguez-Martínez, A., Trapero, C., Vidal, A., Piulats, J. M., de Aranda, I. G., Sévigny, J., Fernández-Montolí, M.-E., Ponce, J., Matías‐Guiu, X., & Martı́n-Satué, M. (2021) · Journal of Personalized Medicine · doi:10.3390/jpm11050331 · Cited by 5
The role of red blood cells in wound healing
Akbari, A. (2012) · cIRcle (University of British Columbia) · doi:10.14288/1.0071773 · Cited by 5
P2RX7 Dynamics in CNS Disorders: Molecular Insights and Therapeutic Perspectives
Mithaiwala, A., Thakur, J., & Godad, A. P. (2025) · Molecular Neurobiology · doi:10.1007/s12035-025-05330-5 · Cited by 4
Mull, M. L., Pratt, S. J. P., Thompson, K. N., Annis, D. A., Gad, A. A., Lee, R., Chang, K. T., Stemberger, M. B., Ju, J. A., Gilchrist, D. E., et al. (2025) · International Journal of Molecular Sciences · doi:10.3390/ijms26094286 · Cited by 4
Feng, Y., Lobanovska, M., Vickery, J., Castillo, J. G., Güereca, L., Chang, S. K., DuPage, M. J. P., & Portnoy, D. A. (2025) · Infection and Immunity · doi:10.1128/iai.00343-25 · Cited by 4
Huili, Z., Li, K., & Nguyen, K. V. (2023) · Nucleosides Nucleotides & Nucleic Acids · doi:10.1080/15257770.2023.2238781 · Cited by 4
Zhang, R., Zheng, Y., Xiang, F., & Zhou, J. (2024) · European Journal of Medicinal Chemistry · doi:10.1016/j.ejmech.2024.116756 · Cited by 5
Furuya, K., Takahashi, Y., Kobayashi, T., Ishiguro, H., Samsonov, M., & Sokabe, M. (2025) · Frontiers in Cell and Developmental Biology · doi:10.3389/fcell.2024.1519642 · Cited by 5
Manouchehri, J. M., Datta, J., Marcho, L. M., Stover, D. G., Ganju, R. K., Ramaswamy, B., Carson, W. E., Mittra, A., Zhang, X., Schnell, P., et al. (2025) · Cancer Biology & Therapy · doi:10.1080/15384047.2025.2483989 · Cited by 4
Shishido, K., Kuroishi, T., & Sugawara, S. (2021) · Journal of Oral Biosciences · doi:10.1016/j.job.2021.01.004 · Cited by 4
Hu, K., Ren, X., Qin, L., Guo, Z., Wu, D., Wang, S., & Hu, Y. (2022) · Journal of Applied Electrochemistry · doi:10.1007/s10800-022-01789-5 · Cited by 4
Tissue- and temporal-specific roles of extracellular ATP on T cell metabolism and function
Santiago-Carvalho, I., Banuelos, A., & da Silva, H. B. (2023) · Immunometabolism · doi:10.1097/in9.0000000000000025 · Cited by 4
Martínez, E. M., González‐Gallardo, A., Díaz‐Muñoz, M., & Vázquez‐Cuevas, F. G. (2023) · Pharmaceuticals · doi:10.3390/ph16070944 · Cited by 4
Cardoso, T. C., Rocha, M. A., Monteiro, M. M. L. V., Alves, V. S., Savio, L. E. B., & Silva, C. L. M. (2022) · Life Sciences · doi:10.1016/j.lfs.2022.120793 · Cited by 4
Ectonucleotidases in Cancer and Inflammation
Stagg, J., Thompson, L. F., & Dwyer, K. M. (2012) · BioMed Research International · doi:10.1155/2012/951423 · Cited by 4
In-vivo measurement of the extracellular ATP concentration by bio-luminescence: The pmeLUC probe
Tarantini, M., Vultaggio-Poma, V., Falzoni, S., Adinolfi, E., Giuliani, A. L., & Virgilio, F. D. (2025) · Methods in cell biology · doi:10.1016/bs.mcb.2025.02.014 · Cited by 3
Methodological guidelines for P2X receptor assays and data interpretation
Górecki, D. C., Adinolfi, E., Adriouch, S., Coutinho‐Silva, R., Engel, T., Gölöncsér, F., Haag, F., Illés, P., Jacobson, K. A., Koch‐Nolte, F., et al. (2026) · Cell Death and Disease · doi:10.1038/s41419-026-08730-0 · Cited by 3
Bosch, J. A., Beltran, P. M. J., Cavers, C., LaGraff, J. T., Melanson, R., Singh, A., Chen, W., Hu, Y., Tattikota, S. G., Liu, Y., et al. (2026) · Nature Communications · doi:10.1038/s41467-026-71763-8 · Cited by 3
Adams, S. D., Kouzani, A. Z., Bennet, K. E., & Tye, S. J. (2016) · IEEE Region 10 Conference (TENCON) · doi:10.1109/tencon.2016.7848474 · Cited by 3
Nielsen, C. M., Qian, Y., Adhicary, S., Li, Y., Shriwas, P., Wang, X., Bachmann, L. M., & Chen, X. (2021) · Journal of Visualized Experiments · doi:10.3791/62768 · Cited by 3
Engineering Aptamers with Selectively Enhanced Biostability in the Tumor Microenvironment
Xie, S., Wang, Z., Fu, T., Zheng, L., Wu, H., He, L., Huang, H., Cai, Y., Wang, R., Qian, X., et al. (2022) · Angewandte Chemie · doi:10.1002/ange.202201220 · Cited by 3
The role of P2X7R purinoreceptor in osteosarcoma
Yadav, M., Singh, A. K., Rizvi, N., Ali, S., Salma, S. A. U., Kumar, V., & Hussain, S. R. (2015) · Advances in Modern Oncology Research · doi:10.18282/amor.v1.i2.27 · Cited by 3
Ashmore, A. A., Balasubramanian, B., Phillips, A., Asher, V., Bali, A., Ordóñez‐Morán, P., & Khan, R. N. (2024) · Journal of Cancer Research and Clinical Oncology · doi:10.1007/s00432-024-05988-9 · Cited by 2
Harnessing CD39 inhibition to boost antitumor immunity with extracellular ATP
Jin, K., Fuchs, R., Clor, J. L., Pappalardo, J. L., Parashar, K., Cho, S., Walker, N. P. C., Walters, M. J., Fernández‐Salas, E., & Bowman, C. E. (2025) · The Journal of Immunology · doi:10.1093/jimmun/vkaf187 · Cited by 3
Winzer, R., Hiefner, J., Hackbusch, R., Link, M. A., Thomalla, G., Tolosa, E., & Worthmann, A. (2025) · ACS Pharmacology & Translational Science · doi:10.1021/acsptsci.5c00446 · Cited by 2
Hayashi, H., Tatsumi, K., Katada, H., Matsuda, Y., Tsunenari, T., Honda, M., Nemoto, T., Shimizu, S., Okuda, M., Ikuta, Y., et al. (2026) · Journal for ImmunoTherapy of Cancer · doi:10.1136/jitc-2025-013397 · Cited by 3
Chen, X., Huang, Z., Xi, M., Duan, J., Wang, D., Tang, X., Li, Z., Xie, S., Liang, R., Chen, C., et al. (2026) · Chemical Engineering Journal · doi:10.1016/j.cej.2026.173095 · Cited by 2
Latest advances on the role of P2X Receptors in colorectal inflammation and cancer
Ruo, L., Fortuna, F., Grignolo, M., Pegoraro, A., & Adinolfi, E. (2026) · Purinergic Signalling · doi:10.1007/s11302-026-10146-6 · Cited by 2
Purinergic signaling and cancer neuroscience
Hu, J.-Q., Zhou, X., Qing-ling, R., & Han, Y. (2026) · Neuropharmacology · doi:10.1016/j.neuropharm.2026.111048 · Cited by 2
Hu, Z., Matsuo, H., Du, S., Battioni, C. B., Jassowicz, L., Carretero, R., Sator‐Schmitt, M., Zhao, X., Miao, B., Eris, C., et al. (2026) · Immunity · doi:10.1016/j.immuni.2026.06.006 · Cited by 2
Detection of endogenous substances with enzymatic microelectrode biosensors in the kidney
Palygin, O., & Staruschenko, A. (2013) · American Journal of Physiology-Regulatory, Integrative and Comparative Physiology · doi:10.1152/ajpregu.00135.2013 · Cited by 2
Beckenkamp, L. R., Iser, I. C., Onzi, G. R., da Fontoura, D. M. S., Bertoni, A. P. S., Sévigny, J., Lenz, G., & Wink, M. R. (2019) · Biochemical Journal · doi:10.1042/bcj20190040 · Cited by 2
Okada, T., Taira, H., & Kimura, T. (2022) · Venoms and Toxins · doi:10.2174/2666121702666220429095250 · Cited by 2
Treatment failure shortcomings, possible causes and upcoming phyto-optimism in oral cancer
Mishra, R. (2023) · The Applied Biology & Chemistry Journal · doi:10.52679/tabcj.2023.0002 · Cited by 2
Zhang, H., Song, J., Ward, R. A., Han, Y., Hunt, A., Shriwas, P., Steed, A., Edwards, C., Cao, Y., Co, M., et al. (2024) · Frontiers in Oncology · doi:10.3389/fonc.2024.1276092 · Cited by 2
State of the art indicators for imaging purinergic dynamics in vitro and in vivo
Li, Y., Zhang, L., Li, B., Li, Y., & Wu, Z. (2025) · Purinergic Signalling · doi:10.1007/s11302-025-10095-6 · Cited by 2
Demaria, S. (2013) · Elsevier eBooks · doi:10.1016/b978-0-12-394296-8.00011-7 · Cited by 2
Purinergic Signaling: A New Regulator of Ovarian Function
Díaz‐Muñoz, M., Campos‐Contreras, A. D. R., Juárez‐Mercado, A. P., Velázquez‐Miranda, E., & Vázquez‐Cuevas, F. G. (2019) · IntechOpen eBooks · doi:10.5772/intechopen.80756 · Cited by 2
Assessing the real-time metabolism and bioenergetics of single cells using fluorescence biosensors
Yang, M., & Quayle, J. M. (2020) · Elsevier eBooks · doi:10.1016/b978-0-12-819621-2.00011-5 · Cited by 2
Forging Ahead the Repositioning of Multitargeted Drug Ivermectin
Atmakuri, S., Nene, S., Khatri, D. K., Singh, S. B., Sinha, V. R., & Srivastava, S. (2022) · Current Drug Delivery · doi:10.2174/1567201819666220516163242 · Cited by 2
Transición epitelio – mesenquima y cáncer.
Arvelo, F. A., & Sojo, F. J. (2023) · Investigación Clínica · doi:10.54817/ic.v64n3a10 · Cited by 4
Blockade of CD73 Increases the Cytotoxic Effects of Fludarabine in Chronic Lymphocytic Leukemia
Sadeghi, M. R. T., Bostanabad, M. Y., Abedi, O., Feizi, A. A. H., Akbari, A. A. M., & Jadidi‐Niaragh, F. (2022) · ImmunoAnalysis · doi:10.34172/ia.2022.11 · Cited by 2
Geoffrey Burnstock – An accidental pharmacologist
Virgilio, F. D., Jacobson, K. A., & Williams, M. (2020) · Biochemical Pharmacology · doi:10.1016/j.bcp.2020.114300 · Cited by 3
Law, L. M., Azmi, N., Paterson, I. C., & Ng, P. Y. (2022) · Sains Malaysiana · doi:10.17576/jsm-2022-5101-14 · Cited by 2
Furuya, K., Takahashi, Y., Hirata, H., Kobayashi, T., Samsonov, M., & Sokabe, M. (2021) · bioRxiv (Cold Spring Harbor Laboratory) · doi:10.1101/2021.04.25.441329 · Cited by 2
Abstracts from the 2017 Italian-German Purine Club Meeting
Dettori, I., Coppi, E., Fusco, I., Cencetti, F., Gaviano, L., Bruni, P., Colotta, V., Catarzi, D., Pedata, F., & Pugliese, A. M. (2017) · Purinergic Signalling · doi:10.1007/s11302-017-9581-4 · Cited by 2
In memoriam - Francesco di Virgilio: P2X7 receptors in purinergic pathophysiology
Illés, P., Verkhratsky, A., Tang, Y. C., Rubini, P., & Adinolfi, E. (2025) · Current Opinion in Pharmacology · doi:10.1016/j.coph.2024.102503 · Cited by 2
Purinergic Signaling in Brain Tumors
Bento, C. A., Guimarães, L. M. F., Arnaud-Sampaio, V. F., Rabelo, I. L. A., Juvenal, G. D. A., Ulrich, H., & Lameu, C. (2023) · Springer eBooks · doi:10.1007/978-3-031-26945-5_13 · Cited by 1
Ma, L., Mu, L., Huang, L., She, G., & Shi, W. (2024) · Chinese Journal of Analytical Chemistry · doi:10.1016/j.cjac.2024.100369 · Cited by 1
Xiao, S.-F., Qiu, A.-J., Zhang, Z., Cheng, G.-J.-S., Wang, S.-K., Zhang, Y., & Cao, Q. (2025) · Dyes and Pigments · doi:10.1016/j.dyepig.2025.112720 · Cited by 1
P2 receptors signaling in the esophagus: from inflammation to cancer
Zaparte, A., Cruz, F. F., de Souza, J. B., & Morrone, F. B. (2025) · Purinergic Signalling · doi:10.1007/s11302-025-10089-4 · Cited by 1
Wei, W., Li, C., Li, M.-Q., Tan, X., & Gong, Z. (2025) · Archives of Oral Biology · doi:10.1016/j.archoralbio.2025.106332 · Cited by 1
Berschel, M. R., Nikodémová, M., Oberto, J. R., Marciante, A. B., Michaelson, A. L., & Mitchell, G. S. (2025) · Neurochemistry International · doi:10.1016/j.neuint.2025.106030 · Cited by 1
He, S., Zeng, Y., Du, Y., Liu, Y., He, M., Li, S., Lyu, Y., & Tan, W. (2025) · Analytical Chemistry · doi:10.1021/acs.analchem.5c03184 · Cited by 1
Ion channels in NK cells: Signaling and functions
Pottosin, I. I., Villatoro-Gómez, K., Olivas-Aguirre, M., Schnoor, M., & Dobrovinskaya, O. R. (2025) · Journal of Leukocyte Biology · doi:10.1093/jleuko/qiaf127 · Cited by 1
ATP-modulatory biomaterials: Design strategies and medical applications
Xu, X., Wang, Z., Wu, T., Wang, Z., Lv, L., Wu, L., Wei, E., Pan, X., Zhu, Q., Dong, X., et al. (2026) · Biomaterials · doi:10.1016/j.biomaterials.2026.124073 · Cited by 1
Tarantini, M., Falzoni, S., Carotti, M., Schio, S., Redolfi, N., Scano, M., Pizzo, P., Sandonà, D., & Virgilio, F. D. (2026) · Neuropharmacology · doi:10.1016/j.neuropharm.2026.110949 · Cited by 1
Iosco, C. (2012) · AMS Dottorato Institutional Doctoral Theses Repository (University of Bologna) · doi:10.6092/unibo/amsdottorato/4797 · Cited by 1
P2Y receptors in dendritic cells: from inflammation to tolerance
Communi, D., & Robaye, B. (2012) · Wiley Interdisciplinary Reviews Membrane Transport and Signalling · doi:10.1002/wmts.75 · Cited by 1
Stimuli-responsive drug delivery systems for cancer immunotherapy
Ding, Y., & Hu, Q. (2022) · Elsevier eBooks · doi:10.1016/b978-0-12-824456-2.00014-x · Cited by 1
Triggering cell death in cancers using self-illuminating nanocomposites
Rajh, T., Koritarov, T., Blaiszik, B. J., Rizvi, S. F. Z., Konda, V. J. A., & Bissonnette, M. (2022) · Frontiers in Chemistry · doi:10.3389/fchem.2022.962161 · Cited by 1
Pavione, N. D. R. T., de Moraes, J. V. B., Ribeiro, I. C., de Castro, R. B., da Silva, W., de Souza, A. C. A., da Silva, V. H. F., Vasconcellos, R. D. S., Bressan, G. C., & Fietto, J. L. R. (2023) · Purinergic Signalling · doi:10.1007/s11302-023-09980-9 · Cited by 1
Mousavikia, S. N., Matin, M. M., Tossi, M. T. B., & Azimian, H. (2025) · Biochimica et Biophysica Acta (BBA) - Molecular Cell Research · doi:10.1016/j.bbamcr.2025.119910 · Cited by 1
Wang, X., Peng, X., Cao, Y., Zhu, X., Du, Y., Yu, Q., & Zhao, R. (2025) · Journal of Biochemical and Molecular Toxicology · doi:10.1002/jbt.70184 · Cited by 1
Effects of the Tumor Environment on Ion Channels: Implication for Breast Cancer Progression
Ouadid‐Ahidouch, H., Morjani, H., Schnipper, J., Girault, A., & Ahidouch, A. (2020) · Reviews of physiology, biochemistry and pharmacology · doi:10.1007/112_2020_19 · Cited by 1
The Effect of the Tumor Microenvironment and Tumor-Derived Metabolites on Dendritic Cell Function
Lee, J., Choi, S., Jung, N.-C., & Lim, D. (2020) · Vide Leaf, Hyderabad eBooks · doi:10.37247/pacr.1.2020.26 · Cited by 1
Zhu, Q., Mao, Z., & Chen, G. (2023) · Soft Computing · doi:10.1007/s00500-023-08855-w · Cited by 1
RetractedWang, T., Gnanaprakasam, J. R., Chen, X., Kang, S., Xu, X., Sun, H., Liu, L., Miller, E., Cassel, T., Sun, Q., et al. (2019) · bioRxiv (Cold Spring Harbor Laboratory) · doi:10.1101/766642 · Cited by 1
Evers, M., Song, J., Shriwas, P., Greenbaum, H. S., & Chen, X. (2021) · Research Square · doi:10.21203/rs.3.rs-403352/v1 · Cited by 1
Santiago-Carvalho, I., Francisco, R. D. S., Macedo, B. D. G., Salgado, C. L., Stoll, C. R., Cione, M. P., White, E., Johnston, T., Leff, C. L., Silva, I., et al. (2025) · bioRxiv (Cold Spring Harbor Laboratory) · doi:10.1101/2025.05.03.652022 · Cited by 1
Quality of CTL Therapies: A Changing Landscape
Thyagarajan, K., Chatterjee, S., Kesarwani, P., Nishimura, M. I., & Mehrotra, S. (2015) · Resistance to targeted anti-cancer therapeutics · doi:10.1007/978-3-319-17807-3_14
Novel aspects of the molecular biology of gastrointestinal stromal tumors
Berglund, E. (2014) · Figshare
Metadata
- Authors
- Pellegatti, P., Raffaghello, L., Bianchi, G., Piccardi, F., Pistoia, V., & Di Virgilio, F.
- Affiliations
- University of Ferrara (IT)
- Istituto Giannina Gaslini (IT)
- Venue
- PLoS ONE
- Publisher
- Public Library of Science (PLoS)
- Published
- 2008-07-09
- Volume
- 3
- Issue
- 7
- Pages
- e2599
- ISSN
- 1932-6203 (ISSN-L)
- PMC
- PMC2440522
- OpenAlex
- W2070663123
- Cited by
- 668
- References
- 28
- Citations by year
- 2026: 31 · 2025: 40 · 2024: 29 · 2023: 62 · 2022: 51 · 2021: 58 · 2020: 66 · 2019: 42 · 2018: 37 · 2017: 34 · 2016: 33 · 2015: 25 · 2014: 36 · 2013: 28 · 2012: 40
- FWCI
- 11.40
- Type
- journal article
- Language
- en
- Open access
- gold
- doi.org
- Locations
- PLoS ONE (publishedVersion, cc-by)
- PubMed Central (publishedVersion, cc-by)
- PubMed (publishedVersion)
- DOAJ (DOAJ: Directory of Open Access Journals) (submittedVersion, cc-by-sa)
- Institutional Research Information System University of Ferrara (University of Ferrara) (submittedVersion)
- Funders
- Fondazione Italiana per la Lotta al Neuroblastoma
- Associazione Italiana per la Ricerca sul Cancro (GGP06070)
- Università degli Studi di Ferrara
- Topics
- Life Sciences › Biochemistry, Genetics and Molecular Biology › Physiology › Adenosine and Purinergic Signaling
- Life Sciences › Biochemistry, Genetics and Molecular Biology › Molecular Biology › Biochemical and Molecular Research
- Life Sciences › Biochemistry, Genetics and Molecular Biology › Molecular Biology › bioluminescence and chemiluminescence research
- Keywords
- extracellular ATP, tumor microenvironment, in vivo imaging, adenosine, adenosine A2A receptor, immunosuppression, ATP catabolism, adenosine transporter
- MeSH terms
- Adenosine Triphosphate, Animals, Cell Membrane, Extracellular Space, Humans, Luciferases, Luminescent Measurements, Mice, Nude, Neoplasms, Cell Line, Tumor, Luminescent Agents, Mice
About these checks
Registry, retraction, Cites and statistics results are computed, not judged, with one exception: a printed reference that no index lists is read once by a model before it counts as a citation error. Claims are extracted by a model and kept only when their quote appears verbatim in the text; each cited source is then checked, with a model’s help, for whether it says what the claim relies on. Those verdicts can be wrong — read the claim’s quote and the cited source before relying on one.
Statistics and arithmetic are recomputed, not judged.
Confidence bands are shown only for fields calibrated on our annotated test set. None is calibrated yet, so no band is shown.
What counts as a claim ›How we measure confidence ›How we check this ›
Are you an author, or do you see a problem with this page? Request a review
