

The DOI matches its Crossref record; 96 of the 98 references it cites were found in a registry or an index.
Virus-Host Coevolution: Common Patterns of Nucleotide Motif Usage in Flaviviridae and Their Hosts
Open accessAbstract
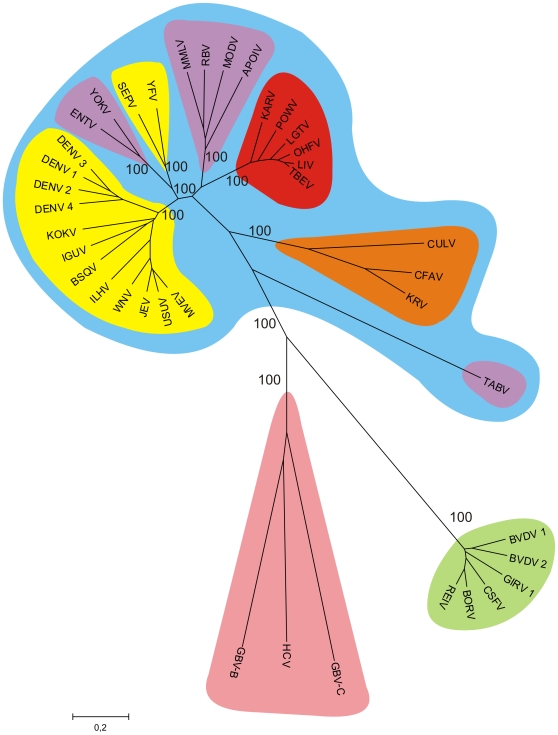
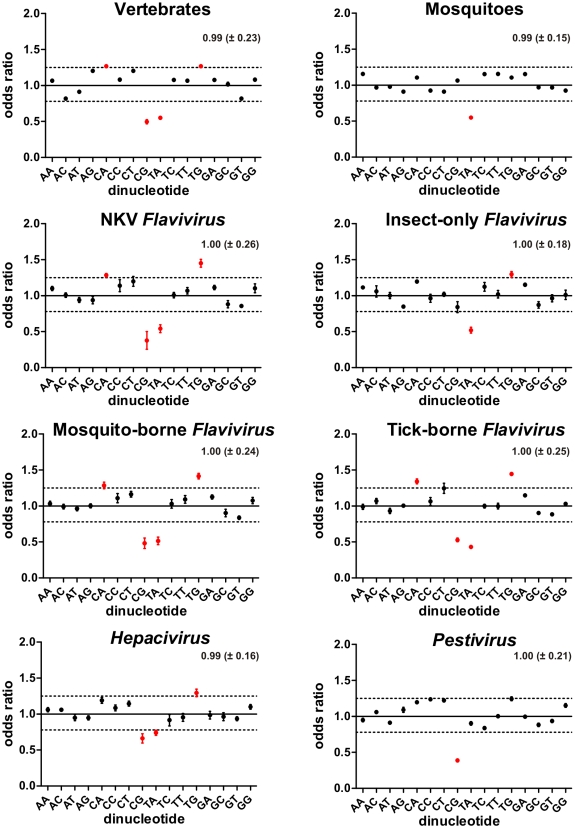
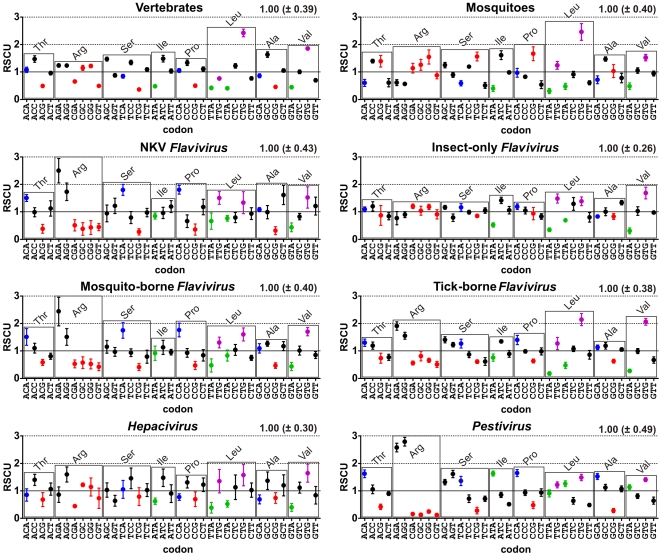
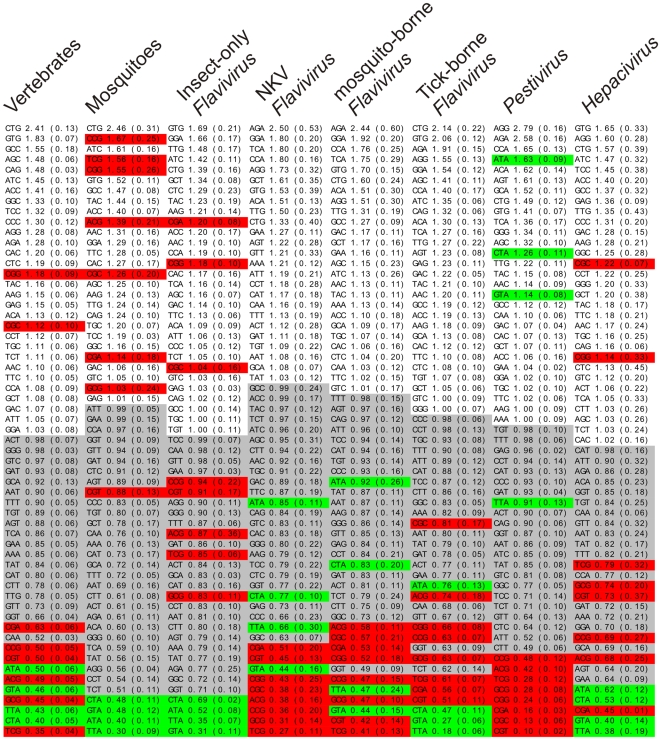
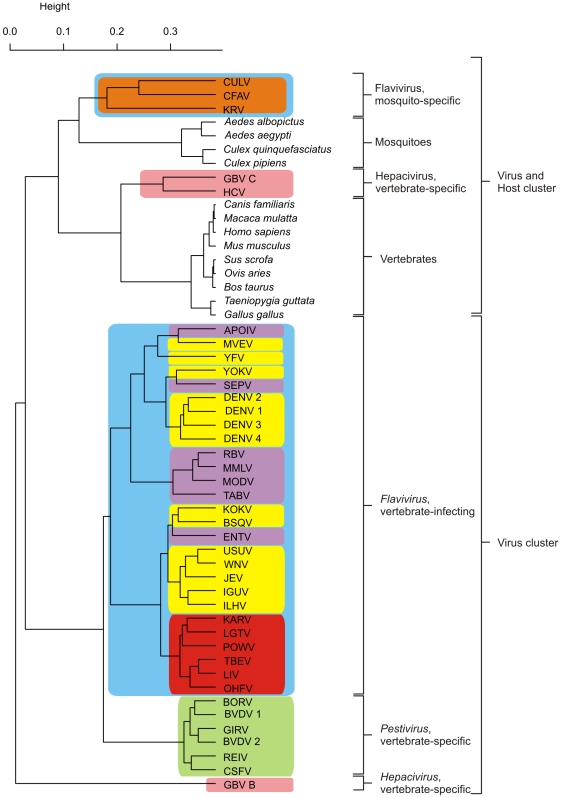
Virus-host biological interaction is a continuous coevolutionary process involving both host immune system and viral escape mechanisms. Flaviviridae family is composed of fast evolving RNA viruses that infects vertebrate (mammals and birds) and/or invertebrate (ticks and mosquitoes) organisms. These host groups are very distinct life forms separated by a long evolutionary time, so lineage-specific anti-viral mechanisms are likely to have evolved. Flaviviridae viruses which infect a single host lineage would be subjected to specific host-induced pressures and, therefore, selected by them. In this work we compare the genomic evolutionary patterns of Flaviviridae viruses and their hosts in an attempt to uncover coevolutionary processes inducing common features in such disparate groups. Especially, we have analyzed dinucleotide and codon usage patterns in the coding regions of vertebrate and invertebrate organisms as well as in Flaviviridae viruses which specifically infect one or both host types. The two host groups posses very distinctive dinucleotide and codon usage patterns. A pronounced CpG under-representation was found in the vertebrate group, possibly induced by the methylation-deamination process, as well as a prominent TpA decrease. The invertebrate group displayed only a TpA frequency reduction bias. Flaviviridae viruses mimicked host nucleotide motif usage in a host-specific manner. Vertebrate-infecting viruses possessed under-representation of CpG and TpA, and insect-only viruses displayed only a TpA under-representation bias. Single-host Flaviviridae members which persistently infect mammals or insect hosts (Hepacivirus and insect-only Flavivirus, respectively) were found to posses a codon usage profile more similar to that of their hosts than to related Flaviviridae. We demonstrated that vertebrates and mosquitoes genomes are under very distinct lineage-specific constraints, and Flaviviridae viruses which specifically infect these lineages appear to be subject to the same evolutionary pressures that shaped their host coding regions, evidencing the lineage-specific coevolutionary processes between the viral and host groups.
Overview
The claims and statistics of this paper haven’t been checked yet.
Run the check — free, no account needed. It reads the open-access text and checks the sources it cites.
Integrity signals
Registry
Cites
Statistics
Figures
Verification
Claims the paper makes
The claims and statistics of this paper haven’t been checked yet.
Run the check — free, no account needed. It reads the open-access text and checks the sources it cites.
Claims other papers make about this one
Each is checked against this paper’s own text: does it say what the citing paper says it does?
The source backs part of the claim, not all of it — or backs it for a different population, condition or comparison.
In the citing paper
“Suppression of CpG dinucleotides in these and many other small viruses occurs at all three possible codon locations, not only at the codon pair boundary.”
From Codon Pair Bias Is a Direct Consequence of Dinucleotide Bias (2016) · cites this paper as Lobo et al., 2009
Experimental — accuracy not yet measuredThe cited source says what the claim attributes to it.
In the citing paper
“suggesting that the two groups of viruses are exposed to different selection pressures and that the pressure is imposed by the respective hosts (Lobo et al., 2009).”
From Codon Pair Bias Is a Direct Consequence of Dinucleotide Bias (2016) · cites this paper as Lobo et al., 2009
Self-check
Percentages, sums and reported differences re-computed from the paper’s own numbers.
The self-check needs the paper’s full text.
Citations
Cites
R: A Language and Environment for Statistical Computing
R Core Team (2000) · doi:10.32614/r.manuals · Cited by 355,893
MEGA4: Molecular Evolutionary Genetics Analysis (MEGA) Software Version 4.0
Tamura, K., Dudley, J. T., Nei, M., & Kumar, S. (2007) · Molecular Biology and Evolution · doi:10.1093/molbev/msm092 · Cited by 28,734
Pruitt, K. D., Tatusova, T. A., & Maglott, D. R. (2006) · Nucleic Acids Research · doi:10.1093/nar/gkl842 · Cited by 4,441
Mutation of the mouse klotho gene leads to a syndrome resembling ageing
Kuro-o, M., Matsumura, Y., Aizawa, H., Kawaguchi, H., Suga, T., Utsugi, T., Ohyama, Y., Kurabayashi, M., Kaname, T., Kume, E., et al. (1997) · Nature · doi:10.1038/36285 · Cited by 3,837
Lauer, G. M., & Walker, B. D. (2001) · New England Journal of Medicine · doi:10.1056/nejm200107053450107 · Cited by 3,033
Bird, A. (2007) · Nature · doi:10.1038/nature05913 · Cited by 3,011
Multiple Sequence Alignment Using ClustalW and ClustalX
Thompson, J., Gibson, T. J., & Higgins, D. G. (2002) · Current Protocols in Bioinformatics · doi:10.1002/0471250953.bi0203s00 · Cited by 2,989
Endoplasmic reticulum stress: cell life and death decisions
Xu, C. (2005) · Journal of Clinical Investigation · doi:10.1172/jci26373 · Cited by 2,291
Molecular Cloning and Disease Association of Hepatitis G Virus: A Transfusion-Transmissible Agent
Linnen, J., Wages, J., Keck, Z., Fry, K. E., Krawczyński, K., Alter, H. J., Koonin, E. V., Gallagher, M. L., Alter, M. J., Hadziyannis, S. J., et al. (1996) · Science · doi:10.1126/science.271.5248.505 · Cited by 1,341
DNA methylation and the frequency of CpG in animal DNA
Bird, A. P. (1980) · Nucleic Acids Research · doi:10.1093/nar/8.7.1499 · Cited by 1,175
Research works printed but not linked: 2
- [16]Belshaw R de Oliveira T Markowitz S Rambaut A 2009 The RNA virus database. Nucleic Acids Res 37 D431 435 18948277 PMC2686580
- [86]Benson DA Karsch-Mizrachi I Lipman DJ Ostell J Sayers EW 2008 GenBank. Nucleic Acids Res PMC2686462 18940867
Cited by
Sorted by citations
Bente, D. A., Forrester, N. L., Watts, D. M., McAuley, A. J., Whitehouse, C. A., & Bray, M. (2013) · Antiviral Research · doi:10.1016/j.antiviral.2013.07.006 · Cited by 1,150
Randhawa, G. S., Soltysiak, M. P. M., El Roz, H., de Souza, C. P. E., Hill, K. A., & Kari, L. (2020) · PLOS ONE · doi:10.1371/journal.pone.0232391 · Cited by 1,023
Blitvich, B., & Firth, A. (2015) · Viruses · doi:10.3390/v7041927 · Cited by 323
Genome-Wide Analysis of Codon Usage and Influencing Factors in Chikungunya Viruses
Butt, A. M., Nasrullah, I., & Tong, Y. (2014) · PLoS ONE · doi:10.1371/journal.pone.0090905 · Cited by 208
Atkinson, N. J., Witteveldt, J., Evans, D. J., & Simmonds, P. (2014) · Nucleic Acids Research · doi:10.1093/nar/gku075 · Cited by 192
Metadata
- Authors
- Lobo, F. P., Mota, B. E. F., Pena, S. D. J., Azevedo, V., Macedo, A. M., Tauch, A., Machado, C. R., & Franco, G. R.
- Affiliations
- Universidade Federal de Minas Gerais (BR)
- Bielefeld University (DE)
- Corresponding author
- Lobo, Francisco P.
- ORCID
- Venue
- PLoS ONE
- Publisher
- Public Library of Science (PLoS)
- Published
- 2009-07-20
- Volume
- 4
- Issue
- 7
- Pages
- e6282
- ISSN
- 1932-6203 (ISSN-L)
- PMC
- PMC2707012
- OpenAlex
- W1978006472
- Cited by
- 191
- References
- 98
- Citations by year
- 2026: 7 · 2025: 8 · 2024: 18 · 2023: 12 · 2022: 5 · 2021: 17 · 2020: 12 · 2019: 9 · 2018: 10 · 2017: 19 · 2016: 10 · 2015: 14 · 2014: 16 · 2013: 19 · 2012: 6
- FWCI
- 2.02
- Type
- journal article
- Language
- en
- Open access
- gold
- doi.org
- Locations
- PLoS ONE (publishedVersion, cc-by)
- Europe PMC (PubMed Central) (publishedVersion, cc-by)
- PubMed Central (publishedVersion, cc-by)
- PubMed (publishedVersion)
- DOAJ (DOAJ: Directory of Open Access Journals) (submittedVersion, cc-by-sa)
- Figshare (submittedVersion, cc-by)
- PUB – Publications at Bielefeld University (Bielefeld University) (submittedVersion)
- Publikationen an der Universität Bielefeld (Universität Bielefeld) (submittedVersion)
- Funders
- Coordenação de Aperfeiçoamento de Pessoal de Nível Superior
- Topics
- Life Sciences › Biochemistry, Genetics and Molecular Biology › Molecular Biology › RNA and protein synthesis mechanisms
- Health Sciences › Medicine › Public Health, Environmental and Occupational Health › Mosquito-borne diseases and control
- Life Sciences › Biochemistry, Genetics and Molecular Biology › Genetics › Evolution and Genetic Dynamics
- Keywords
- host-virus coevolution, Flaviviridae, codon usage bias, host-virus interaction, Hepacivirus, flavivirus, mosquito hosts, vertebrate hosts, DNA methylation
- MeSH terms
- Animals, Base Sequence, Codon, Disease Vectors, Biological Evolution, Phylogeny, Flaviviridae, Host-Pathogen Interactions
About these checks
Registry, retraction, Cites and statistics results are computed, not judged, with one exception: a printed reference that no index lists is read once by a model before it counts as a citation error. Claims are extracted by a model and kept only when their quote appears verbatim in the text; each cited source is then checked, with a model’s help, for whether it says what the claim relies on. Those verdicts can be wrong — read the claim’s quote and the cited source before relying on one.
Statistics and arithmetic are recomputed, not judged.
Confidence bands are shown only for fields calibrated on our annotated test set. None is calibrated yet, so no band is shown.
What counts as a claim ›How we measure confidence ›How we check this ›
Are you an author, or do you see a problem with this page? Request a review
