

The DOI matches its Crossref record; 106 of the 106 references it cites were found in a registry or an index.
Increasing tPA Activity in Astrocytes Induced by Multipotent Mesenchymal Stromal Cells Facilitate Neurite Outgrowth after Stroke in the Mouse
Open accessAbstract
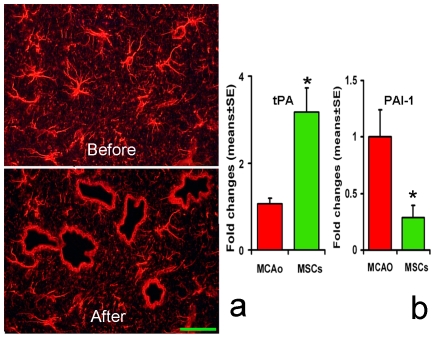
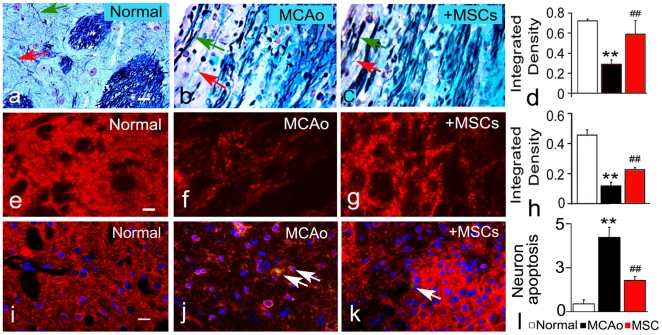
We demonstrate that tissue plasminogen activator (tPA) and its inhibitors contribute to neurite outgrowth in the central nervous system (CNS) after treatment of stroke with multipotent mesenchymal stromal cells (MSCs). In vivo, administration of MSCs to mice subjected to middle cerebral artery occlusion (MCAo) significantly increased activation of tPA and downregulated PAI-1 levels in the ischemic boundary zone (IBZ) compared with control PBS treated mice, concurrently with increases of myelinated axons and synaptophysin. In vitro, MSCs significantly increased tPA levels and concomitantly reduced plasminogen activator inhibitor 1 (PAI-1) expression in astrocytes under normal and oxygen and glucose deprivation (OGD) conditions. ELISA analysis of conditioned medium revealed that MSCs stimulated astrocytes to secrete tPA. When primary cortical neurons were cultured in the conditioned medium from MSC co-cultured astrocytes, these neurons exhibited a significant increase in neurite outgrowth compared to conditioned medium from astrocytes alone. Blockage of tPA with a neutralizing antibody or knock-down of tPA with siRNA significantly attenuated the effect of the conditioned medium on neurite outgrowth. Addition of recombinant human tPA into cortical neuronal cultures also substantially enhanced neurite outgrowth. Collectively, these in vivo and in vitro data suggest that the MSC mediated increased activation of tPA in astrocytes promotes neurite outgrowth after stroke.
Overview
The claims and statistics of this paper haven’t been checked yet.
Run the check — free, no account needed. It reads the open-access text and checks the sources it cites.
Integrity signals
Registry
Cites
Statistics
Figures
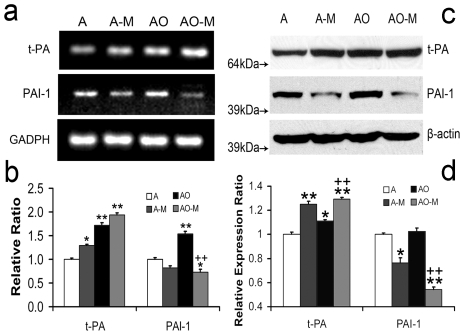
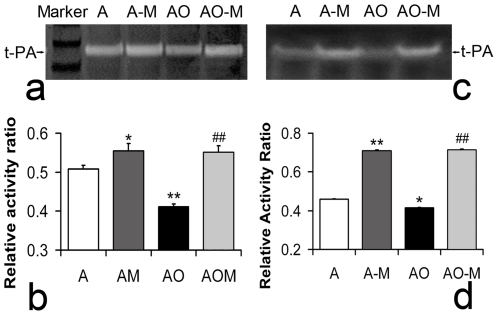
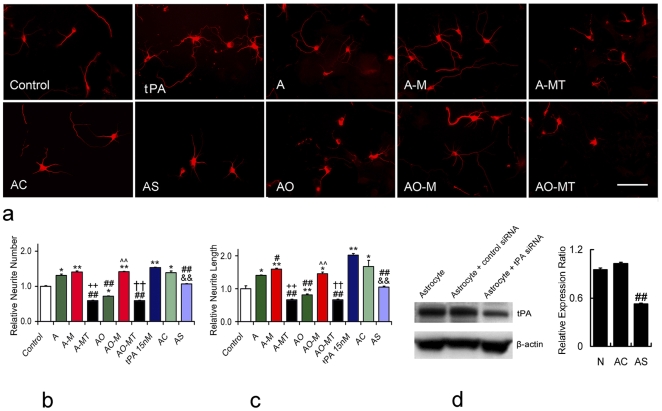
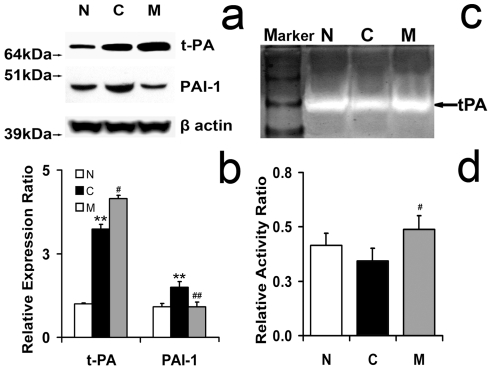
Verification
Claims the paper makes
The claims and statistics of this paper haven’t been checked yet.
Run the check — free, no account needed. It reads the open-access text and checks the sources it cites.
Claims other papers make about this one
Each is checked against this paper’s own text: does it say what the citing paper says it does?
In the citing paper
“Delivery of bone-marrow-derived stromal cells or mesenchymal stromal cells was shown to further increase levels of GDNF66 and tPA68,69 and reduce levels of the tPA inhibitor plasminogen activator inhibitor 1.70”
From Promoting brain remodelling and plasticity for stroke recovery: therapeutic promise and potential pitfalls of clinical translation (2012) · cites this paper as [68]
In the citing paper
“Subsequent to focal cerebral ischaemia, and in parallel to the downregulation of growth-repulsive proteoglycans, astrocytes de novo express neurotrophic factors, such as glial-cell-line-derived neurotrophic factor (GDNF)66 and VEGF,67 and serine proteases, namely tissue plasminogen activator (tPA).68”
From Promoting brain remodelling and plasticity for stroke recovery: therapeutic promise and potential pitfalls of clinical translation (2012) · cites this paper as [68]
Self-check
Percentages, sums and reported differences re-computed from the paper’s own numbers.
The self-check needs the paper’s full text.
Citations
Cites
Dominici, M., Le Blanc, K., Mueller, I., Slaper-Cortenbach, I., Marini, F. C., Krause, D. S., Deans, R. J., Keating, A., Prockop, D. J., & Horwitz, E. M. (2006) · Cytotherapy · doi:10.1080/14653240600855905 · Cited by 17,766
The Mouse Brain in Stereotaxic Coordinates
Paxinos, G. (2001) · Cited by 12,859
Chen, J., Li, Y., Wang, L., Zhang, Z., Lu, D., Lü, M., & Chopp, M. (2001) · Stroke · doi:10.1161/01.str.32.4.1005 · Cited by 1,770
Self-citationAstroglia induce neurogenesis from adult neural stem cells
Song, H., Stevens, C. F., & Gage, F. H. (2002) · Nature · doi:10.1038/417039a · Cited by 1,452
Cleavage of proBDNF by tPA/Plasmin Is Essential for Long-Term Hippocampal Plasticity
Pang, P. T., Teng, H. K., Zaitsev, E., Woo, N. T., Sakata, K., Zhen, S., Teng, K. K., Yung, W.-H., Hempstead, B. L., & Lu, B. (2004) · Science · doi:10.1126/science.1100135 · Cited by 1,136
Human marrow stromal cell therapy for stroke in rat
Li, Y., Chen, J., Chen, X. G., Wang, L., Gautam, S. C., Xu, Y. X., Katakowski, M., Zhang, L. J., Lü, M., Janakiraman, N., et al. (2002) · Neurology · doi:10.1212/wnl.59.4.514 · Cited by 867
Self-citationReactive Astrocytes in Neural Repair and Protection
Sofroniew, M. V. (2005) · The Neuroscientist · doi:10.1177/1073858405278321 · Cited by 759
Treatment of neural injury with marrow stromal cells
Chopp, M., & Li, Y. (2002) · The Lancet Neurology · doi:10.1016/s1474-4422(02)00040-6 · Cited by 624
Self-citationChen, J., Li, Y., Katakowski, M., Chen, X., Wang, L., Lu, D., Lü, M., Gautam, S. C., & Chopp, M. (2003) · Journal of Neuroscience Research · doi:10.1002/jnr.10691 · Cited by 584
Self-citationAstrocyte metabolism and signaling during brain ischemia
Rossi, D. J., Brady, J. D., & Mohr, C. (2007) · Nature Neuroscience · doi:10.1038/nn2004 · Cited by 558
Li, Y., Chopp, M., Chen, J., Wang, L., Gautam, S. C., Xu, Y.-X., & Zhang, Z. (2000) · Journal of Cerebral Blood Flow & Metabolism · doi:10.1097/00004647-200009000-00006 · Cited by 520
Self-citationProtective Role of Reactive Astrocytes in Brain Ischemia
Li, L., Lundkvist, A., Andersson, D., Wilhelmsson, U., Nagai, N., Pardo, A. C., Nodin, C., Ståhlberg, A., Aprico, K., Larsson, K., et al. (2008) · Journal of Cerebral Blood Flow & Metabolism · doi:10.1038/sj.jcbfm.9600546 · Cited by 505
Lipoprotein receptor–mediated induction of matrix metalloproteinase by tissue plasminogen activator
Wang, X., Lee, S.-R., Arai, K., Lee, S., Tsuji, K., Rebeck, G. W., & Lo, E. H. (2003) · Nature Medicine · doi:10.1038/nm926 · Cited by 475
Self-citationSu, E. J., Fredriksson, L., Geyer, M., Folestad, E. B., Cale, J. M., Andræ, J., Gao, Y., Pietras, K., Mann, K. M., Yepes, M., et al. (2008) · Nature Medicine · doi:10.1038/nm1787 · Cited by 469
Kurozumi, K., Nakamura, K., Tamiya, T., Kawano, Y., Ishii, K., Kobune, M., Hirai, S., Uchida, H., Sasaki, K., Ito, Y., et al. (2004) · Molecular Therapy · doi:10.1016/j.ymthe.2004.09.020 · Cited by 398
Ischemic rat brain extracts induce human marrow stromal cell growth factor production
Chen, X., Li, Y., Wang, L., Katakowski, M., Zhang, L., Chen, J., Xu, Y., Gautam, S. C., & Chopp, M. (2002) · Neuropathology · doi:10.1046/j.1440-1789.2002.00450.x · Cited by 382
Self-citationGliosis and brain remodeling after treatment of stroke in rats with marrow stromal cells
Li, Y., Chen, J., Zhang, C. L., Wang, L., Lu, D., Katakowski, M., Gao, Q., Shen, L., Zhang, J., Lü, M., et al. (2004) · Glia · doi:10.1002/glia.20126 · Cited by 381
Self-citationKurozumi, K., Nakamura, K., Tamiya, T., Kawano, Y., Kobune, M., Hirai, S., Uchida, H., Sasaki, K., Ito, Y., Kato, K., et al. (2003) · Molecular Therapy · doi:10.1016/j.ymthe.2003.10.012 · Cited by 340
Human bone marrow stromal cell treatment improves neurological functional recovery in EAE mice
Zhang, J., Li, Y., Chen, J., Cui, Y., Lü, M., Elias, S. B., Mitchell, J. B., Hammill, L., Vanguri, P., & Chopp, M. (2005) · Experimental Neurology · doi:10.1016/j.expneurol.2005.03.018 · Cited by 337
Self-citationNeuhuber, B., Himes, B. T., Shumsky, J. S., Gallo, G., & Fischer, I. (2005) · Brain Research · doi:10.1016/j.brainres.2004.11.055 · Cited by 326
Recovery recapitulates ontogeny
Cramer, S. C., & Chopp, M. (2000) · Trends in Neurosciences · doi:10.1016/s0166-2236(00)01562-9 · Cited by 326
Self-citationChen, X., Katakowski, M., Li, Y., Lu, D., Wang, L., Zhang, L., Chen, J., Xu, Y., Gautam, S. C., Mahmood, A., et al. (2002) · Journal of Neuroscience Research · doi:10.1002/jnr.10334 · Cited by 293
Self-citationNeuroserpin reduces cerebral infarct volume and protects neurons from ischemia-induced apoptosis
Yepes, M., Sandkvist, M., Wong, M. K. K., Coleman, T. A., Smith, E., COHAN, S. L., & Lawrence, D. A. (2000) · Blood · doi:10.1182/blood.v96.2.569 · Cited by 278
The Neurotoxicity of Tissue Plasminogen Activator?
Kaur, J., Zhao, Z., Klein, G., Lo, E. H., & Buchan, A. M. (2004) · Journal of Cerebral Blood Flow & Metabolism · doi:10.1097/01.wcb.0000137868.50767.e8 · Cited by 242
Reigstad, L. J., Varhaug, J. E., & Lillehaug, J. R. (2005) · FEBS Journal · doi:10.1111/j.1742-4658.2005.04989.x · Cited by 238
Cafferty, W. B. J., Yang, S., Duffy, P. J., Li, S., & Strittmatter, S. M. (2007) · Journal of Neuroscience · doi:10.1523/jneurosci.5176-06.2007 · Cited by 224
Marrow stromal cell transplantation in stroke and traumatic brain injury
Li, Y., & Chopp, M. (2009) · Neuroscience Letters · doi:10.1016/j.neulet.2008.03.096 · Cited by 222
Self-citationGlial influences on neural stem cell development: cellular niches for adult neurogenesis.
Ma, D.-K. K., Ming, G., & Song, H.-J. (2005) · Current Opinion in Neurobiology · doi:10.1016/j.conb.2005.08.003 · Cited by 221
One-year follow-up after bone marrow stromal cell treatment in middle-aged female rats with stroke
Shen, L. H., Li, Y., Chen, J., Cui, Y., Zhang, C., Kapke, A., Lu, M., Savant-Bhonsale, S., & Chopp, M. (2007) · Stroke · doi:10.1161/strokeaha.106.481218 · Cited by 208
Self-citationWu, Y. P., Siao, C.-J., Lu, W., Sung, T.-C., Frohman, M. A., Milev, P., Bugge, T. H., Degen, J. L., Levine, J. M., Margolis, R. U., et al. (2000) · The Journal of Cell Biology · doi:10.1083/jcb.148.6.1295 · Cited by 198
Samson, A. L., & Medcalf, R. L. (2006) · Neuron · doi:10.1016/j.neuron.2006.04.013 · Cited by 196
Tissue plasminogen activator is a potent activator of PDGF‐CC
Fredriksson, L., Li, H., Fieber, C., Li, X., & Eriksson, U. (2004) · The EMBO Journal · doi:10.1038/sj.emboj.7600397 · Cited by 193
Astrocyte-Associated Fibronectin Is Critical for Axonal Regeneration in Adult White Matter
Tom, V. J., Doller, C. M., Malouf, A. T., & Silver, J. (2004) · Journal of Neuroscience · doi:10.1523/jneurosci.2120-04.2004 · Cited by 189
Lee, J.-B., Kuroda, S., Shichinohe, H., Ikeda, J., Seki, T., Hida, K., Tada, M., Sawada, K., & Iwasaki, Y. (2003) · Neuropathology · doi:10.1046/j.1440-1789.2003.00496.x · Cited by 188
Zhang, J., Li, Y., Chen, J., Yang, M., Katakowski, M., Lü, M., & Chopp, M. (2004) · Brain Research · doi:10.1016/j.brainres.2004.09.061 · Cited by 165
Self-citationOxidative Stress, Plasminogen Activator Inhibitor 1, and Lung Fibrosis
Liu, R.-M. (2007) · Antioxidants and Redox Signaling · doi:10.1089/ars.2007.1903 · Cited by 153
Buisson, A., Nicole, O., Docagne, F., Sartelet, H., MacKenzie, E. T., & Vivien, D. (1998) · The FASEB Journal · doi:10.1096/fasebj.12.15.1683 · Cited by 136
Lawrence, D. A., Strandberg, L., Ericson, J., & Ny, T. (1990) · Journal of Biological Chemistry · doi:10.1016/s0021-9258(17)30503-3 · Cited by 126
Tissue‐type plasminogen activator requires a co‐receptor to enhance NMDA receptor function
Samson, A. L., Nevin, S. T., Croucher, D. R., Niego, B., Daniel, P. B., Weiss, T. W., Moreno, E., Monard, D., Lawrence, D. A., & Medcalf, R. L. (2008) · Journal of Neurochemistry · doi:10.1111/j.1471-4159.2008.05687.x · Cited by 125
Shen, L. H., Li, Y., Gao, Q., Savant‐Bhonsale, S., & Chopp, M. (2008) · Glia · doi:10.1002/glia.20722 · Cited by 122
Self-citationUjike, H., Takaki, M., Kodama, M., & Kuroda, S. (2002) · Annals of the New York Academy of Sciences · doi:10.1111/j.1749-6632.2002.tb04151.x · Cited by 121
Proteolysis of proBDNF Is a Key Regulator in the Formation of Memory
Barnes, P., & Thomas, K. L. (2008) · PLoS ONE · doi:10.1371/journal.pone.0003248 · Cited by 121
ProNGF: a neurotrophic or an apoptotic molecule?
Fahnestock, M. L., Yu, G., & Coughlin, M. D. (2004) · Progress in brain research · doi:10.1016/s0079-6123(03)46007-x · Cited by 119
Chopp, M., Li, Y., & Zhang, Z. G. (2008) · Stroke · doi:10.1161/strokeaha.108.533141 · Cited by 117
Self-citationPlasticity and remodeling of brain
Chopp, M., Li, Y., & Zhang, J. (2007) · Journal of the Neurological Sciences · doi:10.1016/j.jns.2007.06.013 · Cited by 115
Self-citationBarker, P. A. (2009) · Nature Neuroscience · doi:10.1038/nn0209-105 · Cited by 110
Shichinohe, H., Kuroda, S., Yano, S., Hida, K., & Iwasaki, Y. (2007) · Brain Research · doi:10.1016/j.brainres.2007.08.091 · Cited by 109
The Role of Neurotrophins During Early Development
Bernd, P. (2008) · Gene Expression · doi:10.3727/105221608786883799 · Cited by 107
Ikeda, N., Nonoguchi, N., Zhao, M., Watanabe, T., Kajimoto, Y., Furutama, D., Kimura, F., Dezawa, M., Coffin, R. S., Otsuki, Y., et al. (2005) · Stroke · doi:10.1161/01.str.0000190006.88896.d3 · Cited by 106
Mesenchymal Stem Cells as Mediators of Neural Differentiation
Przyborski, S. A., Hardy, S. A., & Maltman, D. J. (2008) · Current Stem Cell Research & Therapy · doi:10.2174/157488808783489471 · Cited by 104
Andrews, E. M., Tsai, S.-Y., Johnson, S., Farrer, J. R., Wagner, J. P., Kopen, G. C., & Kartje, G. L. (2008) · Experimental Neurology · doi:10.1016/j.expneurol.2008.02.027 · Cited by 101
The plasmin system in airway remodeling
Kucharewicz, I., Kowal, K., Buczko, W., & Bodzenta‐Łukaszyk, A. (2003) · Thrombosis Research · doi:10.1016/j.thromres.2003.10.011 · Cited by 100
Serine Protease Inhibitors: Novel Therapeutic Targets for Stroke?
Vivien, D., & Buisson, A. (2000) · Journal of Cerebral Blood Flow & Metabolism · doi:10.1097/00004647-200005000-00001 · Cited by 99
Transforming Growth Factor-β and Ischemic Brain Injury
Buisson, A., Lesné, S., Docagne, F., Ali, C., Nicole, O., MacKenzie, E. T., & Vivien, D. (2003) · Cellular and Molecular Neurobiology · doi:10.1023/a:1025072013107 · Cited by 99
Key role of tissue plasminogen activator in neurovascular coupling
Park, L., Gallo, E. F., Anrather, J., Wang, G., Norris, E. H., Paul, J., Strickland, S., & Iadecola, C. (2008) · Proceedings of the National Academy of Sciences · doi:10.1073/pnas.0708823105 · Cited by 96
Neuroserpin reduces cerebral infarct volume and protects neurons from ischemia-induced apoptosis
Yepes, M. A., Sandkvist, M., Wong, M. K. K., et al. (2000) · Blood · doi:10.1182/blood.v96.2.569.014k35_569_576 · Cited by 95
Teesalu, T., Hinkkanen, A., & Vaheri, A. I. (2001) · American Journal Of Pathology · doi:10.1016/s0002-9440(10)63073-8 · Cited by 83
Yepes, M., & Lawrence, D. A. (2004) · Thrombosis and Haemostasis · doi:10.1160/th03-12-0766 · Cited by 79
Glial scar and axonal regeneration in the CNS: lessons from GFAP and vimentin transgenic mice
Ribotta, M. G. Y., Menet, V., & Privat, A. (2004) · Springer eBooks · doi:10.1007/978-3-7091-0603-7_12 · Cited by 78
Raf-1-induced cell cycle arrest in LNCaP human prostate cancer cells
Ravi, R. K., McMahon, M., Yangang, Z., Williams, J. R., Dillehay, L. E., Nelkin, B. D., & Mabry, M. H. (1999) · Journal of Cellular Biochemistry · doi:10.1002/(sici)1097-4644(19990315)72:4 · Cited by 75
Yepes, M., & Lawrence, D. A. (2004) · Experimental Biology and Medicine · doi:10.1177/153537020422901103 · Cited by 69
Endogenous plasminogen activator expression after embolic focal cerebral ischemia in mice
Ahn, M., Zhang, Z. G., Tsang, W., & Chopp, M. (1999) · Brain Research · doi:10.1016/s0006-8993(99)01645-5 · Cited by 69
Self-citationPlasminogen Activator Inhibitor-1 Induction after Experimental Intracerebral Hemorrhage
Hua, Y., Xi, G., Keep, R. F., Wu, J., Jiang, Y., & Hoff, J. T. (2002) · Journal of Cerebral Blood Flow & Metabolism · doi:10.1097/00004647-200201000-00007 · Cited by 68
An, J., Zhang, C., Polavarapu, R., Zhang, X., Zhang, X., & Yepes, M. (2008) · Blood · doi:10.1182/blood-2008-02-141630 · Cited by 68
Self-citationTissue plasminogen activator as a modulator of neuronal survival and function
Tsirka, S. E. (2002) · Biochemical Society Transactions · doi:10.1042/bst0300222 · Cited by 67
Lee, S.-R., Guo, S., Scannevin, R. H., Magliaro, B. C., Rhodes, K. J., Wang, X., & Lo, E. H. (2007) · Neuroscience Letters · doi:10.1016/j.neulet.2007.01.017 · Cited by 66
Self-citationTissue-Type Plasminogen Activator and Neuroserpin: A Well-Balanced Act in the Nervous System?
Yepes, M. A., & Lawrence, D. A. (2004) · Trends in Cardiovascular Medicine · doi:10.1016/j.tcm.2004.03.004 · Cited by 64
Fok‐Seang, J., DiProspero, N. A., Meiners, S. A., Muir, E. M., & Fawcett, J. W. (1998) · European Journal of Neuroscience · doi:10.1046/j.1460-9568.1998.00251.x · Cited by 64
Proteoglycans and injury of the central nervous system
Matsui, F., & Oohira, A. (2004) · Congenital Anomalies · doi:10.1111/j.1741-4520.2004.00038.x · Cited by 64
Immunohistochemical localization of plasminogen activator inhibitor-1 in rat and human brain tissues
Hino, H., Akiyama, H., Iseki, E., Kato, M., Kondo, H., Ikeda, K., & Kosaka, K. (2001) · Neuroscience Letters · doi:10.1016/s0304-3940(00)01679-7 · Cited by 55
Neurogenin 1 Mediates Erythropoietin Enhanced Differentiation of Adult Neural Progenitor Cells
Wang, L., Zhang, Z. G., Zhang, R. L., Jiao, Z. X., Wang, Y., D, S. P.-N., LeTourneau, Y., Gregg, S. R., & Chopp, M. (2005) · Journal of Cerebral Blood Flow & Metabolism · doi:10.1038/sj.jcbfm.9600215 · Cited by 53
Self-citationXin, H., Li, Y., Chen, X., & Chopp, M. (2006) · Journal of Neuroscience Research · doi:10.1002/jnr.20834 · Cited by 53
Self-citationTissue plasminogen activator and glial function
Gravanis, I., & Tsirka, S. E. (2004) · Glia · doi:10.1002/glia.20115 · Cited by 52
Gabriel, C., Ali, C., Lesné, S., Fernández‐Monreal, M., Docagne, F., Plawinski, L., MacKenzie, E. T., Buisson, A., & Vivien, D. (2002) · The FASEB Journal · doi:10.1096/fj.02-0403fje · Cited by 49
Zhang, J., Brodie, C., Li, Y., Zheng, X., Roberts, C. J., Lü, M., Gao, Q., Borneman, J. N., Savant‐Bhonsale, S., Elias, S. B., et al. (2009) · Journal of the Neurological Sciences · doi:10.1016/j.jns.2008.12.033 · Cited by 46
Self-citationKahles, T., Foerch, C., Sitzer, M., Schroeter, M., Steinmetz, H., Rami, A., & Neumann‐Haefelin, T. (2005) · Vascular Pharmacology · doi:10.1016/j.vph.2005.07.008 · Cited by 46
(1986) · PubMed · Cited by 45
Nerve growth factors and molecules of the extracellular matrix in neuronal development
Edgar, D. (1985) · Journal of Cell Science · doi:10.1242/jcs.1985.supplement_3.11 · Cited by 44
Zhang, N., Beuve, A. V., & Townes‐Anderson, E. (2005) · Journal of Neuroscience · doi:10.1523/jneurosci.3195-04.2005 · Cited by 43
Plasmin-mediated Release of the Guidance Molecule F-spondin from the Extracellular Matrix
Tzarfaty, V., López‐Alemany, R., Feinstein, Y., Gombau, L., Goldshmidt, O., Soriano, E., Muñoz‐Cánoves, P., & Klar, A. (2001) · Journal of Biological Chemistry · doi:10.1074/jbc.m102585200 · Cited by 39
Aoki, C. J., Bredt, D. S., Fenstemaker, S. B., & Lubin, M. (1998) · Progress in brain research · doi:10.1016/s0079-6123(08)63202-1 · Cited by 37
Halbach, O. V. B. U., & Albrecht, D. (1998) · Journal of Neuroscience Methods · doi:10.1016/s0165-0270(98)00026-0 · Cited by 37
Sensitive autoradiographic quantification of electrophoretically separated proteases
Miskin, R., & Soreq, H. (1981) · Analytical Biochemistry · doi:10.1016/0003-2697(81)90187-1 · Cited by 36
Transplantation of Bone Marrow Stromal Cells for Treatment of Central Nervous System Diseases
Chopp, M., & Li, Y. (2007) · Springer eBooks · doi:10.1007/978-0-387-34133-0_4 · Cited by 34
Self-citationBone marrow stromal cells reduce ischemia-induced astrocytic activation in vitro
Gao, Q., Li, Y., Shen, L., Zhang, J., Zheng, X. M., Qu, R., Liu, Z., & Chopp, M. (2008) · Neuroscience · doi:10.1016/j.neuroscience.2007.10.069 · Cited by 33
Self-citationRetinoic Acid Upregulates the Plasminogen Activator System in Human Epidermal Keratinocytes
Braungart, E., Degitz, K., & Magdolen, V. (2001) · Journal of Investigative Dermatology · doi:10.1046/j.1523-1747.2001.01310.x · Cited by 32
Brain-derived neurotrophic factor (BDNF): role in neuronal development and survival.
Woźniak, W. (1993) · PubMed · Cited by 32
Shichinohe, H., Kuroda, S., Maruichi, K., Osanai, T., Sugiyama, T., Chiba, Y., Yamaguchi, A., & Iwasaki, Y. (2009) · Neuropathology · doi:10.1111/j.1440-1789.2009.01050.x · Cited by 29
Lee, S., Lok, J. M., Rosell, A., Kim, H.-Y., Murata, Y., Atochin, D. N., Huang, P. L., Wang, X., Ayata, C., Moskowitz, M. A., et al. (2007) · Neuroscience · doi:10.1016/j.neuroscience.2007.06.029 · Cited by 29
Self-citationLu, W., & Tsirka, S. E. (2002) · Development · doi:10.1242/dev.129.8.2043 · Cited by 29
COMBINED STAINING OF FAT AND ELASTIC TISSUE.
KWAAN, H. C., & HOPKINS, R. S. (1964) · PubMed · Cited by 29
Extracellular proteases and neuronal cell death.
Siao, C.-J., & Tsirka, S. E. (2002) · PubMed · Cited by 28
Siddiqui, S., Horvat‐Broecker, A., & Faissner, A. (2009) · Glia · doi:10.1002/glia.20860 · Cited by 26
Endogenous Modulators for Drug Dependence
Yamada, K. (2008) · Biological and Pharmaceutical Bulletin · doi:10.1248/bpb.31.1635 · Cited by 25
tPA‐mediated generation of plasmin is catalyzed by the proteoglycan NG2
Nolin, W. B., Emmetsberger, J., Bukhari‐Parlakturk, N., Zhang, Y., Levine, J. M., & Tsirka, S. E. (2007) · Glia · doi:10.1002/glia.20603 · Cited by 20
Characterization of astrocyte plasminogen activator
Toshniwal, P. K., Firestone, S. L., Barlow, G. H., & TIKU, M. L. (1987) · Journal of the Neurological Sciences · doi:10.1016/0022-510x(87)90162-6 · Cited by 18
Cui, X., Chen, J. R., Zacharek, A., Roberts, C., Savant‐Bhonsale, S., & Chopp, M. (2008) · Neuroscience · doi:10.1016/j.neuroscience.2008.07.019 · Cited by 16
Self-citationWANG, Y., Hand, A. R., Gillies, C. G., Grunnet, M. L., Cone, R. E., & O’Rourke, J. (1997) · Experimental Eye Research · doi:10.1006/exer.1997.0314 · Cited by 14
(2006) · CRC Press eBooks · doi:10.3109/9781420021042 · Cited by 11
Developmental profile of tissue plasminogen activator in postnatal Long Evans rat visual cortex.
Zheng, S., Yin, Z. Q., & Zeng, Y. X. (2008) · PubMed Central · Cited by 9
Oikawa, K., Watanabe, T., Miyamoto, I., & Higuchi, S. (2000) · Xenobiotica · doi:10.1080/00498250050200140 · Cited by 7
Peltonen, S., Lassila, R., & Lepäntalo, M. (1996) · Thrombosis Research · doi:10.1016/0049-3848(96)00086-2 · Cited by 7
Brain Repair and Recovery from Stroke
Chopp, M., Li, Y., Chen, J., Zhang, R. L., & Zhang, Z. G. (2008) · European Neurological Review · doi:10.17925/enr.2008.03.01.47 · Cited by 7
Self-citationBrain Repair and Recovery from Stroke
Chopp, M., Li, Y., Chen, J., Zhang, R. L., & Zhang, Z. G. (2008) · touchREVIEWS in Neurology · doi:10.17925/usn.2008.04.01.60 · Cited by 4
Self-citationTissue plasminogen activator as a modulator of neuronal survival and function
Tsirka, S. E. (2001) · Biochemical Society Transactions · doi:10.1042/0300-5127:0300222 · Cited by 4
Functional Recovery After Stroke with Cell-Based Therapy
Chopp, M., & Li, Y. (2006) · CRC Press eBooks · doi:10.3109/9781420021042-45 · Cited by 1
Self-citation
Research works printed but not linked: 1
- [26]Salthouse TN 1964 Luxol Fast Blue G as a Myelin Stain. Stain Technol 39 123 14127797
Cited by
Sorted by citations
Transfer of mitochondria from astrocytes to neurons after stroke
Hayakawa, K., Esposito, E., Wang, X., Terasaki, Y., Liu, Y., Xing, C., Ji, X., & Lo, E. H. (2016) · Nature · doi:10.1038/nature18928 · Cited by 1,423
Self-citationXin, H., Li, Y., Buller, B., Katakowski, M., Zhang, Y., Wang, X., Shang, X., Zhang, Z. G., & Chopp, M. (2012) · Stem Cells · doi:10.1002/stem.1129 · Cited by 907
Self-citationAstrocytes, therapeutic targets for neuroprotection and neurorestoration in ischemic stroke
Liu, Z., & Chopp, M. (2015) · Progress in Neurobiology · doi:10.1016/j.pneurobio.2015.09.008 · Cited by 610
Self-citationChoudhery, M. S., Badowski, M., Muise, A., Pierce, J., & Harris, D. T. (2014) · Journal of Translational Medicine · doi:10.1186/1479-5876-12-8 · Cited by 529
Huang, S., Ge, X., Yu, J., Han, Z., Yin, Z., Li, Y., Chen, F., Wang, H., Zhang, J., & Lei, P. (2018) · The FASEB Journal · doi:10.1096/fj.201700673r · Cited by 388
Self-citation
Metadata
- Authors
- Xin, H., Li, Y., Shen, L. H., Liu, X., Wang, X., Zhang, J., Pourabdollah-Nejad D, S., Zhang, C., Zhang, L., Jiang, H., Zhang, Z. G., & Chopp, M.
- Affiliations
- Henry Ford Health (US)
- Corresponding author
- Chopp, Michael
- ORCID
- Venue
- PLoS ONE
- Publisher
- Public Library of Science (PLoS)
- Published
- 2010-02-03
- Volume
- 5
- Issue
- 2
- Pages
- e9027
- ISSN
- 1932-6203 (ISSN-L)
- PMC
- PMC2815778
- OpenAlex
- W2016357728
- Cited by
- 101
- References
- 104
- Citations by year
- 2026: 1 · 2025: 2 · 2024: 3 · 2023: 6 · 2022: 2 · 2021: 2 · 2020: 3 · 2019: 2 · 2018: 5 · 2017: 4 · 2016: 9 · 2015: 3 · 2014: 16 · 2013: 19 · 2012: 8
- FWCI
- 6.12
- Type
- journal article
- Language
- en
- Open access
- gold
- doi.org
- Locations
- PLoS ONE (publishedVersion, cc-by)
- Europe PMC (PubMed Central) (publishedVersion, cc-by)
- PubMed Central (publishedVersion, cc-by)
- PubMed (publishedVersion)
- DOAJ (DOAJ: Directory of Open Access Journals) (submittedVersion, cc-by-sa)
- Funders
- National Institute of Neurological Disorders and Stroke (NS 042345, R01NS066041, P01NS042345)
- Topics
- Life Sciences › Biochemistry, Genetics and Molecular Biology › Cell Biology › Mesenchymal stem cell research
- Life Sciences › Neuroscience › Neurology › Neuroinflammation and Neurodegeneration Mechanisms
- Health Sciences › Medicine › Clinical Neurology › Acute Ischemic Stroke Management
- Keywords
- tissue plasminogen activator, astrocytes, multipotent mesenchymal stromal cells, neurite outgrowth, stroke, plasminogen activator inhibitor-1, middle cerebral artery occlusion, oxygen-glucose deprivation, cortical neurons, axon regeneration, cell therapy
- MeSH terms
- Animals, Astrocytes, Brain, Cells, Cultured, Glucose, Humans, Mesoderm, Mice, Inbred C57BL, Neurons, Tissue Plasminogen Activator, Blotting, Western, Gene Expression, Neurites, Synaptophysin, Culture Media, Conditioned, Stromal Cells, Apoptosis, Plasminogen Activator Inhibitor 1, Coculture Techniques, Reverse Transcriptase Polymerase Chain Reaction, In Situ Nick-End Labeling, Stroke, RNA Interference, Multipotent Stem Cells, Mice
About these checks
Registry, retraction, Cites and statistics results are computed, not judged, with one exception: a printed reference that no index lists is read once by a model before it counts as a citation error. Claims are extracted by a model and kept only when their quote appears verbatim in the text; each cited source is then checked, with a model’s help, for whether it says what the claim relies on. Those verdicts can be wrong — read the claim’s quote and the cited source before relying on one.
Statistics and arithmetic are recomputed, not judged.
Confidence bands are shown only for fields calibrated on our annotated test set. None is calibrated yet, so no band is shown.
What counts as a claim ›How we measure confidence ›How we check this ›
Are you an author, or do you see a problem with this page? Request a review
