

The DOI matches its Crossref record; 67 of the 68 references it cites were found in a registry or an index.
Inter-Brain Synchronization during Social Interaction
Open accessAbstract
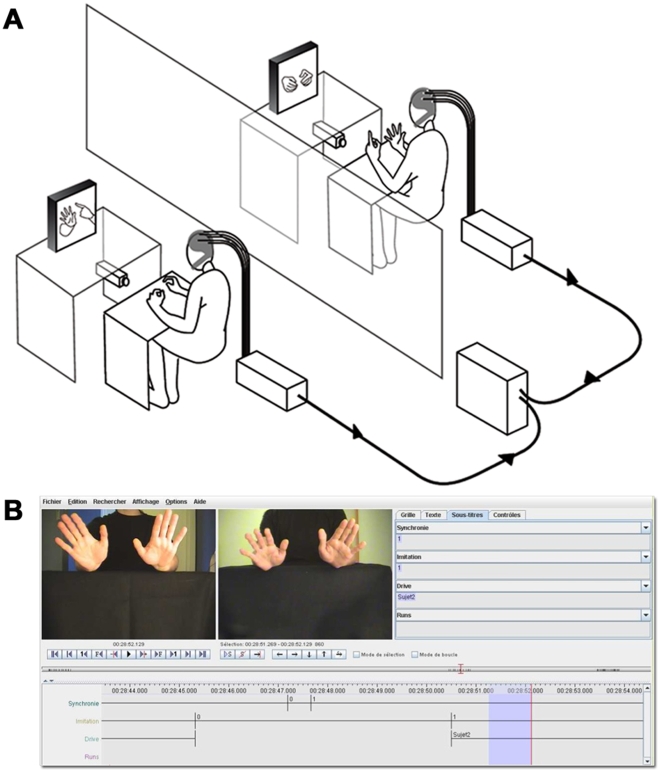
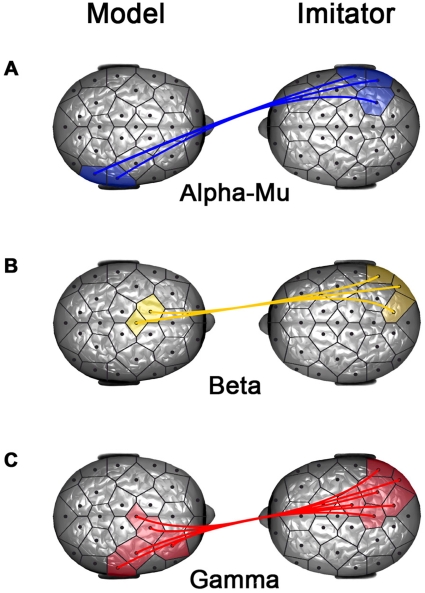
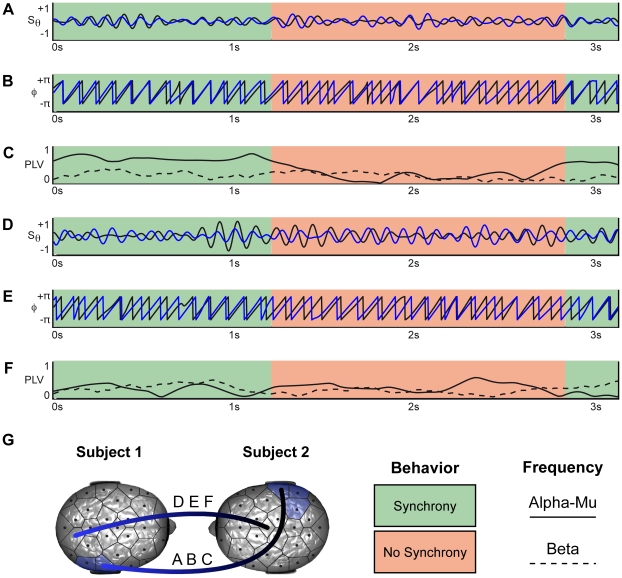
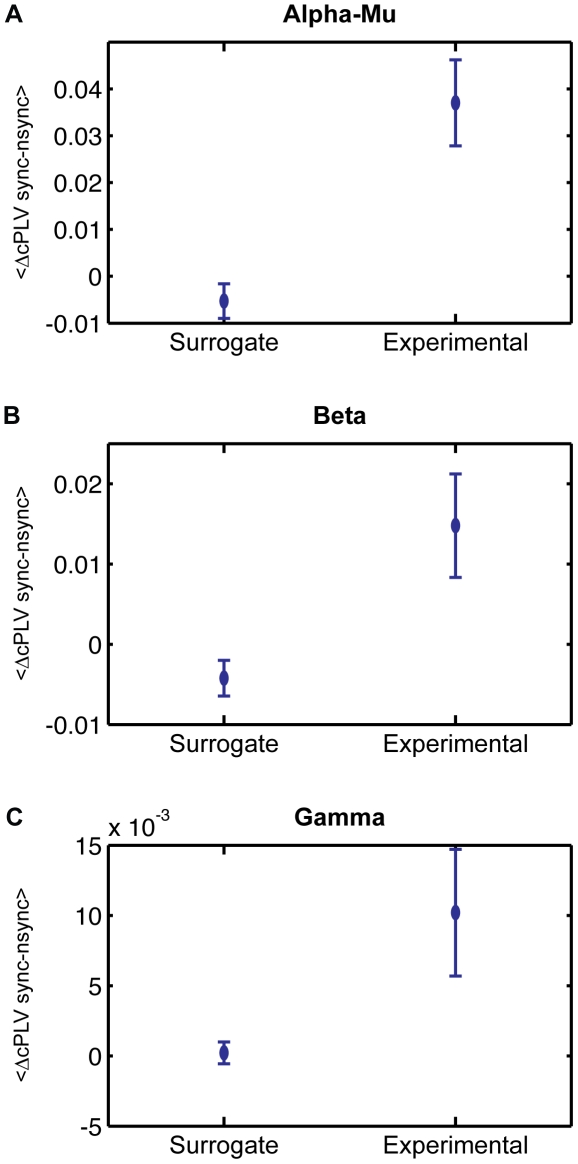
During social interaction, both participants are continuously active, each modifying their own actions in response to the continuously changing actions of the partner. This continuous mutual adaptation results in interactional synchrony to which both members contribute. Freely exchanging the role of imitator and model is a well-framed example of interactional synchrony resulting from a mutual behavioral negotiation. How the participants' brain activity underlies this process is currently a question that hyperscanning recordings allow us to explore. In particular, it remains largely unknown to what extent oscillatory synchronization could emerge between two brains during social interaction. To explore this issue, 18 participants paired as 9 dyads were recorded with dual-video and dual-EEG setups while they were engaged in spontaneous imitation of hand movements. We measured interactional synchrony and the turn-taking between model and imitator. We discovered by the use of nonlinear techniques that states of interactional synchrony correlate with the emergence of an interbrain synchronizing network in the alpha-mu band between the right centroparietal regions. These regions have been suggested to play a pivotal role in social interaction. Here, they acted symmetrically as key functional hubs in the interindividual brainweb. Additionally, neural synchronization became asymmetrical in the higher frequency bands possibly reflecting a top-down modulation of the roles of model and imitator in the ongoing interaction.
Overview
The claims and statistics of this paper haven’t been checked yet.
Free: it reads the open-access text and checks the first 5 claims that cite a source we can check. Create a free account to check every claim.
Integrity signals
Registry
Cites
Statistics
Figures

Verification
Claims the paper makes
The claims and statistics of this paper haven’t been checked yet.
Free: it reads the open-access text and checks the first 5 claims that cite a source we can check. Create a free account to check every claim.
Claims other papers make about this one
Each is checked against this paper’s own text: does it say what the citing paper says it does?
The check wasn’t confident either way, so it gives no verdict — never disputed.
In the citing paper
“The sample size was not determined a priori—each dataset's sample size was guided by prior work in their corresponding fields [38, 39, 40].”
From Interpersonal Synchronization of Autonomic Physiology via Mere Visual Contact (2026) · cites this paper as [38]
Experimental — accuracy not yet measured
Self-check
Percentages, sums and reported differences re-computed from the paper’s own numbers.
The self-check needs the paper’s full text.
Citations
Cites
A Mathematical Theory of Communication
Shannon, C. E. (1948) · Bell System Technical Journal · doi:10.1002/j.1538-7305.1948.tb01338.x · Cited by 88,486
The Mathematical Theory of Communication
Shannon, C. E., Weaver, W., & Wiener, N. (1950) · Physics Today · doi:10.1063/1.3067010 · Cited by 9,801
Nonparametric statistical testing of EEG- and MEG-data
Maris, E., & Oostenveld, R. (2007) · Journal of Neuroscience Methods · doi:10.1016/j.jneumeth.2007.03.024 · Cited by 8,496
The brainweb: phase synchronization and large-scale integration
Varela, F., Lachaux, J.-P., Rodriguez, E., & Martinerie, J. (2001) · Nature Reviews Neuroscience · doi:10.1038/35067550 · Cited by 4,761
Self-citationA mechanism for cognitive dynamics: neuronal communication through neuronal coherence.
Fries, P. (2005) · Trends in Cognitive Sciences · doi:10.1016/j.tics.2005.08.011 · Cited by 4,284 · cited 3×
“have been proposed as a key mechanism for information integration [28], temporal binding [51], flexible neuronal communication [34,52] and unified cognitive processes [45,53].”
InfluentialMeasuring phase synchrony in brain signals
Lachaux, J.-P., Rodriguez, E., Martinerie, J., & Varela, F. J. (1999) · Human Brain Mapping · doi:10.1002/(sici)1097-0193(1999)8:4<194::aid-hbm4>3.0.co;2-c · Cited by 3,798
Self-citationDynamic predictions: Oscillations and synchrony in top–down processing
Engel, A. K., Fries, P., & Singer, W. (2001) · Nature Reviews Neuroscience · doi:10.1038/35094565 · Cited by 3,454
Mathematical Theory of Communication
(2013) · Encyclopedia of Systems Biology · doi:10.1007/978-1-4419-9863-7_100015 · Cited by 3,290
Rizzolatti, G., & Arbib, M. A. (1998) · Trends in Neurosciences · doi:10.1016/s0166-2236(98)01260-0 · Cited by 2,858
Cortical mechanisms of human imitation
Iacoboni, M., Woods, R. P., Brass, M., Bekkering, H., Mazziotta, J. C., & Rizzolatti, G. (1999) · Science · doi:10.1126/science.286.5449.2526 · Cited by 2,683 · cited 1×
“Though imitation is commonly considered as a foundation for learning, socialization and communication [21,22], its use as a paradigm has been limited so far to test the direct matching hypothesis in an intraindividual perspective [23–27].”
Cited by
Toward a second-person neuroscience
Schilbach, L., Timmermans, B., Reddy, V., Costall, A., Bente, G., Schlicht, T., & Vogeley, K. (2013) · Behavioral and Brain Sciences · doi:10.1017/s0140525x12000660 · Cited by 1,510
Sensorimotor synchronization: a review of recent research (2006–2012).
Repp, B. H., & Su, Y.-H. (2013) · Psychonomic Bulletin & Review · doi:10.3758/s13423-012-0371-2 · Cited by 1,204
Brain-to-brain synchrony tracks real-world dynamic group interactions in the classroom
Dikker, S., Wan, L., Davidesco, I., Kaggen, L., Oostrik, M., McClintock, J., Rowland, J., Michalareas, G., Van Bavel, J. J., Ding, M., et al. (2017) · Current Biology · doi:10.1016/j.cub.2017.04.002 · Cited by 871
“…for social cognition in a range of social-psycho-logical contexts, including development [21, 23], and provides a plausible account for prior findings showing an increase in brain-to-brain synchrony during laboratory tasks that required dyads to coordinate visual attention (e.g., [3, 5, 8, 11]).”
The Neurobiology of Human Attachments
Feldman, R. (2017) · Trends in Cognitive Sciences · doi:10.1016/j.tics.2016.11.007 · Cited by 839
Cui, X., Bryant, D. M., & Reiss, A. L. (2012) · NeuroImage · doi:10.1016/j.neuroimage.2011.09.003 · Cited by 807
“EEG-based hyperscanning has enabled the study of social interaction in a more naturalistic environment (Astolfi et al., 2010; Dumas et al., 2010; Lindenberger et al., 2009), for example in poker playing (Babiloni et al.”
Metadata
- Authors
- Dumas, G., Nadel, J., Soussignan, R., Martinerie, J., & Garnero, L.
- Affiliations
- Centre National de la Recherche Scientifique (FR)
- Corresponding author
- Dumas, Guillaume
- Venue
- PLoS ONE
- Publisher
- Public Library of Science (PLoS)
- Published
- 2010-08-17
- Volume
- 5
- Issue
- 8
- Pages
- e12166
- ISSN
- 1932-6203 (ISSN-L)
- PMC
- PMC2923151
- OpenAlex
- W1986163111
- Cited by
- 966
- References
- 68
- Citations by year
- 2026: 73 · 2025: 80 · 2024: 68 · 2023: 55 · 2022: 78 · 2021: 106 · 2020: 127 · 2019: 53 · 2018: 54 · 2017: 57 · 2016: 42 · 2015: 31 · 2014: 54 · 2013: 35 · 2012: 33
- FWCI
- 38.29
- Type
- journal article
- Language
- en
- Open access
- gold
- doi.org
- Locations
- PLoS ONE (publishedVersion, cc-by)
- PubMed Central (publishedVersion, cc-by)
- PubMed (publishedVersion)
- HAL (submittedVersion, other-oa)
- HAL (submittedVersion)
- RePEc: Research Papers in Economics (submittedVersion)
- DOAJ (DOAJ: Directory of Open Access Journals) (submittedVersion, cc-by-sa)
- Topics
- Social Sciences › Psychology › Social Psychology › Action Observation and Synchronization
- Life Sciences › Neuroscience › Cognitive Neuroscience › Neural dynamics and brain function
- Life Sciences › Neuroscience › Cognitive Neuroscience › EEG and Brain-Computer Interfaces
- Keywords
- inter-brain synchrony, social interaction, interactional synchrony, spontaneous imitation, turn-taking, hyperscanning, top-down modulation, mirror neuron system
- MeSH terms
- Behavior, Brain, Electroencephalography, Female, Humans, Imitative Behavior, Interpersonal Relations, Male, Young Adult
About these checks
Registry, retraction, Cites and statistics results are computed, not judged, with one exception: a printed reference that no index lists is read once by a model before it counts as a citation error. Claims are extracted by a model and kept only when their quote appears verbatim in the text; each cited source is then checked, with a model’s help, for whether it says what the claim relies on. Those verdicts can be wrong — read the claim’s quote and the cited source before relying on one.
Statistics and arithmetic are recomputed, not judged.
Confidence bands are shown only for fields calibrated on our annotated test set. None is calibrated yet, so no band is shown.
What counts as a claim ›How we measure confidence ›How we check this ›
Are you an author, or do you see a problem with this page? Request a review
How to cite
Cite CoChat for the checks on this page, and the paper for its own findings.
- This page
- CoChat. (2026). Citation check: Inter-Brain Synchronization during Social Interaction. https://app.cochat.ai/papers/10.1371/journal.pone.0012166
- The paper
- Dumas, G., Nadel, J., Soussignan, R., Martinerie, J., & Garnero, L. (2010). Inter-Brain Synchronization during Social Interaction. PLoS ONE. https://doi.org/10.1371/journal.pone.0012166
Data sources
Bibliographic data: Semantic Scholar, OpenAlex, Crossref.
Contains information from the Semantic Scholar Academic Graph Datasets, made available under the ODC Attribution License (ODC-BY 1.0).
Semantic Scholar’s data is described in: Kinney, R., et al. (2023). The Semantic Scholar Open Data Platform. arXiv:2301.10140.
