

The DOI matches its Crossref record; 41 of the 42 references it cites were found in a registry or an index.
Analysis of the lung microbiome in the “healthy” smoker and in COPD.
Open accessAbstract
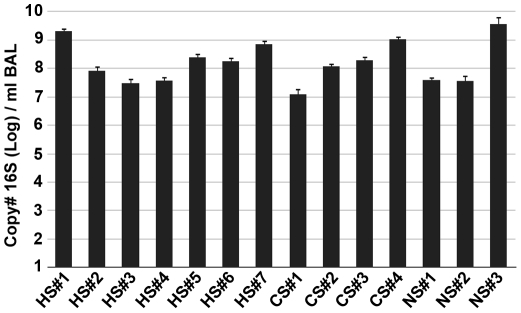
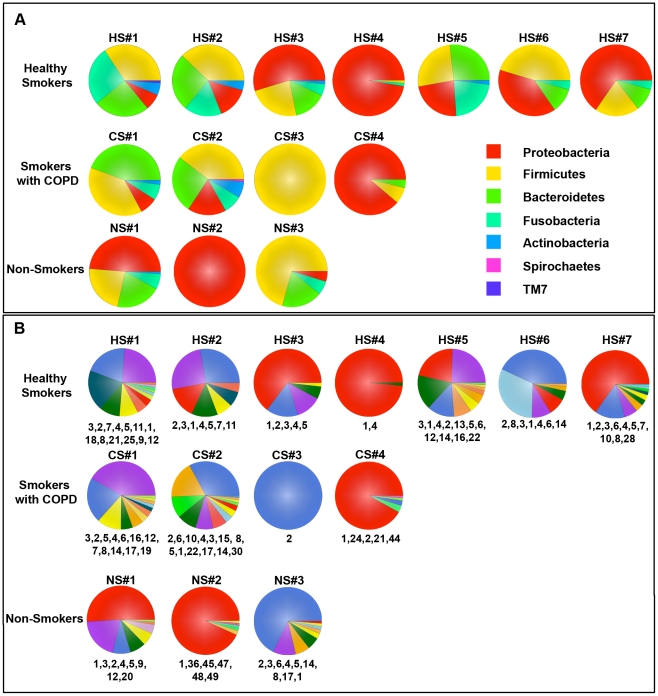
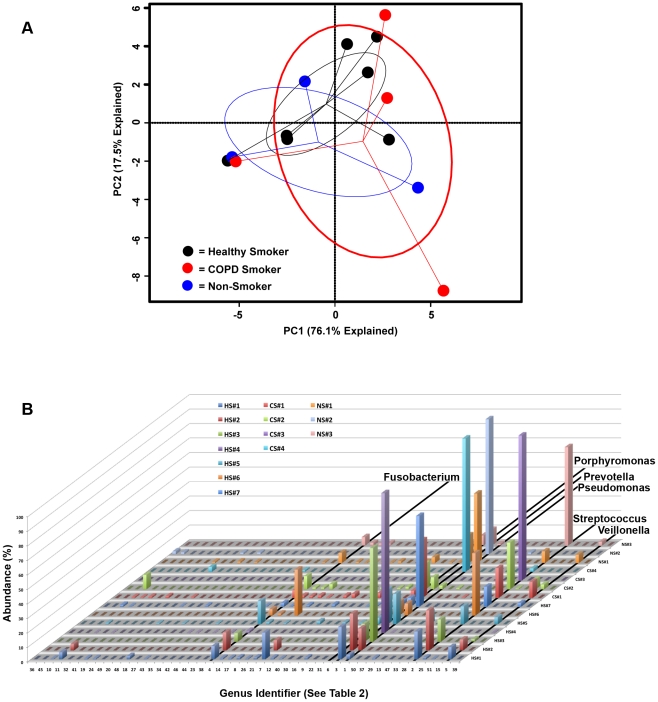
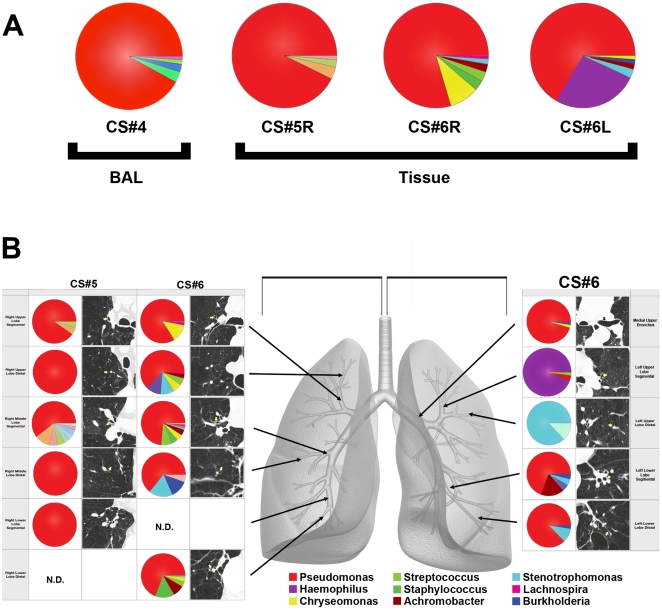
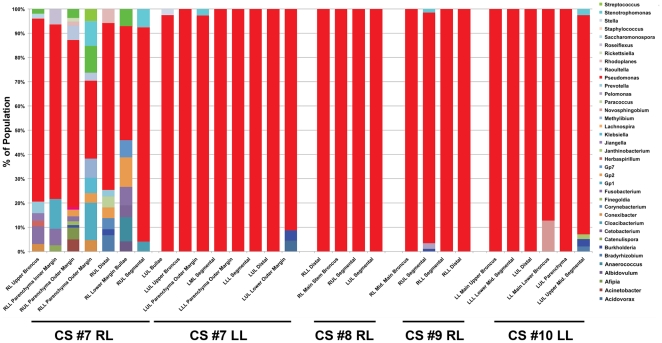
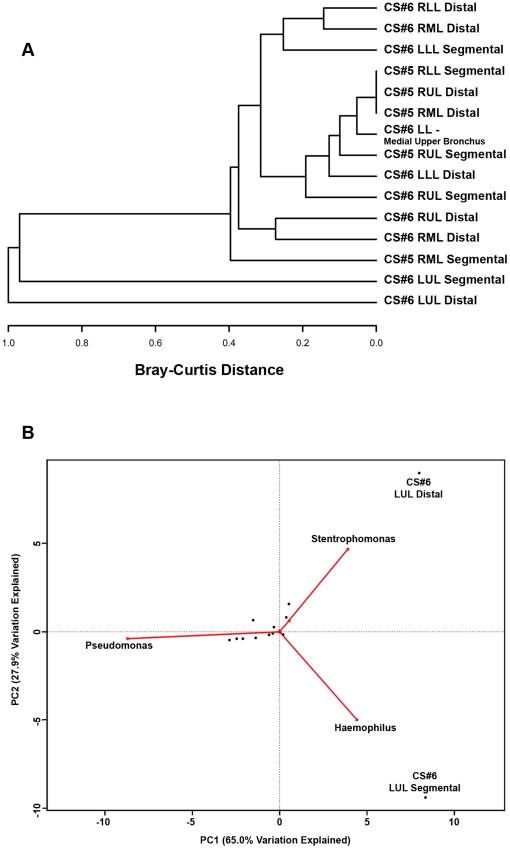
Although culture-independent techniques have shown that the lungs are not sterile, little is known about the lung microbiome in chronic obstructive pulmonary disease (COPD). We used pyrosequencing of 16S amplicons to analyze the lung microbiome in two ways: first, using bronchoalveolar lavage (BAL) to sample the distal bronchi and air-spaces; and second, by examining multiple discrete tissue sites in the lungs of six subjects removed at the time of transplantation. We performed BAL on three never-smokers (NS) with normal spirometry, seven smokers with normal spirometry ("healthy smokers", HS), and four subjects with COPD (CS). Bacterial 16 s sequences were found in all subjects, without significant quantitative differences between groups. Both taxonomy-based and taxonomy-independent approaches disclosed heterogeneity in the bacterial communities between HS subjects that was similar to that seen in healthy NS and two mild COPD patients. The moderate and severe COPD patients had very limited community diversity, which was also noted in 28% of the healthy subjects. Both approaches revealed extensive membership overlap between the bacterial communities of the three study groups. No genera were common within a group but unique across groups. Our data suggests the existence of a core pulmonary bacterial microbiome that includes Pseudomonas, Streptococcus, Prevotella, Fusobacterium, Haemophilus, Veillonella, and Porphyromonas. Most strikingly, there were significant micro-anatomic differences in bacterial communities within the same lung of subjects with advanced COPD. These studies are further demonstration of the pulmonary microbiome and highlight global and micro-anatomic changes in these bacterial communities in severe COPD patients.
Overview
The claims and statistics of this paper haven’t been checked yet.
Run the check — free, no account needed. It reads the open-access text and checks the sources it cites.
Integrity signals
Registry
Cites
Statistics
Figures
Verification
Claims the paper makes
The claims and statistics of this paper haven’t been checked yet.
Run the check — free, no account needed. It reads the open-access text and checks the sources it cites.
Claims other papers make about this one
Each is checked against this paper’s own text: does it say what the citing paper says it does?
In the citing paper
“Under certain conditions, Streptococcus gordonii can attack host fibronectin, and subsequent cytokine production can induce inflammatory responses (Erb-Downward et al., 2011; Liu et al., 2018).”
From Oral Microbiome and SARS-CoV-2: Beware of Lung Co-infection (2020) · cites this paper as Erb-Downward et al., 2011
Self-check
Percentages, sums and reported differences re-computed from the paper’s own numbers.
The self-check needs the paper’s full text.
Citations
Cites
vegan: Community Ecology Package
Oksanen, J., Simpson, G. L., Blanchet, F. G., Kindt, R., Legendre, P., Minchin, P. R., O’Hara, R. B., Sólymos, P., Stevens, M. H. H., Szöcs, E., et al. (2001) · doi:10.32614/cran.package.vegan · Cited by 27,099
Naive Bayesian Classifier for Rapid Assignment of rRNA Sequences into the New Bacterial Taxonomy
Wang, Q., Garrity, G. M., Tiedje, J. M., & Cole, J. R. (2007) · Applied and Environmental Microbiology · doi:10.1128/aem.00062-07 · Cited by 20,145
Schloss, P. D., Westcott, S. L., Ryabin, T., Hall, J. R., Hartmann, M., Hollister, E. B., Lesniewski, R. A., Oakley, B. B., Parks, D. H., Robinson, C. J., et al. (2009) · Applied and Environmental Microbiology · doi:10.1128/aem.01541-09 · Cited by 19,549
Vestbo, J., Hurd, S. S., Agustí, A. G., Jones, P. W., Vogelmeier, C., Anzueto, A., Barnes, P. J., Fabbri, L. M., Martinez, F. J., Nishimura, M., et al. (2013) · American Journal of Respiratory and Critical Care Medicine · doi:10.1164/rccm.201204-0596pp · Cited by 15,983
An Ordination of the Upland Forest Communities of Southern Wisconsin
Bray, J. R., & Curtis, J. T. (1957) · Ecological Monographs · doi:10.2307/1942268 · Cited by 11,736
Obesity alters gut microbial ecology
Ley, R. E., Bäckhed, F., Turnbaugh, P., Lozupone, C. A., Knight, R. D., & Gordon, J. I. (2005) · Proceedings of the National Academy of Sciences · doi:10.1073/pnas.0504978102 · Cited by 6,176
Rabe, K. F., Hurd, S., Anzueto, A., Barnes, P. J., Buist, S. A., Calverley, P., Fukuchi, Y., Jenkins, C., Rodriguez-Roisin, R., van Weel, C., et al. (2007) · American Journal of Respiratory and Critical Care Medicine · doi:10.1164/rccm.200703-456so · Cited by 4,925
Frank, D. N., St. Amand, A. L., Feldman, R. A., Boedeker, E. C., Harpaz, N., & Pace, N. R. (2007) · Proceedings of the National Academy of Sciences · doi:10.1073/pnas.0706625104 · Cited by 4,611
Spirometric Reference Values from a Sample of the General U.S. Population
Hankinson, J., Odencrantz, J. R., & Fedan, K. B. (1999) · American Journal of Respiratory and Critical Care Medicine · doi:10.1164/ajrccm.159.1.9712108 · Cited by 4,220
Topographical and Temporal Diversity of the Human Skin Microbiome
Grice, E. A., Kong, H. H., Conlan, S., Deming, C. B., Davis, J., Young, A. C., Program, N. C. S., Bouffard, G. G., Blakesley, R. W., Murray, P. R., et al. (2009) · Science · doi:10.1126/science.1171700 · Cited by 2,953
Research works printed but not linked: 1
- C Fletcher, 1978, Community Health., J Epidemiol, 32, 282
Cited by
Sorted by citations
Gut Microbiota Metabolism of Dietary Fiber Influences Allergic Airway Disease and Hematopoiesis
Trompette, A., Gollwitzer, E. S., Yadava, K., Sichelstiel, A. K., Sprenger, N., Ngom-Bru, C., Blanchard, C., Junt, T., Nicod, L. P., Harris, N. L., et al. (2014) · Nature Medicine · doi:10.1038/nm.3444 · Cited by 2,862
Topographical Continuity of Bacterial Populations in the Healthy Human Respiratory Tract
Charlson, E. S., Bittinger, K., Haas, A. R., Fitzgerald, A. S., Frank, I., Yadav, A., Bushman, F. D., & Collman, R. G. (2011) · American Journal of Respiratory and Critical Care Medicine · doi:10.1164/rccm.201104-0655oc · Cited by 1,144
“Molecularbased studies of the LRT using bronchoscopic collection of BAL or mucosal brushes have reported that airways of healthy individuals contain a characteristic distribution of organisms, often at very high levels (10, 11).”
BackgroundRespiratory risks from household air pollution in low and middle income countries
Gordon, S. B., Bruce, N. G., Grigg, J., Hibberd, P. L., Kurmi, O. P., Lam, K.-B. H., Mortimer, K., Asante, K. P., Balakrishnan, K., Balmes, J., et al. (2014) · The Lancet Respiratory Medicine · doi:10.1016/s2213-2600(14)70168-7 · Cited by 953
The Microbiome and the Respiratory Tract
Dickson, R. P., Erb-Downward, J. R., Martinez, F. J., & Huffnagle, G. B. (2016) · Annual Review of Physiology · doi:10.1146/annurev-physiol-021115-105238 · Cited by 953
“Whereas in asthma even patients with mild disease have detectably altered airway microbiota (4, 78), the airway microbiota of patients with mild and moderate COPD is indistinguishable from those of healthy volunteers (32, 51, 75, 87, 88).”
BackgroundInfluentialSelf-citationBassis, C. M., Erb-Downward, J. R., Dickson, R. P., Freeman, C. M., Schmidt, T. M., Young, V. B., Beck, J. M., Curtis, J. L., & Huffnagle, G. B. (2015) · mBio · doi:10.1128/mbio.00037-15 · Cited by 839
Self-citation
Metadata
- Authors
- Erb-Downward, J. R., Thompson, D. L., Han, M. K., Freeman, C. M., McCloskey, L., Schmidt, L. A., Young, V. B., Toews, G. B., Curtis, J. L., Sundaram, B., Martinez, F. J., & Huffnagle, G. B.
- Affiliations
- University of Michigan (US)
- Corresponding author
- Huffnagle, Gary B.
- ORCID
- Venue
- PLoS ONE
- Publisher
- Public Library of Science (PLoS)
- Published
- 2011-02-22
- Volume
- 6
- Issue
- 2
- Pages
- e16384
- ISSN
- 1932-6203 (ISSN-L)
- PMC
- PMC3043049
- OpenAlex
- W2163401084
- Cited by
- 973
- References
- 42
- Citations by year
- 2026: 32 · 2025: 50 · 2024: 59 · 2023: 66 · 2022: 73 · 2021: 57 · 2020: 74 · 2019: 62 · 2018: 85 · 2017: 80 · 2016: 75 · 2015: 72 · 2014: 68 · 2013: 57 · 2012: 49
- FWCI
- 50.74
- Type
- journal article
- Language
- en
- Open access
- gold
- doi.org
- Licence
- Locations
- PLoS ONE (publishedVersion, public-domain)
- PubMed Central (publishedVersion, public-domain)
- PubMed (publishedVersion)
- DOAJ (DOAJ: Directory of Open Access Journals) (submittedVersion, cc-by-sa)
- Funders
- U.S. Department of Veterans Affairs (R01 HL082480)
- University of Michigan (UL1 RR024986)
- National Institutes of Health (n01hr46162-13-0-1)
- Michigan Institute for Clinical and Health Research (UL 1RR024986)
- University of Michigan Comprehensive Cancer Center (P30 CA46952, CA46952)
- National Heart, Lung, and Blood Institute (R01HL082480, N01HR046162, T32HL007749)
- National Cancer Institute (P30 CA 46952)
- National Institute of Diabetes and Digestive and Kidney Diseases (DK070875, RR024986, R01DK070875)
- National Center for Research Resources (UL1RR024986)
- Topics
- Health Sciences › Medicine › Pulmonary and Respiratory Medicine › Chronic Obstructive Pulmonary Disease (COPD) Research
- Health Sciences › Dentistry › Periodontics › Oral microbiology and periodontitis research
- Life Sciences › Biochemistry, Genetics and Molecular Biology › Molecular Biology › Gut microbiota and health
- Keywords
- lung microbiome, chronic obstructive pulmonary disease, healthy smokers, bronchoalveolar lavage, lung tissue sampling, bacterial community diversity, core microbiome, Pseudomonas, Streptococcus, Prevotella, Fusobacterium, Haemophilus, Veillonella, Porphyromonas, lung transplantation
- MeSH terms
- Adult, Aged, Bronchoalveolar Lavage Fluid, Bronchoscopy, DNA, Bacterial, Female, Health, Humans, Lung, Male, Middle Aged, RNA, Ribosomal, 16S, Smoking, Sequence Analysis, DNA, Pulmonary Disease, Chronic Obstructive, Metagenome
About these checks
Registry, retraction, Cites and statistics results are computed, not judged, with one exception: a printed reference that no index lists is read once by a model before it counts as a citation error. Claims are extracted by a model and kept only when their quote appears verbatim in the text; each cited source is then checked, with a model’s help, for whether it says what the claim relies on. Those verdicts can be wrong — read the claim’s quote and the cited source before relying on one.
Statistics and arithmetic are recomputed, not judged.
Confidence bands are shown only for fields calibrated on our annotated test set. None is calibrated yet, so no band is shown.
What counts as a claim ›How we measure confidence ›How we check this ›
Are you an author, or do you see a problem with this page? Request a review
