Cited by 117Neurotransmitter Receptor Influence on BehaviorMemory and Neural MechanismsNeural and Behavioral Psychology Studies

The DOI matches its Crossref record; 53 of the 53 references it cites were found in a registry or an index.

Convergent Processing of Both Positive and Negative Motivational Signals by the VTA Dopamine Neuronal Populations

Open access
Wang, Dong V., Tsien, Joe Z.·2011·PLoS ONE

Abstract

Dopamine neurons in the ventral tegmental area (VTA) have been traditionally studied for their roles in reward-related motivation or drug addiction. Here we study how the VTA dopamine neuron population may process fearful and negative experiences as well as reward information in freely behaving mice. Using multi-tetrode recording, we find that up to 89% of the putative dopamine neurons in the VTA exhibit significant activation in response to the conditioned tone that predict food reward, while the same dopamine neuron population also respond to the fearful experiences such as free fall and shake events. The majority of these VTA putative dopamine neurons exhibit suppression and offset-rebound excitation, whereas ∼25% of the recorded putative dopamine neurons show excitation by the fearful events. Importantly, VTA putative dopamine neurons exhibit parametric encoding properties: their firing change durations are proportional to the fearful event durations. In addition, we demonstrate that the contextual information is crucial for these neurons to respectively elicit positive or negative motivational responses by the same conditioned tone. Taken together, our findings suggest that VTA dopamine neurons may employ the convergent encoding strategy for processing both positive and negative experiences, intimately integrating with cues and environmental context.

Overview

The claims and statistics of this paper haven’t been checked yet.

Run the check — free, no account needed. It reads the open-access text and checks the sources it cites.

A few free checks a day · papers already verified open instantly · results are public

Integrity signals

Registry

Crossref · 10.1371/journal.pone.0017047

Cites

53 of 53 references verified0 citation errors · 0 not checkable

Statistics

Figures

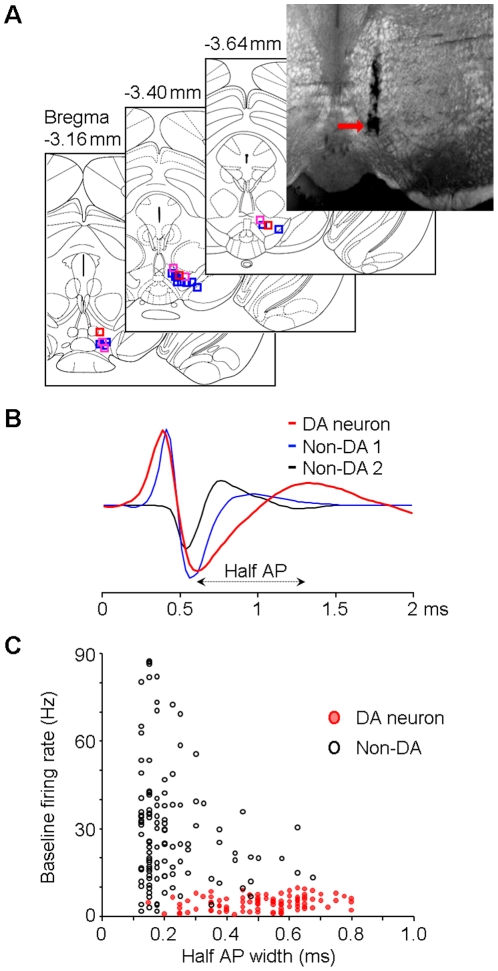
Figure 1 Muti-tetrode recording and VTA neuron classification. (A) Electrode array track shown on an example coronal brain section (top-right) and locations of the electrode array tips (from 21 mice) on atlas section diagrams [52]. Blue squares represent the locations where type-1/2 putative DA neurons were recorded; red squares represent the locations where type-3 neurons were recorded; purple squares represent the locations where both type-1/2 and type-3 neurons were recorded (see Figure 2 for the classification of the three types of putative DA neurons). (B) Examples of typically recorded spike waveforms for putative DA (red) and Non-DA (blue and black) neurons. Half AP width was measured from the trough to the following peak of the action potential. (C) Baseline firing rates and half AP widths of the classified DA (red) and Non-DA (black) neurons. DA, dopamine; Non-DA, non-dopamine; AP, action potential.
Figure 1 Muti-tetrode recording and VTA neuron classification. (A) Electrode array track shown on an example coronal brain section (top-right) and locations of the electrode array tips (from 21 mice) on atlas section diagrams [52]. Blue squares represent the locations where type-1/2 putative DA neurons were recorded; red squares represent the locations where type-3 neurons were recorded; purple squares represent the locations where both type-1/2 and type-3 neurons were recorded (see Figure 2 for the classification of the three types of putative DA neurons). (B) Examples of typically recorded spike waveforms for putative DA (red) and Non-DA (blue and black) neurons. Half AP width was measured from the trough to the following peak of the action potential. (C) Baseline firing rates and half AP widths of the classified DA (red) and Non-DA (black) neurons. DA, dopamine; Non-DA, non-dopamine; AP, action potential.CC BY · PubMed Central
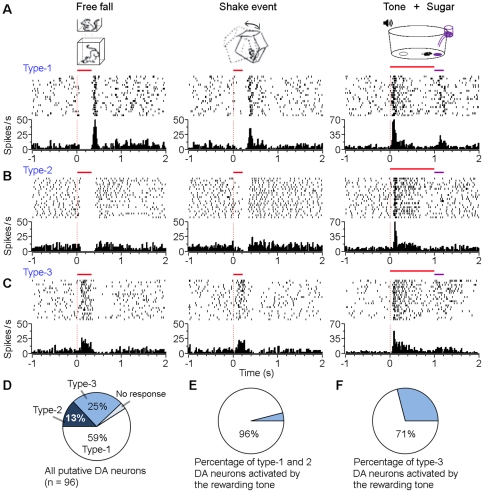
Figure 2 Three types of VTA putative dopamine (DA) neurons. (A-C) Peri-event rasters (1-20 trials, from top to bottom) and histograms of three examples of VTA putative dopamine neurons (A: type-1, B: type-2, and C: type-3) in response to free fall (left panels), shake (middle panels), and the conditioned tone that reliably predicted sugar pellet delivery (right panels). (D) Percentages of different types of putative DA neurons. (E, F) Percentages of fear-suppressed (E: type-1 and 2) and fear-excited (F: type-3) putative DA neurons that were significantly activated by the conditioned tone that reliably predicted sugar pellet delivery. Free fall, 30 cm high; Shake, 0.2 sec; Tone, 5 kHz, 1 sec.
Figure 2 Three types of VTA putative dopamine (DA) neurons. (A-C) Peri-event rasters (1-20 trials, from top to bottom) and histograms of three examples of VTA putative dopamine neurons (A: type-1, B: type-2, and C: type-3) in response to free fall (left panels), shake (middle panels), and the conditioned tone that reliably predicted sugar pellet delivery (right panels). (D) Percentages of different types of putative DA neurons. (E, F) Percentages of fear-suppressed (E: type-1 and 2) and fear-excited (F: type-3) putative DA neurons that were significantly activated by the conditioned tone that reliably predicted sugar pellet delivery. Free fall, 30 cm high; Shake, 0.2 sec; Tone, 5 kHz, 1 sec.CC BY · PubMed Central
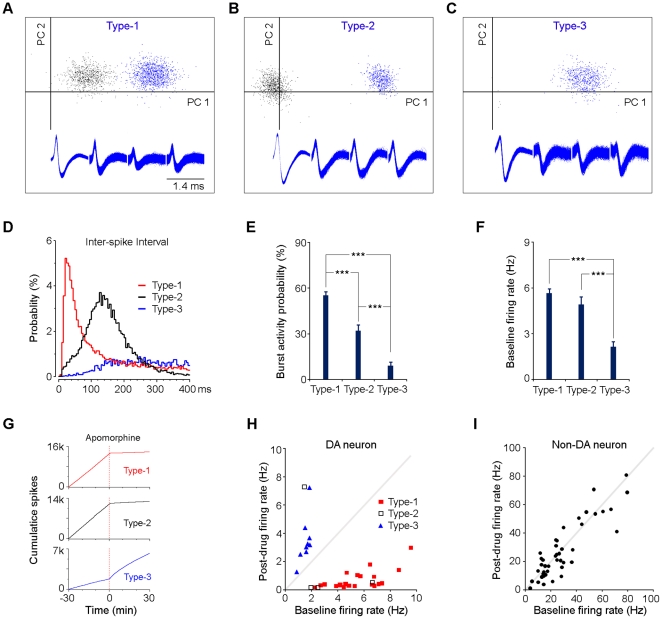
Figure 3 Firing patterns and pharmacology characterizations. (A–C) Three examples of tetrode-recorded putative dopamine neurons (type-1, type-2, and type-3) and their representative spike waveforms. PC1 and PC2 represent the first and second principal components in the principal component analysis, respectively. Blue dots represent individual spikes for the isolated dopamine neurons; black dots indicate individual spikes for other unsorted VTA neurons. (D) Inter-spike intervals of three examples of putative dopamine neurons (type-1, type-2, and type-3). (E) Percentages of burst firing for the three types of putative dopamine neurons. Error bars, s.e.m.; ***P<0.001, Student's t-test. (F) Baseline firing rates of the three types of putative dopamine neurons. Error bars, s.e.m.; ***P<0.001, Student's t-test. (G) Cumulative spike activity of thee examples of putative dopamine neurons (type-1, type-2, and type-3) in response to the dopamine receptor agonist apomorphine. It was noted that the type-1 and type-3 putative dopamine neurons were recorded simultaneously from one tetrode. (H and I) Baseline and post-drug firing rates of putative dopamine (H) and non-dopamine (I) neurons. Mice were injected with the dopamine receptor agonist apomorphine (1 mg/kg, i.p.) and the firing rates were averaged 30 min before and 30 min after apomorphine injection.
Figure 3 Firing patterns and pharmacology characterizations. (A–C) Three examples of tetrode-recorded putative dopamine neurons (type-1, type-2, and type-3) and their representative spike waveforms. PC1 and PC2 represent the first and second principal components in the principal component analysis, respectively. Blue dots represent individual spikes for the isolated dopamine neurons; black dots indicate individual spikes for other unsorted VTA neurons. (D) Inter-spike intervals of three examples of putative dopamine neurons (type-1, type-2, and type-3). (E) Percentages of burst firing for the three types of putative dopamine neurons. Error bars, s.e.m.; ***P<0.001, Student's t-test. (F) Baseline firing rates of the three types of putative dopamine neurons. Error bars, s.e.m.; ***P<0.001, Student's t-test. (G) Cumulative spike activity of thee examples of putative dopamine neurons (type-1, type-2, and type-3) in response to the dopamine receptor agonist apomorphine. It was noted that the type-1 and type-3 putative dopamine neurons were recorded simultaneously from one tetrode. (H and I) Baseline and post-drug firing rates of putative dopamine (H) and non-dopamine (I) neurons. Mice were injected with the dopamine receptor agonist apomorphine (1 mg/kg, i.p.) and the firing rates were averaged 30 min before and 30 min after apomorphine injection.CC BY · PubMed Central
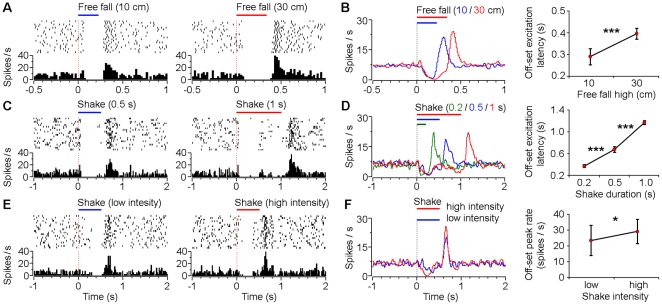
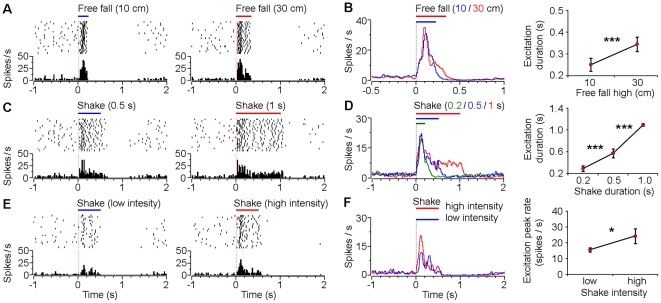
Figure 4 Responses of VTA type-1 putative dopamine neurons to different durations and intensities of fearful events. (A) Peri-event rasters (1–20 trials) and histograms of one example type-1 neuron in response to 10 cm (left) and 30 cm (right) free fall events. (B) Smoothed population average peri-event histograms (left) and offset excitation latencies (right) of type-1 neurons in response to 10 cm (blue line; n = 15) and 30 cm (red line; n = 20) free fall events. (C) Peri-event rasters and histograms of another type-1 neuron in response to 0.5 sec (left) and 1 sec (right) shake events. (D) Smoothed population average peri-event histograms (left) and offset excitation latencies (right) of type-1 neurons in response to 0.2 sec (green line; n = 13), 0.5 sec (blue line; n = 20), and 1 sec (red line; n = 14) shake events. (E) Peri-event rasters and histograms of another type-1 neuron in response to low-(left) and high-intensity (right) shake events. (F) Smoothed population average peri-event histograms (left) and offset excitation peak firing rates (right) of type-1 neurons in response to low- (blue line; n = 9) and high-intensity (red line; n = 9) shake events. Error bars, s.d.; *P<0.05, ***P<10-8, Student's t-test.
Figure 4 Responses of VTA type-1 putative dopamine neurons to different durations and intensities of fearful events. (A) Peri-event rasters (1–20 trials) and histograms of one example type-1 neuron in response to 10 cm (left) and 30 cm (right) free fall events. (B) Smoothed population average peri-event histograms (left) and offset excitation latencies (right) of type-1 neurons in response to 10 cm (blue line; n = 15) and 30 cm (red line; n = 20) free fall events. (C) Peri-event rasters and histograms of another type-1 neuron in response to 0.5 sec (left) and 1 sec (right) shake events. (D) Smoothed population average peri-event histograms (left) and offset excitation latencies (right) of type-1 neurons in response to 0.2 sec (green line; n = 13), 0.5 sec (blue line; n = 20), and 1 sec (red line; n = 14) shake events. (E) Peri-event rasters and histograms of another type-1 neuron in response to low-(left) and high-intensity (right) shake events. (F) Smoothed population average peri-event histograms (left) and offset excitation peak firing rates (right) of type-1 neurons in response to low- (blue line; n = 9) and high-intensity (red line; n = 9) shake events. Error bars, s.d.; *P<0.05, ***P<10-8, Student's t-test.CC BY · PubMed Central
Figure 5 Responses of VTA type-3 dopaminegic-like neurons to different durations and intensities of fearful events. (A) Peri-event rasters (1-20 trials) and histograms of one example type-3 neuron in response to 10 cm (left) and 30 cm (right) free fall events. (B) Smoothed population average peri-event histograms (left) and offset excitation latencies (right) of type-3 neurons in response to 10 cm (blue line; n = 8) and 30 cm (red line; n = 10) free fall events. (C) Peri-event rasters and histograms of the same neuron (as shown in A) in response to 0.5 sec (left) and 1 sec (right) shake events. (D) Smoothed population average peri-event histograms (left) and offset excitation latencies (right) of type-3 neurons in response to 0.2 sec (green line; n = 10), 0.5 sec (blue line; n = 9), and 1 sec (red line; n = 7) shake events. (E) Peri-event rasters and histograms of another type-3 neuron in response to low- (left) and high-intensity (right) shake events. (F) Smoothed population average peri-event histograms (left) and offset excitation peak firing rates (right) of type-3 neurons in response to low- (blue line; n = 5) and high-intensity (red line; n = 5) shake events. Error bars, s.d.; *P<0.05, ***P<10-5, Student's t-test.
Figure 5 Responses of VTA type-3 dopaminegic-like neurons to different durations and intensities of fearful events. (A) Peri-event rasters (1-20 trials) and histograms of one example type-3 neuron in response to 10 cm (left) and 30 cm (right) free fall events. (B) Smoothed population average peri-event histograms (left) and offset excitation latencies (right) of type-3 neurons in response to 10 cm (blue line; n = 8) and 30 cm (red line; n = 10) free fall events. (C) Peri-event rasters and histograms of the same neuron (as shown in A) in response to 0.5 sec (left) and 1 sec (right) shake events. (D) Smoothed population average peri-event histograms (left) and offset excitation latencies (right) of type-3 neurons in response to 0.2 sec (green line; n = 10), 0.5 sec (blue line; n = 9), and 1 sec (red line; n = 7) shake events. (E) Peri-event rasters and histograms of another type-3 neuron in response to low- (left) and high-intensity (right) shake events. (F) Smoothed population average peri-event histograms (left) and offset excitation peak firing rates (right) of type-3 neurons in response to low- (blue line; n = 5) and high-intensity (red line; n = 5) shake events. Error bars, s.d.; *P<0.05, ***P<10-5, Student's t-test.CC BY · PubMed Central
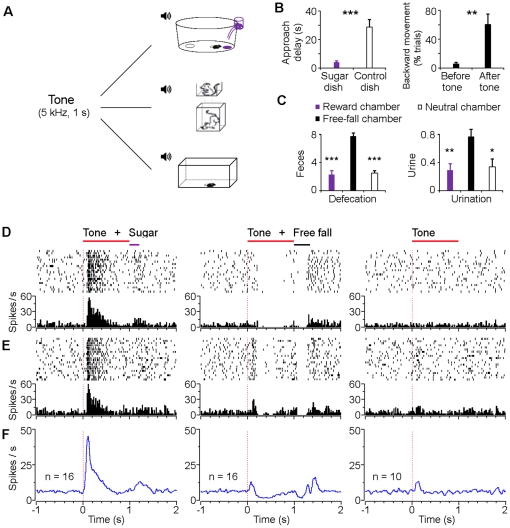
Figure 6 Bi-directional encoding of positive and negative signals via the same conditioned tone in different contexts. (A) Schematic of experimental paradigm for bidirectional conditioning. One tone (5 kHz, 1 sec) was used throughout: it predicted sugar pellet delivery in the reward chamber (top); it predicted free fall event in the free-fall chamber (middle); and it did not predict anything in the neutral chamber (bottom). (B) Left, delay of dish approach after onset of the conditioned tone that predicted sugar delivery. Right, mice showed significant increased backward movement after onset of the conditioned tone that predicted free fall event. (C) Aversion-like behaviors (frequent defecation and urination) elicited in the free-fall chamber compared with the reward or neutral chamber. Error bars, s.e.m.; n = 10; *P<0.05, **P<0.01, ***P<0.001, Student's t-test. (D, E) Peri-event rasters (1–20 trials) and histograms of two examples of VTA putative dopamine neurons in response to the same conditioned tone that predicted sugar pellet delivery (left), that predicted free fall event (middle), and that did not predict anything (right), with an interval of 1–2 h between sessions. (F) Smoothed population average peri-event histograms of fear-suppressed (type-1 and 2) putative dopamine neurons in response to the same conditioned tone that predicted sugar pellet (left panel; n = 16), that predicted free fall event (middle panel; the same 16 neurons as shown in the left panel), and that did not predict anything (right panel; n = 10). Free fall, 30 cm high.
Figure 6 Bi-directional encoding of positive and negative signals via the same conditioned tone in different contexts. (A) Schematic of experimental paradigm for bidirectional conditioning. One tone (5 kHz, 1 sec) was used throughout: it predicted sugar pellet delivery in the reward chamber (top); it predicted free fall event in the free-fall chamber (middle); and it did not predict anything in the neutral chamber (bottom). (B) Left, delay of dish approach after onset of the conditioned tone that predicted sugar delivery. Right, mice showed significant increased backward movement after onset of the conditioned tone that predicted free fall event. (C) Aversion-like behaviors (frequent defecation and urination) elicited in the free-fall chamber compared with the reward or neutral chamber. Error bars, s.e.m.; n = 10; *P<0.05, **P<0.01, ***P<0.001, Student's t-test. (D, E) Peri-event rasters (1–20 trials) and histograms of two examples of VTA putative dopamine neurons in response to the same conditioned tone that predicted sugar pellet delivery (left), that predicted free fall event (middle), and that did not predict anything (right), with an interval of 1–2 h between sessions. (F) Smoothed population average peri-event histograms of fear-suppressed (type-1 and 2) putative dopamine neurons in response to the same conditioned tone that predicted sugar pellet (left panel; n = 16), that predicted free fall event (middle panel; the same 16 neurons as shown in the left panel), and that did not predict anything (right panel; n = 10). Free fall, 30 cm high.CC BY · PubMed Central
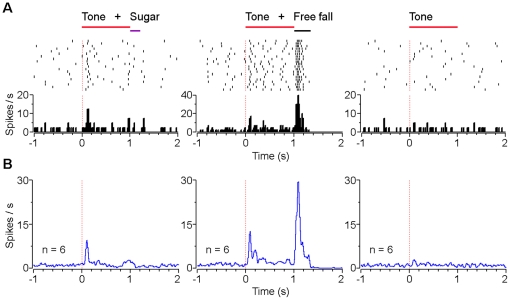
Figure 7 Responses of type-3 dopaminergic-like neurons to positive and negative signals via the same conditioned tone in different contexts. (A) Peri-event rasters (1–20 trials) and histograms of an example type-3 neuron in response to the same conditioned tone that predicted sugar pellet delivery (left), that predicted free fall event (middle), and that did not predict anything in the neutral chamber (right). (B) Smoothed population average peri-event histograms of type-3 neurons (n = 6) in response to the same conditioned tone that predicted sugar pellet delivery (left), that predicted free fall event (middle), and that did not predict anything (right). Free fall, 30 cm high.
Figure 7 Responses of type-3 dopaminergic-like neurons to positive and negative signals via the same conditioned tone in different contexts. (A) Peri-event rasters (1–20 trials) and histograms of an example type-3 neuron in response to the same conditioned tone that predicted sugar pellet delivery (left), that predicted free fall event (middle), and that did not predict anything in the neutral chamber (right). (B) Smoothed population average peri-event histograms of type-3 neurons (n = 6) in response to the same conditioned tone that predicted sugar pellet delivery (left), that predicted free fall event (middle), and that did not predict anything (right). Free fall, 30 cm high.CC BY · PubMed Central
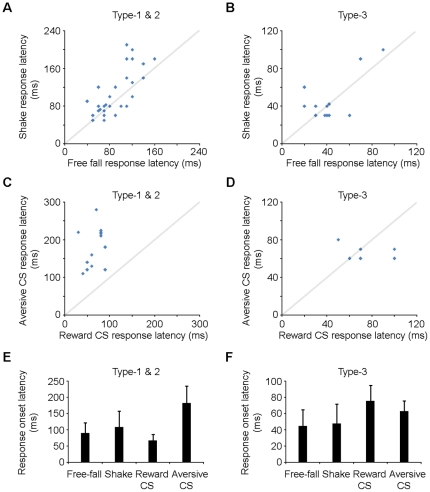
Figure 8 Response onset latencies of the VTA putative dopamine neurons. (A) Response onset latencies of individual type-1 and 2 dopamine neurons to free fall and shake events. (B) Response onset latencies of individual type-3 dopamine neurons to free fall and shake events. (C) Response onset latencies of individual type-1 and 2 dopamine neurons to the reward CS that predicted sugar pellet and the aversive CS that predicted free fall. (D) Response onset latencies of individual type-3 dopamine neurons to the reward CS that predicted sugar pellet and the aversive CS that predicted free fall. (E) Population average response onset latencies of type-1 and 2 dopamine neurons (from the same data as shown in A and C) and (F) type-3 neurons (from the same data as shown in B and D). Response onset latencies for type-1/2 neurons to free fall, shake and aversive CS correspond to the latencies of suppression; while the others correspond to the latencies of activation. Error bars, s.d.
Figure 8 Response onset latencies of the VTA putative dopamine neurons. (A) Response onset latencies of individual type-1 and 2 dopamine neurons to free fall and shake events. (B) Response onset latencies of individual type-3 dopamine neurons to free fall and shake events. (C) Response onset latencies of individual type-1 and 2 dopamine neurons to the reward CS that predicted sugar pellet and the aversive CS that predicted free fall. (D) Response onset latencies of individual type-3 dopamine neurons to the reward CS that predicted sugar pellet and the aversive CS that predicted free fall. (E) Population average response onset latencies of type-1 and 2 dopamine neurons (from the same data as shown in A and C) and (F) type-3 neurons (from the same data as shown in B and D). Response onset latencies for type-1/2 neurons to free fall, shake and aversive CS correspond to the latencies of suppression; while the others correspond to the latencies of activation. Error bars, s.d.CC BY · PubMed Central
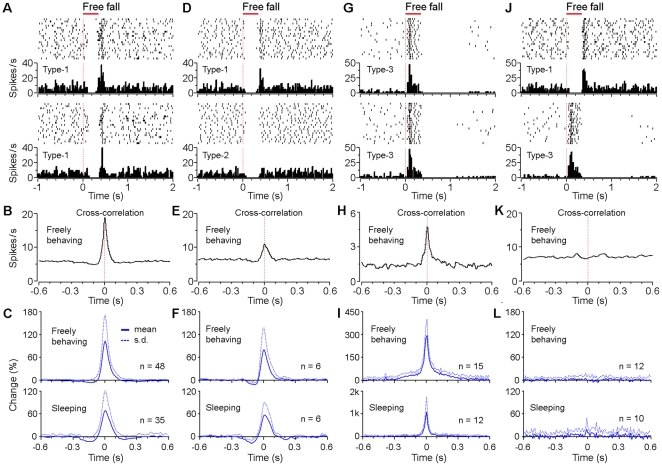
Figure 9 Synchrony among unique sets of VTA putative dopamine neurons. (A) Peri-event rasters (1–20 trials) and histograms of two simultaneously recorded type-1 neurons in response to free fall event, and (B) the cross-correlogram between these two neurons when the mouse was freely behaving. (C) The averaged cross-correlograms between simultaneously recorded type-1 neurons (48 pairs during freely behaving, and 35 pairs during sleep). (D) Peri-event rasters and histograms of two simultaneously recorded type-1 and type-2 neurons in response to free fall event, and (E) the cross-correlogram between these two neurons during freely behaving. (F) The averaged cross-correlograms between simultaneously recorded type-1 and type-2 neurons (6 pairs during both freely behaving and sleep). (G) Peri-event rasters and histograms of two simultaneously recorded type-3 neurons in response to free fall event, and (H) the cross-correlogram between these two neurons during freely behaving. (I) The averaged cross-correlograms between simultaneously recorded type-3 neurons (15 pairs during freely behaving, and 12 pairs during sleep). (J) Peri-event rasters and histograms of two type-1 and type-3 neurons (simultaneously recorded from one tetrode) in response to free fall event, and (K) the cross-correlogram between these two neurons during freely behaving. (L) The averaged cross-correlograms between simultaneously recorded type-1 and type-3 neurons (12 pairs during freely behaving, and 10 pairs during sleep). Free fall, 30 cm high.
Figure 9 Synchrony among unique sets of VTA putative dopamine neurons. (A) Peri-event rasters (1–20 trials) and histograms of two simultaneously recorded type-1 neurons in response to free fall event, and (B) the cross-correlogram between these two neurons when the mouse was freely behaving. (C) The averaged cross-correlograms between simultaneously recorded type-1 neurons (48 pairs during freely behaving, and 35 pairs during sleep). (D) Peri-event rasters and histograms of two simultaneously recorded type-1 and type-2 neurons in response to free fall event, and (E) the cross-correlogram between these two neurons during freely behaving. (F) The averaged cross-correlograms between simultaneously recorded type-1 and type-2 neurons (6 pairs during both freely behaving and sleep). (G) Peri-event rasters and histograms of two simultaneously recorded type-3 neurons in response to free fall event, and (H) the cross-correlogram between these two neurons during freely behaving. (I) The averaged cross-correlograms between simultaneously recorded type-3 neurons (15 pairs during freely behaving, and 12 pairs during sleep). (J) Peri-event rasters and histograms of two type-1 and type-3 neurons (simultaneously recorded from one tetrode) in response to free fall event, and (K) the cross-correlogram between these two neurons during freely behaving. (L) The averaged cross-correlograms between simultaneously recorded type-1 and type-3 neurons (12 pairs during freely behaving, and 10 pairs during sleep). Free fall, 30 cm high.CC BY · PubMed Central

Verification

Claims the paper makes

The claims and statistics of this paper haven’t been checked yet.

Run the check — free, no account needed. It reads the open-access text and checks the sources it cites.

A few free checks a day · papers already verified open instantly · results are public

Claims other papers make about this one

Each is checked against this paper’s own text: does it say what the citing paper says it does?

Self-check

Percentages, sums and reported differences re-computed from the paper’s own numbers.

The self-check needs the paper’s full text.

Citations

Cites

Show all 53 references

Cited by

Sorted by citations

See all 117

Metadata

Authors
Wang, D. V., & Tsien, J. Z.
Affiliations
East China Normal University (CN)
Corresponding author
Tsien, Joe Z.
Venue
PLoS ONE
Published
2011-02-15
Volume
6
Issue
2
Pages
e17047
ISSN
1932-6203 (ISSN-L)
OpenAlex
W2083000736
Cited by
116
References
53
Citations by year
2026: 2 · 2025: 8 · 2024: 5 · 2023: 1 · 2022: 4 · 2021: 4 · 2020: 6 · 2019: 6 · 2018: 6 · 2017: 5 · 2016: 8 · 2015: 7 · 2014: 17 · 2013: 13 · 2012: 17
FWCI
7.15
Type
journal article
Language
en
Open access
Locations
  • PLoS ONE (publishedVersion, cc-by)
  • PubMed Central (publishedVersion, cc-by)
  • PubMed (publishedVersion)
  • DOAJ (DOAJ: Directory of Open Access Journals) (submittedVersion, cc-by-sa)
  • Figshare (submittedVersion, cc-by)
Funders
  • Georgia Research Alliance
  • National Institute on Aging (AG025918, R01AG034663, AG024022, R01AG025918, AG034663, R01AG024022)
  • National Institute of Mental Health (MH060236, R01MH060236)
Topics
  • Life Sciences › Neuroscience › Cellular and Molecular Neuroscience › Neurotransmitter Receptor Influence on Behavior
  • Life Sciences › Neuroscience › Cognitive Neuroscience › Memory and Neural Mechanisms
  • Life Sciences › Neuroscience › Cognitive Neuroscience › Neural and Behavioral Psychology Studies
Keywords
ventral tegmental area, dopaminergic neurons, fear, reward, contextual modulation, free fall, mice
MeSH terms
Animals, Fear, Male, Mice, Inbred C57BL, Motivation, Time Factors, Ventral Tegmental Area, Mice, Dopaminergic Neurons

About these checks

Registry, retraction, Cites and statistics results are computed, not judged, with one exception: a printed reference that no index lists is read once by a model before it counts as a citation error. Claims are extracted by a model and kept only when their quote appears verbatim in the text; each cited source is then checked, with a model’s help, for whether it says what the claim relies on. Those verdicts can be wrong — read the claim’s quote and the cited source before relying on one.

Statistics and arithmetic are recomputed, not judged.

Confidence bands are shown only for fields calibrated on our annotated test set. None is calibrated yet, so no band is shown.

What counts as a claim ›How we measure confidence ›How we check this ›

Are you an author, or do you see a problem with this page? Request a review