Cited by 220Genetics and Neurodevelopmental DisordersAutism Spectrum Disorder ResearchNeuroendocrine regulation and behavior

The DOI matches its Crossref record; 126 of the 126 references it cites were found in a registry or an index.

Communication Impairments in Mice Lacking Shank1: Reduced Levels of Ultrasonic Vocalizations and Scent Marking Behavior

Open access

Abstract

Autism is a neurodevelopmental disorder with a strong genetic component. Core symptoms are abnormal reciprocal social interactions, qualitative impairments in communication, and repetitive and stereotyped patterns of behavior with restricted interests. Candidate genes for autism include the SHANK gene family, as mutations in SHANK2 and SHANK3 have been detected in several autistic individuals. SHANK genes code for a family of scaffolding proteins located in the postsynaptic density of excitatory synapses. To test the hypothesis that a mutation in SHANK1 contributes to the symptoms of autism, we evaluated Shank1(-/-) null mutant mice for behavioral phenotypes with relevance to autism, focusing on social communication. Ultrasonic vocalizations and the deposition of scent marks appear to be two major modes of mouse communication. Our findings revealed evidence for low levels of ultrasonic vocalizations and scent marks in Shank1(-/-) mice as compared to wildtype Shank1(+/+) littermate controls. Shank1(-/-) pups emitted fewer vocalizations than Shank1(+/+) pups when isolated from mother and littermates. In adulthood, genotype affected scent marking behavior in the presence of female urinary pheromones. Adult Shank1(-/-) males deposited fewer scent marks in proximity to female urine than Shank1(+/+) males. Call emission in response to female urinary pheromones also differed between genotypes. Shank1(+/+) mice changed their calling pattern dependent on previous female interactions, while Shank1(-/-) mice were unaffected, indicating a failure of Shank1(-/-) males to learn from a social experience. The reduced levels of ultrasonic vocalizations and scent marking behavior in Shank1(-/-) mice are consistent with a phenotype relevant to social communication deficits in autism.

Overview

The claims and statistics of this paper haven’t been checked yet.

Run the check — free, no account needed. It reads the open-access text and checks the sources it cites.

A few free checks a day · papers already verified open instantly · results are public

Integrity signals

Registry

Crossref · 10.1371/journal.pone.0020631

Cites

126 of 126 references verified0 citation errors · 0 not checkable

Statistics

Figures

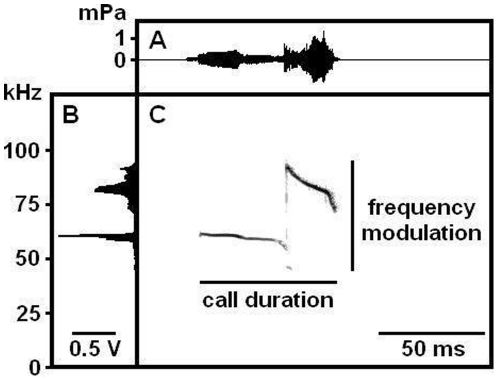
Figure 1 Analysis of ultrasonic vocalizations. Energy within the spectrum is shown by time (A) and frequency (B) and time x frequency (C, reflected as “darkness”). Peak amplitude, i.e. loudness, was defined as the point with the highest energy within the spectrum (“darkest” points over time in C). Peak frequency was defined as the frequency at the location of the peak amplitude within the spectrum (“darkest” points over time in C). Peak frequency and peak amplitude were derived from the average spectrum of the entire call, meaning that values obtained per time point were averaged over time. The extent of frequency modulation was defined as the difference between the lowest and the highest peak frequency within each call, i.e. derived from the non-averaged call (C). Temporal parameters were latency to start calling, total calling time, call duration (C).
Figure 1 Analysis of ultrasonic vocalizations. Energy within the spectrum is shown by time (A) and frequency (B) and time x frequency (C, reflected as “darkness”). Peak amplitude, i.e. loudness, was defined as the point with the highest energy within the spectrum (“darkest” points over time in C). Peak frequency was defined as the frequency at the location of the peak amplitude within the spectrum (“darkest” points over time in C). Peak frequency and peak amplitude were derived from the average spectrum of the entire call, meaning that values obtained per time point were averaged over time. The extent of frequency modulation was defined as the difference between the lowest and the highest peak frequency within each call, i.e. derived from the non-averaged call (C). Temporal parameters were latency to start calling, total calling time, call duration (C).CC0 · PubMed Central
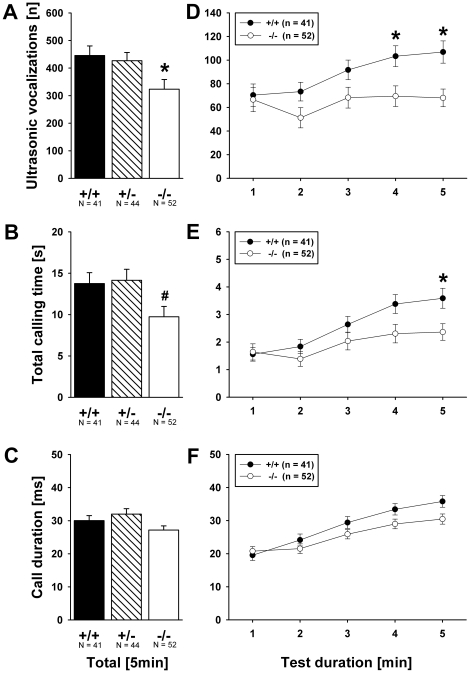
Figure 2 Ultrasonic vocalizations in isolated Shank1 pups. (A) Total number of ultrasonic vocalizations, (B) total calling time and (C) duration of calls emitted during the 5 min isolation from mother and littermates. (D) Time course for the number of ultrasonic vocalizations, (E) total calling time and (F) duration of calls emitted for each 1 min time bin across the 5 min isolation session. Black bar: Shank1+/+ wildtype littermate control mice; striped bar: Shank1+/ − heterozygote mice; white bar: Shank1 −/− null mutant mice. For the sake of clarity, Shank1+/ − heterozygote mice were not included in the time course graphs, while still included in the statistical analysis. Data are presented as means ± standard errors of the mean. * p<0.050 vs. Shank1+/+; # p<0.050 vs. Shank1+/ −.
Figure 2 Ultrasonic vocalizations in isolated Shank1 pups. (A) Total number of ultrasonic vocalizations, (B) total calling time and (C) duration of calls emitted during the 5 min isolation from mother and littermates. (D) Time course for the number of ultrasonic vocalizations, (E) total calling time and (F) duration of calls emitted for each 1 min time bin across the 5 min isolation session. Black bar: Shank1+/+ wildtype littermate control mice; striped bar: Shank1+/ − heterozygote mice; white bar: Shank1 −/− null mutant mice. For the sake of clarity, Shank1+/ − heterozygote mice were not included in the time course graphs, while still included in the statistical analysis. Data are presented as means ± standard errors of the mean. * p<0.050 vs. Shank1+/+; # p<0.050 vs. Shank1+/ −.CC0 · PubMed Central
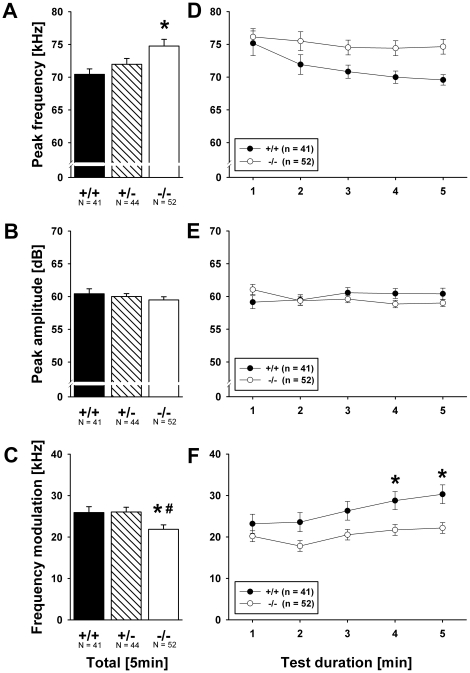
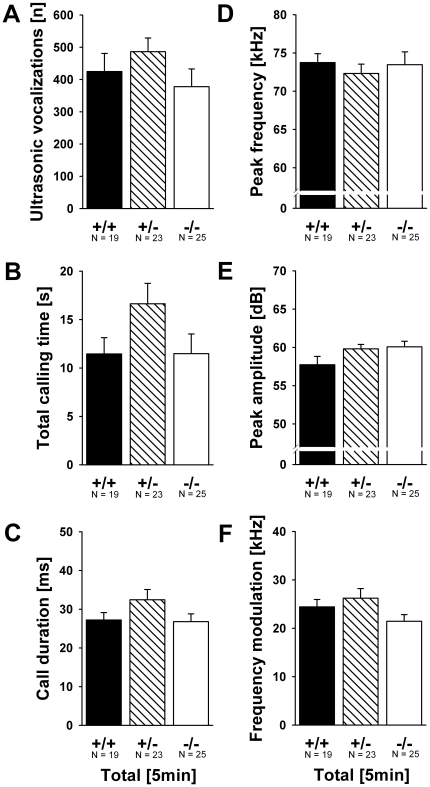
Figure 3 Ultrasonic vocalizations in isolated Shank1 pups. (A) Peak frequency, (B) peak amplitude and (C) frequency modulation of calls emitted during the 5 min isolation from mother and littermates. (D) Time course for the peak frequency, (E) peak amplitude, and (F) frequency modulation of calls emitted for each 1 min time bin across the 5 min isolation session. Black bar: Shank1+/+ wildtype littermate control mice; striped bar: Shank1+/ − heterozygote mice; white bar: Shank1 −/− null mutant mice. For the sake of clarity, Shank1+/ − heterozygote mice were not included in the time course graphs, while still included in the statistical analysis. Data are presented as means ± standard errors of the mean. * p<0.050 vs. Shank1+/+; # p<0.050 vs. Shank1+/.
Figure 3 Ultrasonic vocalizations in isolated Shank1 pups. (A) Peak frequency, (B) peak amplitude and (C) frequency modulation of calls emitted during the 5 min isolation from mother and littermates. (D) Time course for the peak frequency, (E) peak amplitude, and (F) frequency modulation of calls emitted for each 1 min time bin across the 5 min isolation session. Black bar: Shank1+/+ wildtype littermate control mice; striped bar: Shank1+/ − heterozygote mice; white bar: Shank1 −/− null mutant mice. For the sake of clarity, Shank1+/ − heterozygote mice were not included in the time course graphs, while still included in the statistical analysis. Data are presented as means ± standard errors of the mean. * p<0.050 vs. Shank1+/+; # p<0.050 vs. Shank1+/.CC0 · PubMed Central
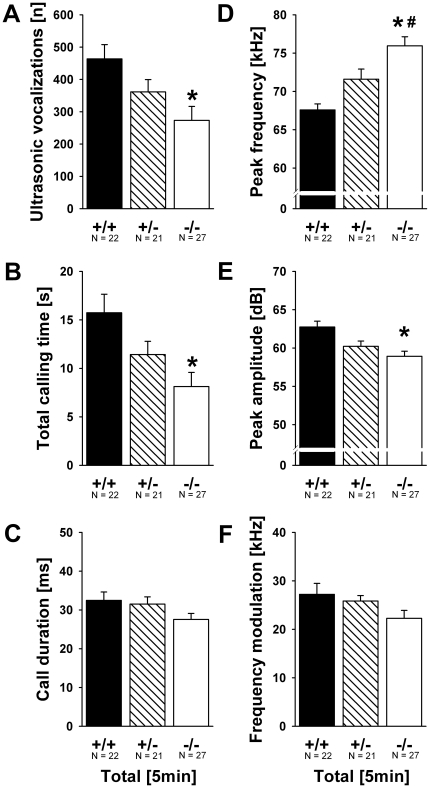
Figure 4 Ultrasonic vocalizations in isolated female Shank1 pups. (A) Total number of ultrasonic vocalizations, (B) total calling time, (C) duration of calls, (D) peak frequency, (E) peak amplitude and (F) frequency modulation of calls emitted during the 5 min isolation from mother and littermates. Black bar: Shank1+/+ wildtype littermate control mice; striped bar: Shank1+/ − heterozygote mice; white bar: Shank1 −/− null mutant mice. Data are presented as means ± standard errors of the mean. * p<0.050 vs. Shank1+/+; # p<0.050 vs. Shank1+/ −.
Figure 4 Ultrasonic vocalizations in isolated female Shank1 pups. (A) Total number of ultrasonic vocalizations, (B) total calling time, (C) duration of calls, (D) peak frequency, (E) peak amplitude and (F) frequency modulation of calls emitted during the 5 min isolation from mother and littermates. Black bar: Shank1+/+ wildtype littermate control mice; striped bar: Shank1+/ − heterozygote mice; white bar: Shank1 −/− null mutant mice. Data are presented as means ± standard errors of the mean. * p<0.050 vs. Shank1+/+; # p<0.050 vs. Shank1+/ −.CC0 · PubMed Central
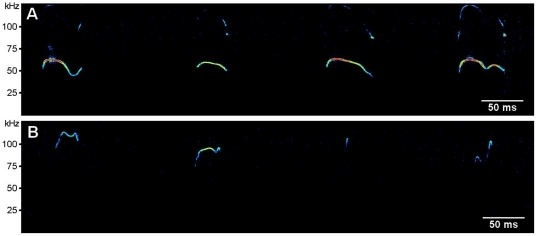
Figure 5 Ultrasonic vocalizations in isolated female Shank1 pups. (A) Representative spectrograms of ultrasonic vocalizations emitted by a female Shank1+/+ wildtype littermate control mouse and (B) a female Shank1 −/− null mutant mouse.
Figure 5 Ultrasonic vocalizations in isolated female Shank1 pups. (A) Representative spectrograms of ultrasonic vocalizations emitted by a female Shank1+/+ wildtype littermate control mouse and (B) a female Shank1 −/− null mutant mouse.CC0 · PubMed Central
Figure 6 Ultrasonic vocalizations in isolated male Shank1 pups. (A) Total number of ultrasonic vocalizations, (B) total calling time, (C) duration of calls, (D) peak frequency, (E) peak amplitude and (F) frequency modulation of calls emitted during the 5 min isolation from mother and littermates. Black bar: Shank1+/+ wildtype littermate control mice; striped bar: Shank1+/ − heterozygote mice; white bar: Shank1 −/− null mutant mice. Data are presented as means ± standard errors of the mean. * p<0.050 vs. Shank1+/+; # p<0.050 vs. Shank1+/ −.
Figure 6 Ultrasonic vocalizations in isolated male Shank1 pups. (A) Total number of ultrasonic vocalizations, (B) total calling time, (C) duration of calls, (D) peak frequency, (E) peak amplitude and (F) frequency modulation of calls emitted during the 5 min isolation from mother and littermates. Black bar: Shank1+/+ wildtype littermate control mice; striped bar: Shank1+/ − heterozygote mice; white bar: Shank1 −/− null mutant mice. Data are presented as means ± standard errors of the mean. * p<0.050 vs. Shank1+/+; # p<0.050 vs. Shank1+/ −.CC0 · PubMed Central
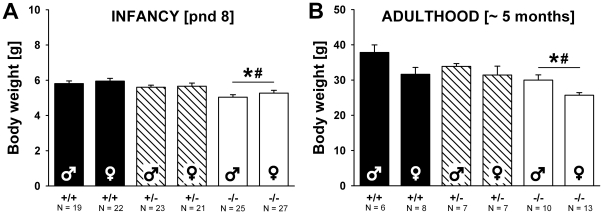
Figure 7 Body weight in Shank1 mice. (A) Body weight in pups tested for isolation-induced ultrasonic vocalizations on postnatal day (pnd) 8. (B) Body weight in adult mice approximately 5 months of age. Black bar: Shank1+/+ wildtype littermate control mice; striped bar: Shank1+/ − heterozygote mice; white bar: Shank1 −/− null mutant mice. Data are presented as means ± standard errors of the mean. * p<0.050 vs. Shank1+/+; # p<0.050 vs. Shank1+/ −.
Figure 7 Body weight in Shank1 mice. (A) Body weight in pups tested for isolation-induced ultrasonic vocalizations on postnatal day (pnd) 8. (B) Body weight in adult mice approximately 5 months of age. Black bar: Shank1+/+ wildtype littermate control mice; striped bar: Shank1+/ − heterozygote mice; white bar: Shank1 −/− null mutant mice. Data are presented as means ± standard errors of the mean. * p<0.050 vs. Shank1+/+; # p<0.050 vs. Shank1+/ −.CC0 · PubMed Central
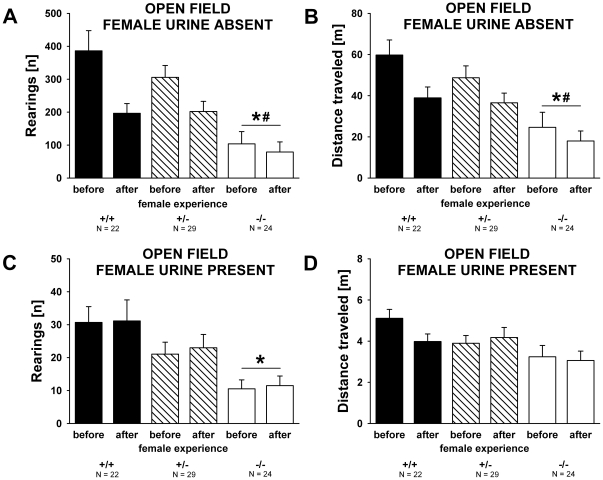
Figure 8 Open field activity in the absence and presence of female urine in adult male Shank1 mice. (A) Total number of rearings and (B) distance traveled during the 60 min habituation session to the clean open field without female urine displayed by male subjects before they had an experience of social interactions with a female, and 7 days after they had a 5 minute experience of social interactions with a female. (C) Total number of rearings and (D) distance traveled during the 5 min test session in the same open field containing urine from a female C57BL/6J mouse displayed by male subjects before they had an experience of social interactions with a female and after female experience. Black bar: Shank1+/+ wildtype littermate control mice; striped bar: Shank1+/ − heterozygote mice; white bar: Shank1 −/− null mutant mice. Data are presented as means ± standard errors of the mean. * p<0.050 vs. Shank1+/+; # p<0.050 vs. Shank1+/ −.
Figure 8 Open field activity in the absence and presence of female urine in adult male Shank1 mice. (A) Total number of rearings and (B) distance traveled during the 60 min habituation session to the clean open field without female urine displayed by male subjects before they had an experience of social interactions with a female, and 7 days after they had a 5 minute experience of social interactions with a female. (C) Total number of rearings and (D) distance traveled during the 5 min test session in the same open field containing urine from a female C57BL/6J mouse displayed by male subjects before they had an experience of social interactions with a female and after female experience. Black bar: Shank1+/+ wildtype littermate control mice; striped bar: Shank1+/ − heterozygote mice; white bar: Shank1 −/− null mutant mice. Data are presented as means ± standard errors of the mean. * p<0.050 vs. Shank1+/+; # p<0.050 vs. Shank1+/ −.CC0 · PubMed Central
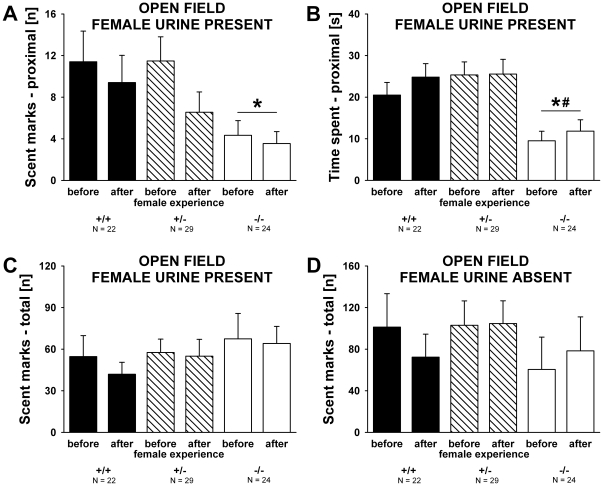
Figure 9 Scent marking behavior in the absence and presence of female urine in adult male Shank1 mice. (A) Number of scent marks deposited near (within 10 cm2 around) the female urine spot deposited by male subjects before they had an experience of social interactions with a female, and 7 days after they had a 5 minute experience of social interactions with a female. (B) Time spent in proximity to the female urine spot (10 cm2) by male subjects before they had an experience of social interactions with a female and after female experience. (C) Total number of scent marks deposited throughout the entire open field during the 5 min test session in the open field containing urine from a female C57BL/6J mouse deposited by male subjects before they had an experience of social interactions with a female and after female experience. (D) Total number of scent marks deposited throughout the entire open field during the 60 min habituation session in the clean open field without female urine deposited by male subjects before they had an experience of social interactions with a female and after female experience. Black bar: Shank1+/+ wildtype littermate control mice; striped bar: Shank1+/ − heterozygote mice; white bar: Shank1 −/− null mutant mice. Data are presented as means ± standard errors of the mean. * p<0.050 vs. Shank1+/+; # p<0.050 vs. Shank1+/ −.
Figure 9 Scent marking behavior in the absence and presence of female urine in adult male Shank1 mice. (A) Number of scent marks deposited near (within 10 cm2 around) the female urine spot deposited by male subjects before they had an experience of social interactions with a female, and 7 days after they had a 5 minute experience of social interactions with a female. (B) Time spent in proximity to the female urine spot (10 cm2) by male subjects before they had an experience of social interactions with a female and after female experience. (C) Total number of scent marks deposited throughout the entire open field during the 5 min test session in the open field containing urine from a female C57BL/6J mouse deposited by male subjects before they had an experience of social interactions with a female and after female experience. (D) Total number of scent marks deposited throughout the entire open field during the 60 min habituation session in the clean open field without female urine deposited by male subjects before they had an experience of social interactions with a female and after female experience. Black bar: Shank1+/+ wildtype littermate control mice; striped bar: Shank1+/ − heterozygote mice; white bar: Shank1 −/− null mutant mice. Data are presented as means ± standard errors of the mean. * p<0.050 vs. Shank1+/+; # p<0.050 vs. Shank1+/ −.CC0 · PubMed Central
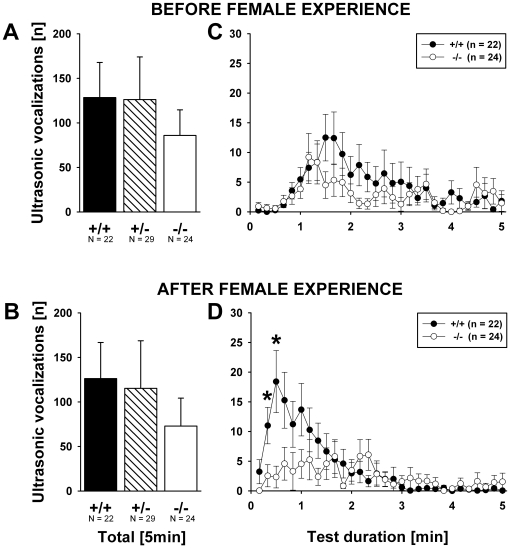
Figure 10 Ultrasonic vocalizations in the presence of female urine in adult male Shank1 mice. (A) Total number of ultrasonic vocalizations emitted during the 5 min test session in the open field containing urine from a female C57BL/6J mouse by male subjects before they had an experience of social interactions with a female. (B) Total number of ultrasonic vocalizations emitted during the 5 min test session in the open field containing urine from a female C57BL/6J mouse by male subjects 7 days after they had a 5 minute experience of social interactions with a female. (C) Time course for the number of ultrasonic vocalizations emitted for each 10 s time bin across the 5 min test session with exposure to female urine before female experience. (D) Time course for the number of ultrasonic vocalizations emitted for each 10 s time bin across the 5 min test session with exposure to female urine after female experience. Black bar: Shank1+/+ wildtype littermate control mice; striped bar: Shank1+/ − heterozygote mice; white bar: Shank1 −/− null mutant mice. For the sake of clarity, Shank1+/ − heterozygote mice were not included in the time course graphs, while still included in the statistical analysis. Data are presented as means ± standard errors of the mean. * p<0.050 vs. Shank1+/+; # p<0.050 vs. Shank1+/ −.
Figure 10 Ultrasonic vocalizations in the presence of female urine in adult male Shank1 mice. (A) Total number of ultrasonic vocalizations emitted during the 5 min test session in the open field containing urine from a female C57BL/6J mouse by male subjects before they had an experience of social interactions with a female. (B) Total number of ultrasonic vocalizations emitted during the 5 min test session in the open field containing urine from a female C57BL/6J mouse by male subjects 7 days after they had a 5 minute experience of social interactions with a female. (C) Time course for the number of ultrasonic vocalizations emitted for each 10 s time bin across the 5 min test session with exposure to female urine before female experience. (D) Time course for the number of ultrasonic vocalizations emitted for each 10 s time bin across the 5 min test session with exposure to female urine after female experience. Black bar: Shank1+/+ wildtype littermate control mice; striped bar: Shank1+/ − heterozygote mice; white bar: Shank1 −/− null mutant mice. For the sake of clarity, Shank1+/ − heterozygote mice were not included in the time course graphs, while still included in the statistical analysis. Data are presented as means ± standard errors of the mean. * p<0.050 vs. Shank1+/+; # p<0.050 vs. Shank1+/ −.CC0 · PubMed Central

Verification

Claims the paper makes

The claims and statistics of this paper haven’t been checked yet.

Run the check — free, no account needed. It reads the open-access text and checks the sources it cites.

A few free checks a day · papers already verified open instantly · results are public

Claims other papers make about this one

Each is checked against this paper’s own text: does it say what the citing paper says it does?

Self-check

Percentages, sums and reported differences re-computed from the paper’s own numbers.

The self-check needs the paper’s full text.

Citations

Cites

Show all 126 references

Research works printed but not linked: 1

  1. J Nyby, 1979, Elicitation of male mouse (Mus musculus) ultrasonic vocalizations: I. Urinary cues., J Comp Physiol Psychol, 93, 957, 10.1037/h0077623 · DOI

Cited by

Sorted by citations

See all 220

Metadata

Authors
Wöhr, M., Roullet, F. I., Hung, A. Y., Sheng, M., & Crawley, J. N.
Affiliations
  • National Institutes of Health (US)
  • Massachusetts Institute of Technology (US)
Corresponding author
  • Wöhr, Markus
  • Crawley, Jacqueline N.
Venue
PLoS ONE
Published
2011-06-09
Volume
6
Issue
6
Pages
e20631
ISSN
1932-6203 (ISSN-L)
OpenAlex
W2115330604
Cited by
220
References
126
Citations by year
2026: 7 · 2025: 8 · 2024: 10 · 2023: 11 · 2022: 14 · 2021: 14 · 2020: 10 · 2019: 11 · 2018: 9 · 2017: 16 · 2016: 21 · 2015: 23 · 2014: 21 · 2013: 19 · 2012: 22
FWCI
13.17
Type
journal article
Language
en
Open access
Locations
  • PLoS ONE (publishedVersion, public-domain)
  • PubMed Central (publishedVersion, public-domain)
  • PubMed (publishedVersion)
  • Lirias (submittedVersion, other-oa)
  • DOAJ (DOAJ: Directory of Open Access Journals) (submittedVersion, cc-by-sa)
  • DSpace@MIT (Massachusetts Institute of Technology) (submittedVersion, cc-by-nc)
Funders
  • National Institutes of Health
  • National Institute of Mental Health
Topics
  • Life Sciences › Biochemistry, Genetics and Molecular Biology › Genetics › Genetics and Neurodevelopmental Disorders
  • Life Sciences › Neuroscience › Cognitive Neuroscience › Autism Spectrum Disorder Research
  • Life Sciences › Neuroscience › Endocrine and Autonomic Systems › Neuroendocrine regulation and behavior
Keywords
Shank1, autism spectrum disorder, social communication, ultrasonic vocalizations, scent marking, urinary pheromones, postsynaptic scaffolding proteins, social learning, social behavior deficits
MeSH terms
Aging, Animals, Body Temperature, Body Weight, Female, Male, Membrane Proteins, Nerve Tissue Proteins, Odorants, Reflex, Ultrasonics, Vocalization, Animal, Mice

About these checks

Registry, retraction, Cites and statistics results are computed, not judged, with one exception: a printed reference that no index lists is read once by a model before it counts as a citation error. Claims are extracted by a model and kept only when their quote appears verbatim in the text; each cited source is then checked, with a model’s help, for whether it says what the claim relies on. Those verdicts can be wrong — read the claim’s quote and the cited source before relying on one.

Statistics and arithmetic are recomputed, not judged.

Confidence bands are shown only for fields calibrated on our annotated test set. None is calibrated yet, so no band is shown.

What counts as a claim ›How we measure confidence ›How we check this ›

Are you an author, or do you see a problem with this page? Request a review