

The DOI matches its Crossref record; 9 of the 10 references it cites were found in a registry or an index.
Assessing Google Flu Trends Performance in the United States during the 2009 Influenza Virus A (H1N1) Pandemic
Open accessAbstract
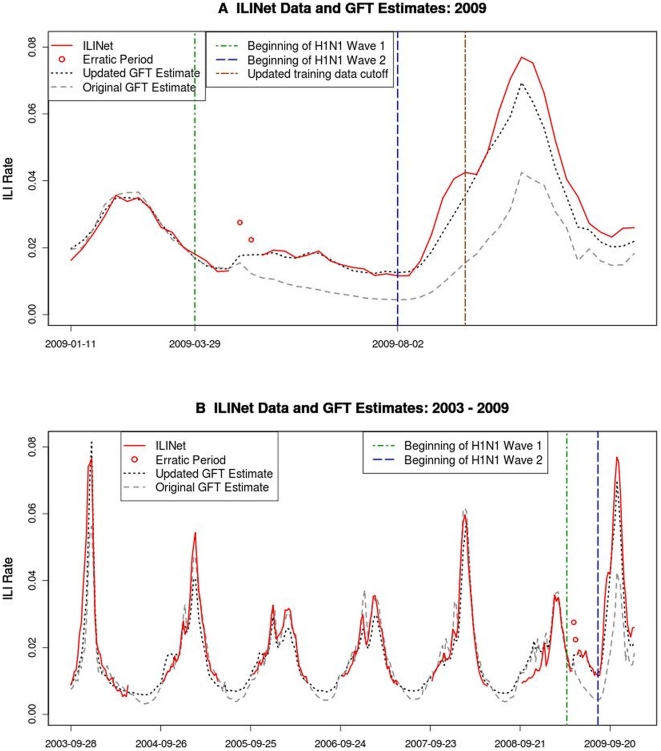
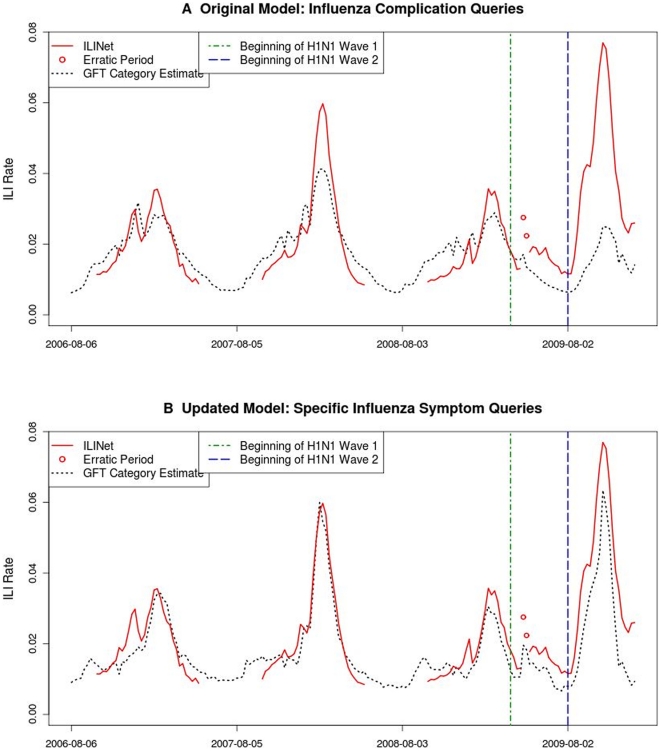
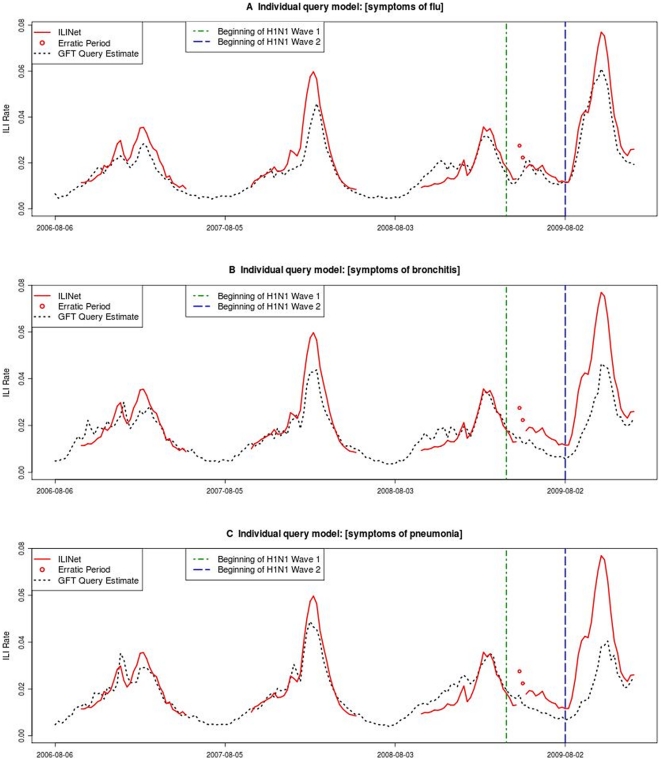
BACKGROUND: Google Flu Trends (GFT) uses anonymized, aggregated internet search activity to provide near-real time estimates of influenza activity. GFT estimates have shown a strong correlation with official influenza surveillance data. The 2009 influenza virus A (H1N1) pandemic [pH1N1] provided the first opportunity to evaluate GFT during a non-seasonal influenza outbreak. In September 2009, an updated United States GFT model was developed using data from the beginning of pH1N1. METHODOLOGY/PRINCIPAL FINDINGS: We evaluated the accuracy of each U.S. GFT model by comparing weekly estimates of ILI (influenza-like illness) activity with the U.S. Outpatient Influenza-like Illness Surveillance Network (ILINet). For each GFT model we calculated the correlation and RMSE (root mean square error) between model estimates and ILINet for four time periods: pre-H1N1, Summer H1N1, Winter H1N1, and H1N1 overall (Mar 2009-Dec 2009). We also compared the number of queries, query volume, and types of queries (e.g., influenza symptoms, influenza complications) in each model. Both models' estimates were highly correlated with ILINet pre-H1N1 and over the entire surveillance period, although the original model underestimated the magnitude of ILI activity during pH1N1. The updated model was more correlated with ILINet than the original model during Summer H1N1 (r = 0.95 and 0.29, respectively). The updated model included more search query terms than the original model, with more queries directly related to influenza infection, whereas the original model contained more queries related to influenza complications. CONCLUSIONS: Internet search behavior changed during pH1N1, particularly in the categories "influenza complications" and "term for influenza." The complications associated with pH1N1, the fact that pH1N1 began in the summer rather than winter, and changes in health-seeking behavior each may have played a part. Both GFT models performed well prior to and during pH1N1, although the updated model performed better during pH1N1, especially during the summer months.
Overview
The claims and statistics of this paper haven’t been checked yet.
Run the check — free, no account needed. It reads the open-access text and checks the sources it cites.
Integrity signals
Registry
Cites
Statistics
Figures
Verification
Claims the paper makes
The claims and statistics of this paper haven’t been checked yet.
Run the check — free, no account needed. It reads the open-access text and checks the sources it cites.
Claims other papers make about this one
Each is checked against this paper’s own text: does it say what the citing paper says it does?
The cited source doesn’t support the claim as written.
In the citing paper
“This ad hoc method of throwing out peculiar search terms failed when GFT completely missed the nonseasonal 2009 infl uenza A–H1N1 pandemic ( 2, 14).”
From The Parable of Google Flu: Traps in Big Data Analysis (2014) · cites this paper as [14]
Checked by a reasoning model — may be wrong.
Experimental — accuracy not yet measuredThe cited source doesn’t support the claim as written.
In the citing paper
“Oddly, the few search terms offered in the papers ( 14) do not seem to be strongly related with either GFT or the CDC data (SM)—we surmise that the authors felt an unarticulated need to cloak the actual search terms identifi ed.”
From The Parable of Google Flu: Traps in Big Data Analysis (2014) · cites this paper as [14]
Checked by a reasoning model — may be wrong.
Experimental — accuracy not yet measuredThe source backs part of the claim, not all of it — or backs it for a different population, condition or comparison.
In the citing paper
“GFT has never documented the 45 search terms used, and the examples that have been released appear misleading ( 14) (SM).”
From The Parable of Google Flu: Traps in Big Data Analysis (2014) · cites this paper as [14]
Experimental — accuracy not yet measured
Self-check
Percentages, sums and reported differences re-computed from the paper’s own numbers.
The self-check needs the paper’s full text.
Citations
Cites
MapReduce: simplified data processing on large clusters
Dean, J., & Ghemawat, S. (2008) · Communications of the ACM · doi:10.1145/1327452.1327492 · Cited by 18,476
Detecting influenza epidemics using search engine query data
Ginsberg, J., Mohebbi, M. H., Patel, R. S., Brammer, L., Smolinski, M. S., & Brilliant, L. (2009) · Nature · doi:10.1038/nature07634 · Cited by 4,295
Self-citationEmergence of a Novel Swine-Origin Influenza A (H1N1) Virus in Humans
Novel Swine-Origin Influenza A (H1N1) Virus Investigation Team (2009) · New England Journal of Medicine · doi:10.1056/nejmoa0903810 · Cited by 3,063
Infodemiology: tracking flu-related searches on the web for syndromic surveillance.
Eysenbach, G. (2006) · PubMed · Cited by 414
Kelly, H., & Grant, K. A. (2009) · Eurosurveillance · doi:10.2807/ese.14.31.19288-en · Cited by 193
Interpreting “Google Flu Trends” data for pandemic H1N1 influenza: The New Zealand experience
Wilson, N., Mason, K., Tobias, M., Peacey, M., Huang, Q. S., & Baker, M. G. (2009) · Eurosurveillance · doi:10.2807/ese.14.44.19386-en · Cited by 78
Brammer, L., Blanton, L., Epperson, S., Mustaquim, D., Bishop, A., Kniss, K. L., Dhara, R., Nowell, M., Kamimoto, L., & Finelli, L. (2010) · Clinical Infectious Diseases · doi:10.1093/cid/ciq009 · Cited by 67
Influenza activity--United States and worldwide, 2007-08 season.
(2008) · PubMed · Cited by 63
Reed, C., Angulo, F. J., Biggerstaff, M., Swerdlow, D. L., & Finelli, L. (2010) · Clinical Infectious Diseases · doi:10.1093/cid/ciq024 · Cited by 16
Cited by
Sorted by citations
Items 301–379 of 379
The use of web activity evidence to increase the timeliness of official statistics indicators
Reis, F., Ferreira, P. L., & Perduca, V. (2014) · HAL · Cited by 1
Drivers and Barriers to Adoption
Rahurkar, S., Dixon, B. E., & Menachemi, N. (2016) · Elsevier eBooks · doi:10.1016/b978-0-12-803135-3.00003-7 · Cited by 1
Users’ Internet Searches as Proxies for Disease Escalation Trends
Alsmadi, I. M., & Obeidat, R. (2019) · IEEE/ACM Conference on Connected Health: Applications, Systems and Engineering Technologies · doi:10.1109/chase48038.2019.00026 · Cited by 1
Enhancing Surveillance: New Data, New Technologies, and New Actors
Francis, J. G., & Francis, L. P. (2021) · Public health ethics analysis · doi:10.1007/978-3-030-63928-0_5 · Cited by 1
Hersh, W. (2020) · Health informatics · doi:10.1007/978-3-030-47686-1_8 · Cited by 1
Hygiene, J. O. P. M. A. (2022) · PubMed Central · doi:10.15167/2421-4248/jpmh2022.63.2s2 · Cited by 1
Butt, Z. A. (2023) · Elsevier eBooks · doi:10.1016/b978-0-443-15299-3.00010-5 · Cited by 1
Google Flu Trends y los datos masivos: ¿extrapolable al ébola?
López, P. J. L. (2016) · TECHNO REVIEW International Technology Science and Society Review /Revista Internacional de Tecnología Ciencia y Sociedad · doi:10.37467/gka-revtechno.v5.465 · Cited by 1
SeyyedHosseini, S., Asemi, A., Shabani, A., & CheshmehSohrabi, M. (2017) · Cited by 1
Infectious disease infection index information system
Jang, B., Lee, M., Kim, M. H., Kim, H. J., Yoo, H., & Kim, J. W. (2019) · International Conference on Consumer Electronics · doi:10.1109/icce.2019.8661844 · Cited by 1
Big Data and Wellbeing in the Arab World
Shehhi, A. A., Grey, I. M., & Thomas, J. (2019) · Springer eBooks · doi:10.1007/978-3-030-13921-6_8 · Cited by 1
Patología respiratoria en la era del big data
Prats-Peinado, L., & Izquierdo-Alonso, J. L. (2020) · Open Respiratory Archives · doi:10.1016/j.opresp.2020.07.003 · Cited by 1
Improving Public Transportation Safety in COVID-19 Era Through Crowdsourcing Technique
Pan, Q., Jin, Z., & Tao, T. (2021) · Human dynamics in smart cities · doi:10.1007/978-3-030-72808-3_17 · Cited by 1
The Importance of Geography in Disease Surveillance
Blatt, A. J. (2014) · Springer eBooks · doi:10.1007/978-3-319-12003-4_2 · Cited by 1
Kusiak, C. (2021) · ScholarWorks@UMassAmherst (University of Massachusetts Amherst) · doi:10.7275/12681214 · Cited by 1
Alessa, A. (2018) · University of Bridgeport ScholarWorks (University of Bridgeport) · Cited by 1
Learning from pandemics: using extraordinary events can improve disease now-casting modelsPreprint
Mesquita, S., Vieira, C. H., Perfeito, L., & Gonçalves-Sá, J. (2021) · medRxiv · doi:10.1101/2021.01.18.21250056 · Cited by 1
Google’s flu fail shows the problem with big data
Kucharski, A. J. (2013) · doi:10.64628/ab.ryppx3khp · Cited by 1
Investigation of Disease Outbreaks
Munjal, I. M., & Ostrowsky, B. E. (2015) · ASM Press eBooks · doi:10.1128/9781555817381.ch9
Murray Valley encephalitis virus infection
Combs, B. (2013)
Visualizing Big Data amounts : The Case of Google Flu Trends (GFT)
Goysdotter, M., & Grönberg-Hernández, J. (2015) · Lund University Publications (Lund University)
Cho, S. J., Sohn, C. H., Jo, M. W., Shin, S.-Y., Lee, J. H., Ryoo, S. M., Kim, W. Y., & Seo, D. (2014) · PLoS ONE · doi:10.1371/annotation/4d9f12df-8b56-4e2f-b00b-4598fd5937eb
Prediction of influenza rates by particle filtering
Closas, P., Bugallo, M. F., Coma, E., & Méndez-Boo, L. (2013) · IEEE International Conference on Acoustics Speech and Signal Processing · doi:10.1109/icassp.2013.6637809
Emerging respiratory tract infections 1 Surveillance for emerging respiratory viruses
Zumla, A. I., Gautret, P., Gray, G. C., Hui, D. S. C., & Memish, Z. A. (2014)
Santillana, M., Wendong, D., Althouse, B. M., & Ayers, J. W. (2014)
Assessing Google Correlate Queries for Influenza H1N1 Surveillance in Asian Developing CountriesPreprint
Zhou, X., Li, Q., Zhao, H., Li, S., Yu, L., Tang, F., Hu, S., Li, G., & Feng, Y. (2015) · arXiv (Cornell University) · doi:10.48550/arxiv.1512.03132
Leveraging Microfinance: A Tool to Aid Ground Commanders in Distributing Economic Development FundsPreprint
Faber, I., Gordon, M., George, N., Fisk, C., Parker, L., & Schoenlein, B. (2015) · SSRN Electronic Journal · doi:10.2139/ssrn.2599872
Nowcasting influenza outbreaks using open-source media report.
Ray, J., & Brownstein, J. S. (2013) · doi:10.2172/1093696
Comparison study of SARIMA and ARGO models for in influenza epidemics prediction
Jung, J., & Lee, S. (2016) · Journal of the Korean Data and Information Science Society · doi:10.7465/jkdi.2016.27.4.1075
Stephens, C. R., Rodríguez-Ramírez, R., Mireles, V., Hernández-López, S., Garcia-Aguirre, C., Herrera-Ortiz, J. A., & Mantilla-Beniers, N. B. (2017) · International Conference on Digital Health · doi:10.1145/3079452.3079471
Learning in the context of distribution drift
Webb, G. I. (2017)
Digital traces, sociology and Twitter : between false promises and real potential
Philippe, O. (2016) · ePrints Soton (University of Southampton)
New paradigms of education in the digital environment
Łuszczek, K. (2018) · Studia Koszalińsko-Kołobrzeskie · doi:10.18276/skk.2018.25-10
Detecting Influenza Outbreaks Based on Spatiotemporal Information from Urban Systems
Grottenberg, L. O., Njå, O., Tøssebro, E., Braut, G. S., Bragstad, K., & Grøneng, G. M. (2019) · Lecture notes in geoinformation and cartography · doi:10.1007/978-3-030-05330-7_4
Web data mining for public health purposesPreprint
Hansen, N. D. (2019) · arXiv (Cornell University) · doi:10.48550/arxiv.1905.00829
Resnick, M. (2018) · Digital Commons-TMC (Texas Medical Center)
Public Services and the Missed Values of (Non)Communication
Pečarič, M. (2019) · Advances in finance, accounting, and economics book series · doi:10.4018/978-1-5225-8482-7.ch013
Online mapping and forecasting of epidemics using open-source indicators
Sandia National Laboratories (SNL-CA), ;. C. L., Ray, J., Administration, U. A. S. F. H. R. A., Sandia National Laboratories (SNL), A., Lefantzi, S., Bauer, J. R., Khalil, M., Rothfuss, A., Cauthen, K., Finley, P. D., et al. (2016) · doi:10.2172/1562406
Kang, D. H., Cho, K. S., Ham, W. S., Choi, Y. D., & Lee, J. Y. (2015) · Journal of Urologic Oncology
Detecting Suspected Epidemic Cases Using Trajectory Big Data
sci, G. (2020) · CSIAM Transactions on Applied Mathematics · doi:10.4208/csam.2020-0006
Liu, J., & Xia, S. (2020) · Health information science · doi:10.1007/978-3-030-52109-7_1
Internet Information Monitoring System
Primo, P. P. B., Antunes, M. N., Ramos, M. P., Siqueira, C. E., Oliveira, A. E., & Mendes, J. M. (2020) · Advances in human services and public health (AHSPH) book series · doi:10.4018/978-1-7998-6705-0.ch004
Nguyen-Tran, M.-D., Nguyen-Tran, N.-V., Phuc, N. N. D., Tran, H. L. T., Zayan, A. H., Abdelrahman, A. S. M., Vu, T. T., Nguyen, K. A. L., Nguyen, T., Vo, Y. N. L., et al. (2020) · Research Square · doi:10.21203/rs.3.rs-66084/v1
Social physicsPreprint
Jusup, M., Holme, P., Kanazawa, K., Takayasu, M., Romić, I., Wang, Z., Geček, S., Lipić, T., Boris Podobnik, A., Wang, L., et al. (2021) · arXiv (Cornell University)
Satpathy, P., Kumar, S., & Prasad, P. (2020) · doi:10.2196/preprints.25985
Google, Public Health, and Alcohol and Drug Policy
Ghosh, A., Choudhury, S., & Narasimha, V. L. (2022) · Springer eBooks · doi:10.1007/978-3-030-67928-6_58-1
Influenza Pandemics and the associated Bacterial Infections
Khanna, M., Agrawal, N., Chandra, R., & Dhawan, G. (2017) · Austin Journal of Microbiology · doi:10.26420/austinjmicrobiol.2017.1017
Lacey, K. (2022) · Springer eBooks · doi:10.1007/978-3-319-32010-6_106
Pastor-Escuredo, D. (2020) · Revista Diecisiete Investigación Interdisciplinar para los Objetivos de Desarrollo Sostenible · doi:10.36852/2695-4427_2020_03.07
Secondary Data for Global Health DigitalizationPreprint
Näher, A., Vorisek, C. N., Klopfenstein, S. A. I., Lehne, M., Thun, S., Alsalamah, S., Pujari, S., Heider, D., Ahrens, W., Pigeot, I., et al. (2022) · SSRN Electronic Journal · doi:10.2139/ssrn.4068313
(2014) · Elsevier eBooks · doi:10.1016/b978-1-84334-716-3.50012-9
Weston, D., Bloodworth, N., Amlôt, R., & Rubin, G. J. (2019) · doi:10.2196/preprints.13918
Moorlock, G. (2016) · Springer eBooks · doi:10.1007/978-3-319-09483-0_167
New communication technologies, social media, and public health
Sullivan, P. S., Siegler, A. J., & Hightow‐Weidman, L. (2021) · doi:10.1093/med/9780198816805.003.0025
Wang, H., Wang, F., & Xu, K. (2020) · Sureys and tutorials in the applied mathematical sciences · doi:10.1007/978-3-030-38852-2_8
Searching for the peak: Google Trends and the first COVID-19 wave in Italy
Serlenga, L., Resce, G., & Brunori, P. (2022) · International Journal of Computational Economics and Econometrics · doi:10.1504/ijcee.2022.10047365
Trends In Highly Personalized Health Search: Analysis On Google Search Behaviors
Bizel, G., & SİNGH, K. (2022) · JOURNAL OF SOCIAL HUMANITIES AND ADMINISTRATIVE SCIENCES · doi:10.29228/joshas.62194
Geographic Information Systems Technology
Chan, H. (2022) · The International Encyclopedia of Health Communication · doi:10.1002/9781119678816.iehc0617
Google, Public Health, and Alcohol and Drug Policy
Ghosh, A., Choudhury, S., & Narasimha, V. L. (2022) · Springer eBooks · doi:10.1007/978-3-030-92392-1_58
Searching for the peak: Google Trends and the first COVID-19 wave in Italy
Brunori, P., Resce, G., & Serlenga, L. (2022) · International Journal of Computational Economics and Econometrics · doi:10.1504/ijcee.2022.126323
6th International Conference on Advanced Research Methods and Analytics - CARMA 2024
Conference, C., Domenech, J., Vicente, M. R., & de Pedraza, P. (2024) · doi:10.4995/carma2024.2024.19017
Romero-Alvarez, D., Parikh, N., Osthus, D., Martinez, K. M., Generous, N., del Valle, S., & Manore, C. A. (2020) · Figshare · doi:10.6084/m9.figshare.12051246
Romero-Álvarez, D., Parikh, N., Osthus, D., Martinez, K. M., Generous, N., del Valle, S., & Manore, C. A. (2020) · Figshare · doi:10.6084/m9.figshare.12051255
Romero-Alvarez, D., Parikh, N., Osthus, D., Martinez, K. M., Generous, N., del Valle, S., & Manore, C. A. (2020) · Figshare · doi:10.6084/m9.figshare.12051240
Romero-Alvarez, D., Parikh, N., Osthus, D., Martinez, K. M., Generous, N., del Valle, S., & Manore, C. A. (2020) · Figshare · doi:10.6084/m9.figshare.12051261
Romero-Alvarez, D., Parikh, N., Osthus, D., Martinez, K. M., Generous, N., del Valle, S., & Manore, C. A. (2020) · Figshare · doi:10.6084/m9.figshare.12051279
Romero-Alvarez, D., Parikh, N., Osthus, D., Martinez, K. M., Generous, N., del Valle, S., & Manore, C. A. (2020) · Figshare · doi:10.6084/m9.figshare.12051249
Romero-Alvarez, D., Parikh, N., Osthus, D., Martinez, K. M., Generous, N., del Valle, S., & Manore, C. A. (2020) · Figshare · doi:10.6084/m9.figshare.12051258
Romero-Alvarez, D., Parikh, N., Osthus, D., Martinez, K. M., Generous, N., del Valle, S., & Manore, C. A. (2020) · Figshare · doi:10.6084/m9.figshare.12051288
Cuciniello, R., Ricciardi, G. E., Ancona, A., Napoli, D. D., Din, C. T., Castagna, A., Renzi, C., Rezza, G., Moro, M., & Chiecca, G. (2026) · Annali di Igiene Medicina Preventiva e di Comunità · doi:10.7416/ai.2026.17959
Güner, M. D., Ekmekçi, P. E., Akgok, B., Özsipahi, A., & Demir, G. (2026) · Kırıkkale Üniversitesi Tıp Fakültesi Dergisi · doi:10.24938/kutfd.1757469
U.S. public interest in catfish: Evidence from internet search data
LaFontaine, Q., Garlock, T., Asche, F., & Roy, L. A. (2026) · Aquaculture Reports · doi:10.1016/j.aqrep.2026.103682
The Listening Coefficient: A Diagnostic Framework for Feedback Integrity
Bryan, D. (2026) · Systems Research and Behavioral Science · doi:10.1002/sres.70151
Recommendations for the analysis of leading indicators in epidemic surveillance
Mellor, J., Maria, T., Paton, R. S., & Ward, T. (2026) · PLOS Digital Health · doi:10.1371/journal.pdig.0001759
Perché studiare i social media
Cerón, A., Curini, L., & Iacus, S. M. (2014) · SxI Springer per l'Innovazione · doi:10.1007/978-88-470-5532-2_1
Metadata
- Authors
- Cook, S., Conrad, C., Fowlkes, A. L., & Mohebbi, M. H.
- Affiliations
- Google (United States) (US)
- Google (United Kingdom) (GB)
- Centers for Disease Control and Prevention (US)
- Corresponding author
- Conrad, Corrie
- ORCID
- Fowlkes, Ashley L.
- Venue
- PLoS ONE
- Publisher
- Public Library of Science (PLoS)
- Published
- 2011-08-19
- Volume
- 6
- Issue
- 8
- Pages
- e23610
- ISSN
- 1932-6203 (ISSN-L)
- PMC
- PMC3158788
- OpenAlex
- W1998956117
- Cited by
- 381
- References
- 10
- Citations by year
- 2026: 5 · 2025: 4 · 2024: 7 · 2023: 8 · 2022: 25 · 2021: 33 · 2020: 50 · 2019: 25 · 2018: 26 · 2017: 34 · 2016: 41 · 2015: 48 · 2014: 38 · 2013: 27 · 2012: 9
- FWCI
- 18.08
- Type
- journal article
- Language
- en
- Open access
- gold
- doi.org
- Licence
- Locations
- PLoS ONE (publishedVersion, public-domain)
- Europe PMC (PubMed Central) (publishedVersion, public-domain)
- PubMed Central (publishedVersion, public-domain)
- PubMed (publishedVersion)
- DOAJ (DOAJ: Directory of Open Access Journals) (submittedVersion, cc-by-sa)
- Funders
- Topics
- Health Sciences › Medicine › Epidemiology › Data-Driven Disease Surveillance
- Health Sciences › Medicine › Epidemiology › Influenza Virus Research Studies
- Health Sciences › Medicine › Epidemiology › Respiratory viral infections research
- Keywords
- Google Flu Trends, influenza surveillance, 2009 H1N1 pandemic, influenza-like illness, online search behavior, health-seeking behavior, model accuracy assessment
- MeSH terms
- Humans, Influenza, Human, Models, Biological, Population Surveillance, Time Factors, United States, Influenza A Virus, H1N1 Subtype, Search Engine, Pandemics
About these checks
Registry, retraction, Cites and statistics results are computed, not judged, with one exception: a printed reference that no index lists is read once by a model before it counts as a citation error. Claims are extracted by a model and kept only when their quote appears verbatim in the text; each cited source is then checked, with a model’s help, for whether it says what the claim relies on. Those verdicts can be wrong — read the claim’s quote and the cited source before relying on one.
Statistics and arithmetic are recomputed, not judged.
Confidence bands are shown only for fields calibrated on our annotated test set. None is calibrated yet, so no band is shown.
What counts as a claim ›How we measure confidence ›How we check this ›
Are you an author, or do you see a problem with this page? Request a review
