

The DOI matches its Crossref record; 54 of the 54 references it cites were found in a registry or an index.
Spherical Lactic Acid Bacteria Activate Plasmacytoid Dendritic Cells Immunomodulatory Function via TLR9-Dependent Crosstalk with Myeloid Dendritic Cells
Open accessAbstract
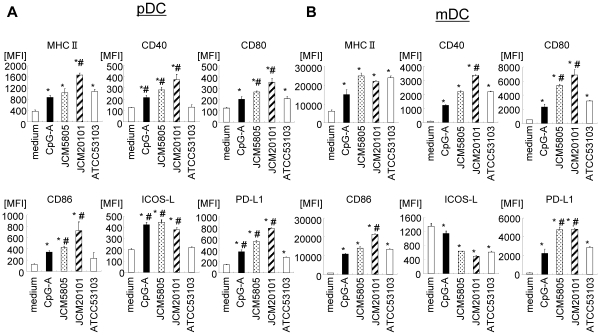
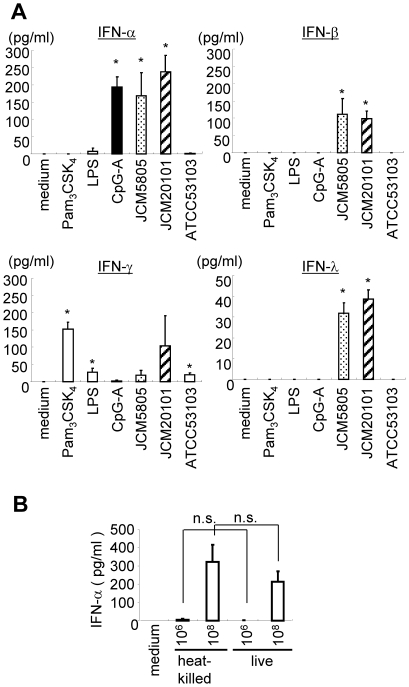
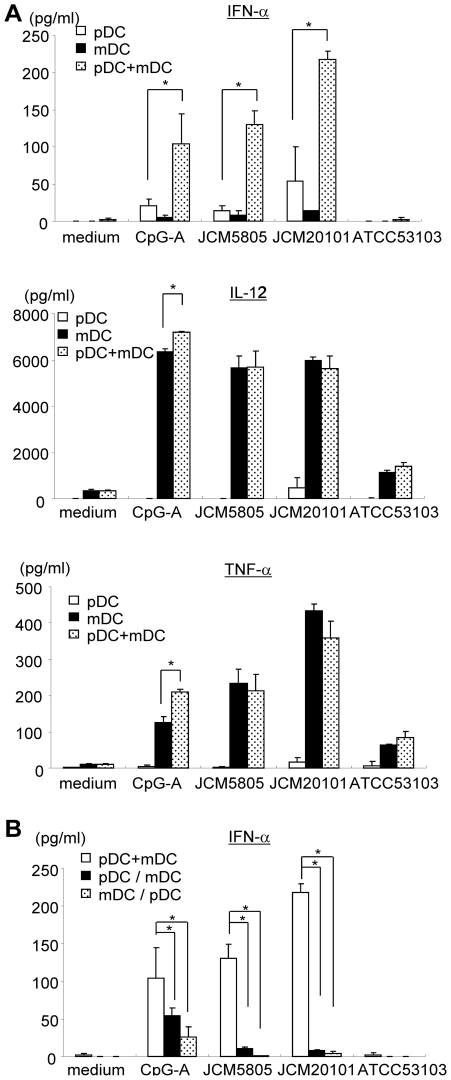
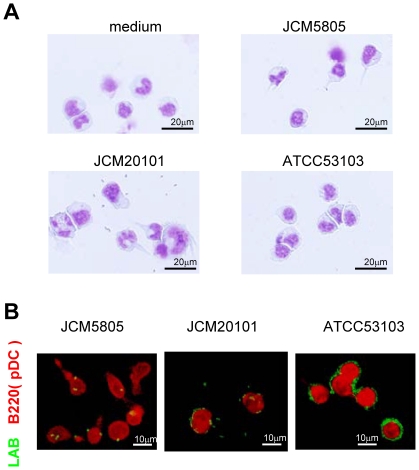
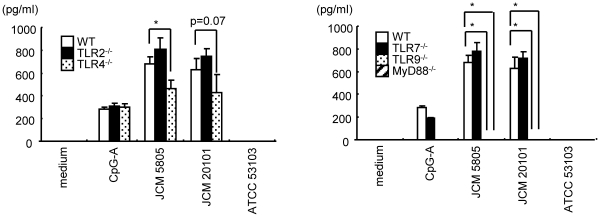
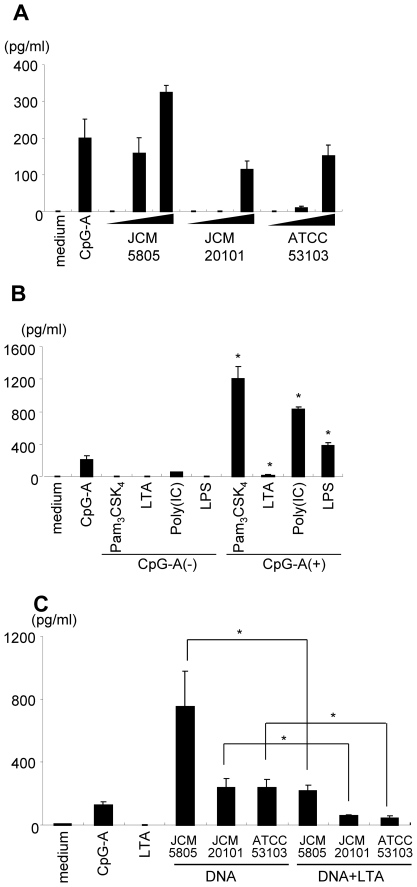
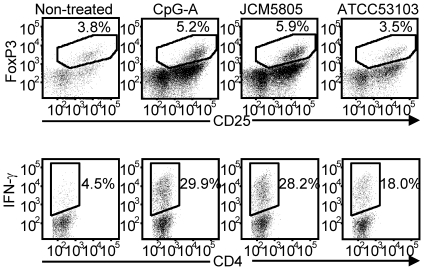
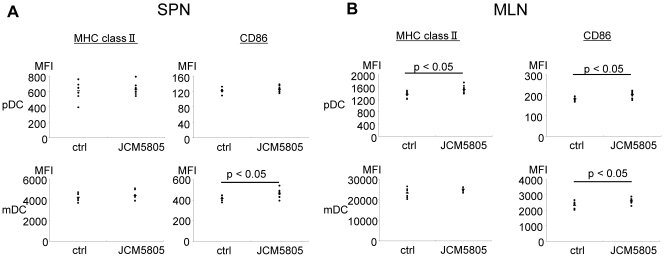
Plasmacytoid dendritic cells (pDC) are a specialized sensor of viral and bacterial nucleic acids and a major producer of IFN-α that promotes host defense by priming both innate and acquired immune responses. Although synthetic Toll-like receptor (TLR) ligands, pathogenic bacteria and viruses activate pDC, there is limited investigation of non-pathogenic microbiota that are in wide industrial dietary use, such as lactic acid bacteria (LAB). In this study, we screened for LAB strains, which induce pDC activation and IFN-α production using murine bone marrow (BM)-derived Flt-3L induced dendritic cell culture. Microbial strains with such activity on pDC were absent in a diversity of bacillary strains, but were observed in certain spherical species (Lactococcus, Leuconostoc, Streptococcus and Pediococcus), which was correlated with their capacity for uptake by pDC. Detailed study of Lactococcus lactis subsp. lactis JCM5805 and JCM20101 revealed that the major type I and type III interferons were induced (IFN-α, -β, and λ). IFN-α induction was TLR9 and MyD88-dependent; a slight impairment was also observed in TLR4(-/-) cells. While these responses occurred with purified pDC, IFN-α production was synergistic upon co-culture with myeloid dendritic cells (mDC), an interaction that required direct mDC-pDC contact. L. lactis strains also stimulated expression of immunoregulatory receptors on pDC (ICOS-L and PD-L1), and accordingly augmented pDC induction of CD4(+)CD25(+)FoxP3(+) Treg compared to the Lactobacillus strain. Oral administration of L. lactis JCM5805 induced significant activation of pDC resident in the intestinal draining mesenteric lymph nodes, but not in a remote lymphoid site (spleen). Taken together, certain non-pathogenic spherical LAB in wide dietary use has potent and diverse immunomodulatory effects on pDC potentially relevant to anti-viral immunity and chronic inflammatory disease.
Overview
The claims and statistics of this paper haven’t been checked yet.
Run the check — free, no account needed. It reads the open-access text and checks the sources it cites.
Integrity signals
Registry
Cites
Statistics
Figures
Verification
Claims the paper makes
The claims and statistics of this paper haven’t been checked yet.
Run the check — free, no account needed. It reads the open-access text and checks the sources it cites.
Claims other papers make about this one
Each is checked against this paper’s own text: does it say what the citing paper says it does?
In the citing paper
“phagocytosis of the strain Lactococcus lactis JCM 5805 by pDCs significantly stimulated IFN production via TLR9/MyD88 signaling (Jounai et al., 2012).”
From Viral Infections, the Microbiome, and Probiotics (2021) · cites this paper as Jounai et al., 2012
Self-check
Percentages, sums and reported differences re-computed from the paper’s own numbers.
The self-check needs the paper’s full text.
Citations
Cites
Probiotics in primary prevention of atopic disease: a randomised placebo-controlled trial
Kalliomäki, M. A., Salminen, S., Arvilommi, H. S., Kero, P. O., Koskinen, P. J., & Isolauri, E. (2001) · The Lancet · doi:10.1016/s0140-6736(00)04259-8 · Cited by 2,443
Interferon-inducible antiviral effectors
Sadler, A. J., & Williams, B. R. G. (2008) · Nature Reviews Immunology · doi:10.1038/nri2314 · Cited by 2,160
Recognition of single-stranded RNA viruses by Toll-like receptor 7
Lund, J. M., Alexopoulou, L., Sato, A., Karow, M. L., Adams, N. C., Gale, N. W., Iwasaki, A., & Flavell, R. A. (2004) · Proceedings of the National Academy of Sciences · doi:10.1073/pnas.0400937101 · Cited by 1,918
IFN-λs mediate antiviral protection through a distinct class II cytokine receptor complex
Kotenko, S. V., Gallagher, G. E., Baurin, V. V., Lewis-Antes, A., Shen, M., Shah, N. K., Langer, J. A., Sheikh, F. G., Dickensheets, H. L., & Donnelly, R. P. (2002) · Nature Immunology · doi:10.1038/ni875 · Cited by 1,867
Kalliomäki, M. A., Salminen, S., Poussa, T. A., Arvilommi, H. S., & Isolauri, E. (2003) · The Lancet · doi:10.1016/s0140-6736(03)13490-3 · Cited by 1,340
Jego, G., Palucka, A. K., Blanck, J.-P., Chalouni, C., Pascual, V., & Banchereau, J. (2003) · Immunity · doi:10.1016/s1074-7613(03)00208-5 · Cited by 1,067
Mouse type I IFN-producing cells are immature APCs with plasmacytoid morphology
Asselin‐Paturel, C., Boonstra, A., Dalod, M., Durand, I., Yessaad, N., Dezutter‐Dambuyant, C., Vicari, A. P., O’Garra, A., Biron, C. A., Brière, F., et al. (2001) · Nature Immunology · doi:10.1038/ni736 · Cited by 1,021
Bon, A. L., Schiavoni, G., D’Agostino, G., Gresser, I., Belardelli, F., & Tough, D. F. (2001) · Immunity · doi:10.1016/s1074-7613(01)00126-1 · Cited by 973
Type I Interferon in Systemic Lupus Erythematosus and Other Autoimmune Diseases
Banchereau, J., & Pascual, V. (2006) · Immunity · doi:10.1016/j.immuni.2006.08.010 · Cited by 955
Cross-priming of CD8+ T cells stimulated by virus-induced type I interferon
Bon, A. L., Etchart, N., Rossmann, C., Ashton, M., Hou, S., Gewert, D. R., Borrow, P., & Tough, D. F. (2003) · Nature Immunology · doi:10.1038/ni978 · Cited by 816
Research works printed but not linked: 1
- H Kitazawa, 1994, Expression of mRNA encoding IFN α in macrophages stimulated with Lactobacillus gasseri., FEMS Microbiol Lett, 120, 315
Cited by
Sorted by citations
Role of gut microbiota and Toll-like receptors in nonalcoholic fatty liver disease
Miura, K. (2014) · World Journal of Gastroenterology · doi:10.3748/wjg.v20.i23.7381 · Cited by 355
Emerging roles of lactic acid bacteria in protection against colorectal cancer
Zhong, L. (2014) · World Journal of Gastroenterology · doi:10.3748/wjg.v20.i24.7878 · Cited by 261
Xia, Y. L., Lu, M., Chen, G., Cao, J., Gao, F., Wang, M., Liu, Z., Zhang, D., Zhu, H., & Yi, M. (2018) · Fish & Shellfish Immunology · doi:10.1016/j.fsi.2018.03.020 · Cited by 249
Beck, B. R., Kim, D., Jeon, J., Lee, S.-M., Kim, H. K., Kim, O.-J., Lee, J. I., Suh, B. S., Do, H. K., Lee, K. H., et al. (2014) · Fish & Shellfish Immunology · doi:10.1016/j.fsi.2014.10.035 · Cited by 197
Viral Infections, the Microbiome, and Probiotics
Harper, A., Vijayakumar, V., Ouwehand, A. C., ter Haar, J., Obis, D., Espadaler, J., Binda, S., Desiraju, S., & Day, R. (2021) · Frontiers in Cellular and Infection Microbiology · doi:10.3389/fcimb.2020.596166 · Cited by 177
Kanauchi, O., Andoh, A., AbuBakar, S., & Yamamoto, N. (2018) · Current Pharmaceutical Design · doi:10.2174/1381612824666180116163411 · Cited by 168
The Role of Gut Dysbiosis in the Loss of Intestinal Immune Cell Functions and Viral Pathogenesis
Fakharian, F., Thirugnanam, S., Welsh, D. A., Kim, W., Rappaport, J., Bittinger, K. L., & Rout, N. (2023) · Microorganisms · doi:10.3390/microorganisms11071849 · Cited by 107
Yamamoto, M. L., Maier, I., Dang, A. T., Berry, D., Liu, J., Ruegger, P. M., Yang, J.-I., Soto, P. A., Presley, L. L., Reliene, R., et al. (2013) · Cancer Research · doi:10.1158/0008-5472.can-13-0022 · Cited by 93
Self-citationSugimura, T., Takahashi, H., Jounai, K., Ohshio, K., Kanayama, M., Tazumi, K., Tanihata, Y., Miura, Y., Fujiwara, D., & Yamamoto, N. (2015) · British Journal Of Nutrition · doi:10.1017/s0007114515002408 · Cited by 93
Self-citationSurfacing role of probiotics in cancer prophylaxis and therapy: A systematic review
Dasari, S., Kathera, C., Janardhan, A., Kumar, A. P., & Viswanath, B. (2016) · Clinical Nutrition · doi:10.1016/j.clnu.2016.11.017 · Cited by 90
Immunomodulatory effect of Lactococcus lactis JCM5805 on human plasmacytoid dendritic cells
Sugimura, T., Jounai, K., Ohshio, K., Tanaka, T., Suwa, M., & Fujiwara, D. (2013) · Clinical Immunology · doi:10.1016/j.clim.2013.10.007 · Cited by 82
Self-citationSerena, G., Yan, S., Camhi, S. S., Patel, S., Lima, R. S., Sapone, A., Leonard, M. M., Mukherjee, R., Nath, B. J., Lammers, K. M., et al. (2016) · Clinical & Experimental Immunology · doi:10.1111/cei.12911 · Cited by 74
Komano, Y., Shimada, K., Naito, H., Fukao, K., Ishihara, Y., Fujii, T., Kokubo, T., & Daida, H. (2018) · Journal of the International Society of Sports Nutrition · doi:10.1186/s12970-018-0244-9 · Cited by 73
Hasan, M. T., Jang, W. J., Lee, J. M., Lee, B., Hur, S. W., Lim, S. G., Kim, K., Han, H., & Kong, I. (2019) · Reviews in Fisheries Science & Aquaculture · doi:10.1080/23308249.2019.1622510 · Cited by 73
Thordardottir, S., Hangalapura, B. N., Hutten, T. J. A., Cossu, M., Spanholtz, J., Schaap, N. P., Radstake, T. R. D. J., van der Voort, R., & Dolstra, H. (2013) · Stem Cells and Development · doi:10.1089/scd.2013.0521 · Cited by 68
Jounai, K., Sugimura, T., Ohshio, K., & Fujiwara, D. (2015) · PLoS ONE · doi:10.1371/journal.pone.0119055 · Cited by 62
Self-citationNeisseria gonorrhoeae Suppresses Dendritic Cell-Induced, Antigen-Dependent CD4 T Cell Proliferation
Zhu, W., Ventevogel, M. S., Knilans, K. J., Anderson, J. E., Oldach, L., McKinnon, K. P., Hobbs, M. M., Sempowski, G. D., & Duncan, J. A. (2012) · PLoS ONE · doi:10.1371/journal.pone.0041260 · Cited by 55
Xia, Y. L., Cao, J., Wang, M., Lu, M., Chen, G., Gao, F., Liu, Z., Zhang, D., Ke, X., & Yi, M. (2018) · Fish & Shellfish Immunology · doi:10.1016/j.fsi.2018.11.022 · Cited by 52
Neisseria gonorrhoeae Modulates Immunity by Polarizing Human Macrophages to a M2 Profile
Ortiz, M. C., Lefimil, C., Rodas, P. I., Vernal, R., López, M. N., Acuña‐Castillo, C., Imarai, M., & Escobar, A. F. (2015) · PLoS ONE · doi:10.1371/journal.pone.0130713 · Cited by 47
Choi, H., Lee, N., & Paik, H. (2015) · Food Science and Biotechnology · doi:10.1007/s10068-015-0102-3 · Cited by 49
Food-producing animals and their health in relation to human health
Téllez‐Isaías, G., Lauková, A., Latorre, J. D., Hernández-Velasco, X., Hargis, B. M., & Callaway, T. R. (2015) · Microbial Ecology in Health and Disease · doi:10.3402/mehd.v26.25876 · Cited by 46
Shibata, T., Kanayama, M., Haida, M., Fujimoto, S., Oroguchi, T., Sata, K., Mita, N., Kutsuzawa, T., Ikeuchi, M., Kondo, M., et al. (2016) · Journal of Functional Foods · doi:10.1016/j.jff.2016.03.035 · Cited by 46
DNA Transfer and Toll-like Receptor Modulation by Helicobacter pylori
Varga, M. G., & Peek, R. M. (2017) · Current topics in microbiology and immunology · doi:10.1007/978-3-319-50520-6_8 · Cited by 41
Nishida, S., Ono, Y., & Sekimizu, K. (2016) · Drug Discoveries & Therapeutics · doi:10.5582/ddt.2016.01022 · Cited by 38
Kawano, M., Miyoshi, M., & Miyazaki, T. (2019) · Frontiers in Immunology · doi:10.3389/fimmu.2019.00845 · Cited by 41
Adjuvant Strategies for Lactic Acid Bacterial Mucosal Vaccines
Vilander, A. C., & Dean, G. A. (2019) · Vaccines · doi:10.3390/vaccines7040150 · Cited by 40
The Role of Mucosal Immunity and Recombinant Probiotics in SARS-CoV2 Vaccine Development
Moradi‐Kalbolandi, S., Majidzadeh‐A, K., Abdolvahab, M. H., Jalili, N., & Farahmand, L. (2021) · Probiotics and Antimicrobial Proteins · doi:10.1007/s12602-021-09773-9 · Cited by 35
Stanisavljević, S., Lukić, J., Momčilović, M. B., Miljković, M., Jevtić, B., Kojić, M., Golić, N., Stojković, M. M., & Miljković, D. M. (2016) · Beneficial Microbes · doi:10.3920/bm2015.0159 · Cited by 34
Fujii, T., Jounai, K., Horie, A., Takahashi, H., Suzuki, H., Ohshio, K., Fujiwara, D., & Yamamoto, N. (2017) · Journal of Functional Foods · doi:10.1016/j.jff.2017.06.011 · Cited by 33
Self-citationUmbilical cord blood–derived cellular products for cancer immunotherapy
Cany, J., Dolstra, H., & Shah, N. D. (2015) · Cytotherapy · doi:10.1016/j.jcyt.2015.03.005 · Cited by 32
Kim, S., Lee, S., Kim, T.-Y., Lee, S.-H., Seo, S., & Kweon, M. (2023) · Microbiome · doi:10.1186/s40168-023-01687-8 · Cited by 32
Suzuki, T., Nishiyama, K., Kawata, K., Sugimoto, K., Isome, M., Suzuki, S., Nozawa, R., Ichikawa, Y., Watanabe, Y., & Suzutani, T. (2020) · Nutrients · doi:10.3390/nu12030763 · Cited by 30
Samani, M. N., Soltani, M., Dadar, M., Mirghaed, A. T., Zargar, A., Ahmadivand, S., Hassanzadeh, R., & Goudarzi, L. M. (2020) · Fish & Shellfish Immunology · doi:10.1016/j.fsi.2020.07.007 · Cited by 30
Kim, D., Beck, B. R., Lee, S. M., Jeon, J., Lee, D. W., Lee, J. I., & Song, S. K. (2016) · Fish & Shellfish Immunology · doi:10.1016/j.fsi.2016.06.010 · Cited by 29
Yang, Y., Latorre, J. D., Khatri, B., Kwon, Y. M., Kong, B. ‐., Teague, K. D., Graham, D. B., Wolfenden, A. D., Mahaffey, B. D., Baxter, M. F. A., et al. (2017) · Poultry Science · doi:10.3382/ps/pex311 · Cited by 26
Probiotics as a biotherapeutics for the management and prevention of respiratory tract diseases
Debnath, N., Kumar, A., & Yadav, A. K. (2022) · Microbiology and Immunology · doi:10.1111/1348-0421.12980 · Cited by 28
Correlation between Type I Interferon Associated Factors and COVID-19 Severity
Bencze, D., Fekete, T., & Pázmándi, K. (2022) · International Journal of Molecular Sciences · doi:10.3390/ijms231810968 · Cited by 25
Virus Infection Is an Instigator of Intestinal Dysbiosis Leading to Type 1 Diabetes
Morse, Z. J., & Horwitz, M. S. (2021) · Frontiers in Immunology · doi:10.3389/fimmu.2021.751337 · Cited by 22
Tsuji, R., Komano, Y., Ohshio, K., Ishii, N., & Kanauchi, O. (2018) · Experimental Gerontology · doi:10.1016/j.exger.2018.06.028 · Cited by 20
Lactococcus lactissubsp. lactisJCM 5805 activates natural killer cells via dendritic cells
Suzuki, H., Ohshio, K., & Fujiwara, D. (2015) · Bioscience Biotechnology and Biochemistry · doi:10.1080/09168451.2015.1116922 · Cited by 20
Self-citationTomkinson, S., Triscott, C., Schenk, E., & Foey, A. (2023) · Pathogens · doi:10.3390/pathogens12070928 · Cited by 24
Microbial pathogenesis and type III interferons
Cohen, T. S., & Parker, D. (2016) · Cytokine & Growth Factor Reviews · doi:10.1016/j.cytogfr.2016.02.005 · Cited by 21
Komaki, S., Haque, A., Miyazaki, H., Matsumoto, T., & Nakamura, S. (2020) · Journal of Infection and Chemotherapy · doi:10.1016/j.jiac.2020.01.006 · Cited by 18
Role of probiotics in the management of cervical cancer: An update
Kandati, K., Belagal, P., Nannepaga, J. S., & Viswanath, B. (2022) · Clinical Nutrition ESPEN · doi:10.1016/j.clnesp.2022.02.017 · Cited by 19
Lukić, J., Jančić, I., Mirković, N., Bufan, B., Djokić, J., Milenković, M., Begović, J., Strahinić, I., & Lozo, J. (2017) · Beneficial Microbes · doi:10.3920/bm2017.0007 · Cited by 18
Ditengou, J. I. C. P., Ahn, S., Chae, B., & Choi, N. (2023) · Journal of Applied Microbiology · doi:10.1093/jambio/lxad008 · Cited by 17
Overview of anti-viral effects of probiotics via immune cells in pre-, mid- and post-SARS-CoV2 era
Kanauchi, O., Low, Z. X., Jounai, K., Tsuji, R. F., & AbuBakar, S. (2023) · Frontiers in Immunology · doi:10.3389/fimmu.2023.1280680 · Cited by 21
Self-citationJounai, K., Sugimura, T., Morita, Y., Ohshio, K., & Fujiwara, D. (2018) · International Immunopharmacology · doi:10.1016/j.intimp.2018.01.034 · Cited by 16
Self-citationSugimura, T., Jounai, K., Ohshio, K., Suzuki, H., Kirisako, T., Sugihara, Y., & Fujiwara, D. (2018) · International Immunopharmacology · doi:10.1016/j.intimp.2018.03.024 · Cited by 16
Self-citationProbiotic supplementation: A prospective approach in the treatment of COVID-19
Nayebi, A., Navashenaq, J. G., Soleimani, D., & Nachvak, S. M. (2021) · Nutrition and Health · doi:10.1177/02601060211049631 · Cited by 18
Prokaryotes Versus Eukaryotes: Who is Hosting Whom?
Téllez‐Isaías, G. (2014) · Frontiers in Veterinary Science · doi:10.3389/fvets.2014.00003 · Cited by 15
Suzuki, H., Jounai, K., Ohshio, K., Fujii, T., & Fujiwara, D. (2018) · Biochemical and Biophysical Research Communications · doi:10.1016/j.bbrc.2018.07.042 · Cited by 14
Self-citationHorie, A., Tomita, Y., Ohshio, K., Fujiwara, D., & Fujii, T. (2019) · BMC Microbiology · doi:10.1186/s12866-019-1458-y · Cited by 13
Self-citationRoles of Plasmacytoid Dendritic Cells in Gastric Cancer
Yang, J., Liu, X., Cheng, Y., Zhang, J., Ji, F., & Ling, Z. (2022) · Frontiers in Oncology · doi:10.3389/fonc.2022.818314 · Cited by 12
Roles and Effects of Interferon Lambda Signaling in the Context of Bacterial Infections
Johnson, D., & Carbonetti, N. H. (2023) · Journal of Interferon & Cytokine Research · doi:10.1089/jir.2023.0037 · Cited by 14
Tsuji, R. F., Yamamoto, N., Yamada, S., Fujii, T., Yamamoto, N., & Kanauchi, O. (2018) · Antiviral Research · doi:10.1016/j.antiviral.2018.10.020 · Cited by 13
Li, Y., Aoki, T., Iwabuchi, S., Arai, S., Iwabuchi, N., Motobayashi, H., Tanaka, M., & Hashimoto, S. (2024) · Food Science & Nutrition · doi:10.1002/fsn3.4009 · Cited by 13
Delgado, R., Latorre, J. D., Vicuña, E. A., Hernández-Velasco, X., Vicente, J. L., Menconi, A., Kallapura, G., Layton, S. L., Hargis, B. M., & Téllez, G. (2014) · Poultry Science · doi:10.3382/ps.2014-03927 · Cited by 12
Overview of Anticancer activity of Lactic Acid bacteria
Delesa, D. A., Jimma, & Ethiopia, P. O. B. 3. (2017) · International Journal of Advanced Research in Biological Sciences (IJARBS) · doi:10.22192/ijarbs.2017.04.12.017 · Cited by 12
Komano, Y., Fukao, K., Shimada, K., Naıto, H., Ishihara, Y., Fujii, T., Kokubo, T., & Daida, H. (2023) · Nutrients · doi:10.3390/nu15071754 · Cited by 11
Aida, M., Togawa, N., Mizuyama, K., Aoki, Y., Suehiro, S., Sakamoto, A., Uchida, N., & Yamada, R. (2024) · Frontiers in Immunology · doi:10.3389/fimmu.2024.1389920 · Cited by 13
Kanayama, M., Kato, Y. H., Tsuji, T., Konoeda, Y., Hashimoto, A. S., Kanauchi, O., Fujii, T., & Fujiwara, D. (2018) · Scientific Reports · doi:10.1038/s41598-018-21527-2 · Cited by 11
Self-citationSuzuki, H., Tsuji, R. F., Sugamata, M., Yamamoto, N., Yamamoto, N., & Kanauchi, O. (2018) · International Journal of Molecular Medicine · doi:10.3892/ijmm.2018.3955 · Cited by 11
Kokubo, T., Komano, Y., Tsuji, R. F., Fujiwara, D., Fujii, T., & Kanauchi, O. (2019) · International Journal of Sport Nutrition and Exercise Metabolism · doi:10.1123/ijsnem.2018-0377 · Cited by 11
Self-citationWada, H., Mawatari, T., Saito, Y., Azuma, N., & Iwama, Y. (2024) · Nutrients · doi:10.3390/nu17010101 · Cited by 10
Induction of ALDH Activity in Intestinal Dendritic Cells byLactobacillus plantarumNRIC0380
Yoshida, T., Enomoto, M., Nakayama, S., ADACHI, Y., Fujiwara, W., SUGIYAMA, H., Shimojoh, M., Okada, S., & Hattori, M. (2013) · Bioscience Biotechnology and Biochemistry · doi:10.1271/bbb.130144 · Cited by 10
Sakata, K., Sasaki, Y., Jounai, K., Fujii, T., & Fujiwara, D. (2017) · Health · doi:10.4236/health.2017.94054 · Cited by 10
Self-citationKhor, C., Tsuji, R. F., Lee, H. Y., Nor’e, S.-S., Sahimin, N., Azman, A. S., Tiong, V., Hassandarvish, P., Teoh, B., Soh, Y. H., et al. (2021) · Nutrients · doi:10.3390/nu13124507 · Cited by 9
Tsuji, R. F., Fujii, T., Nakamura, Y., Yazawa, K., & Kanauchi, O. (2019) · The Journal of Infectious Diseases · doi:10.1093/infdis/jiz204 · Cited by 8
Amyloid β-induced Mesenteric Inflammation in an Alzheimer’s Disease Transgenic Mouse Model
Ano, Y., Ikado, K., Uchida, K., & Nakayama, H. (2020) · Current Alzheimer Research · doi:10.2174/1567205017666200212160343 · Cited by 8
Self-citationSugimoto, A., Numaguchi, T., Chihama, R., Takenaka, Y., & Sato, Y. (2023) · PLoS ONE · doi:10.1371/journal.pone.0273604 · Cited by 8
Kobatake, E., Iwama, Y., Arai, T., Tsukisaka, Y., & Kabuki, T. (2023) · Nutrients · doi:10.3390/nu15204458 · Cited by 8
Abbaszadeh, S. H., Hosseini, S. R. A., Mahmoodpoor, A., Yousefi, M., Lotfi‐Dizaji, L., & Ebrahimi‐Mameghani, M. (2024) · Indian Journal of Microbiology · doi:10.1007/s12088-024-01421-4 · Cited by 7
He, S., Lu, S., Yang, T., Ma, H., He, Y., Mi, J., Yue, K., Huang, Y., Song, L., Xiao, Y., et al. (2025) · Cell Communication and Signaling · doi:10.1186/s12964-025-02384-9 · Cited by 9
Perkins, J. B., Ravi, K., Guo, C., Oh, G. J., Rodriguez, B. G., Chen, C.-N., Jansons, S. I., Sun, F. C. S., Gurczynski, S. J., Weinberg, J. B., et al. (2026) · Science Advances · doi:10.1126/sciadv.adw4654 · Cited by 7
Kokubo, T., Wakai, S., Fujiwara, D., Kanauchi, O., Jounai, K., Ichikawa, H., Takuma, M., Kanaya, Y., & Shiraoka, R. (2020) · Preventive Nutrition and Food Science · doi:10.3746/pnf.2020.25.2.140 · Cited by 6
Self-citationAssessment the of Anti-Obesity Effects and Safety of Lactobacillus paracasei AO356
Lee, S., Shin, D., Kim, S. Y., Eom, J.-E., Nam, Y., Shin, H.-S., Kim, J., & Woo, Y.-H. (2021) · Journal of the Korean Society of Food Science and Nutrition · doi:10.3746/jkfn.2021.50.9.904 · Cited by 6
Shigemori, S., Namai, F., Ogita, T., Sato, T., & Shimosato, T. (2020) · Animal Science Journal · doi:10.1111/asj.13468 · Cited by 6
Kobatake, E., & Arai, T. (2025) · Microorganisms · doi:10.3390/microorganisms13071440 · Cited by 5
Nakagawa, R., Gu, W., Mizobuchi, H., Kodera, S., Takano, T., Wang, Y., Fujioka, I., Uchida, K., Nakajima‐Adachi, H., & Hachimura, S. (2024) · Frontiers in Immunology · doi:10.3389/fimmu.2024.1395380 · Cited by 5
Fujii, T., Tomita, Y., Ikushima, S., Horie, A., & Fujiwara, D. (2015) · Genome Announcements · doi:10.1128/genomea.00113-15 · Cited by 5
Self-citationAshigai, H., Komano, Y., Wang, G., Kawachi, Y., Sunaga, K., YAMAMOTO, R., Takata, R., Miyake, M., & Yanai, T. (2017) · Bioscience of Microbiota Food and Health · doi:10.12938/bmfh.16-029 · Cited by 5
Immunomodulatory Factor of Lactobacillus Acidophilus in Pathogenesis of Chronic HCV
El-Gaaly, S. A. A., Radwan, H. H., & Attiha, M. Y. (2016) · The Egyptian Journal of Hospital Medicine · doi:10.12816/0023851 · Cited by 5
Fujii, T., Fujitomo, T., Tsuji, R. F., Kubo, R., Kato, Y. H., & Kanauchi, O. (2021) · Microorganisms · doi:10.3390/microorganisms9102029 · Cited by 4
Low, Z. X., Kanauchi, O., Tiong, V., Sahimin, N., Lani, R., Tsuji, R. F., AbuBakar, S., & Hassandarvish, P. (2024) · Microorganisms · doi:10.3390/microorganisms12112304 · Cited by 4
Nakase, J., Ukawa, Y., Takemoto, S., Kubo, T., Sagesaka, Y. M., AOKI-YOSHIDA, A., & Totsuka, M. (2017) · Bioscience Biotechnology and Biochemistry · doi:10.1080/09168451.2017.1295799 · Cited by 4
Ishii, H., Terahara, K., Nomura, T., Okazaki, M., Yamamoto, H., Shu, T., Sakawaki, H., Miura, T., Watkins, D. I., & Matano, T. (2022) · Molecular Therapy · doi:10.1016/j.ymthe.2022.02.023 · Cited by 4
P, P. C. (2020) · Tropical Journal of Pharmaceutical and Life Sciences · doi:10.61280/tjpls.v7i2.37 · Cited by 4
Tsuji, R. F., Yazawa, K., Kokubo, T., Nakamura, Y., & Kanauchi, O. (2021) · Microorganisms · doi:10.3390/microorganisms9030563 · Cited by 4
Fujimura, S., Kawamura, M., & Tamura, Y. (2025) · Microorganisms · doi:10.3390/microorganisms13102261 · Cited by 3
Kato, Y. H., Kobayashi, K., Kuramochi, Y., Miyata, T., Ushida, Y., & Hayamizu, K. (2025) · Frontiers in Immunology · doi:10.3389/fimmu.2025.1696989 · Cited by 3
Thu, N. N., Tuyết, T., Trang, T. T. T., Tuấn, N. A., Quyen, T. C., Hanh, N. L., Hoan, N. H., Lan, B. T. H., Hau, P. T., Tue, H. H., et al. (2022) · Nutrients · doi:10.3390/nu14030552 · Cited by 3
Yamamoto, K., Hosogaya, N., Inoue, T., Jounai, K., Tsuji, R. F., Fujiwara, D., Yanagihara, K., Izumikawa, K., & Mukae, H. (2022) · BMJ Open · doi:10.1136/bmjopen-2022-061172 · Cited by 3
Self-citationIshii, H., Jounai, K., Tsuji, R. F., Ohshio, K., Kaneda, D., Okazaki, M., Harada, S., Fujiwara, D., & Matano, T. (2023) · Biochemical and Biophysical Research Communications · doi:10.1016/j.bbrc.2023.04.046 · Cited by 3
Self-citationMakioka‐Itaya, Y., Inoüe, R., & Tsukahara, T. (2024) · Nutrients · doi:10.3390/nu16132031 · Cited by 3
Non-random Lymphocyte Distribution Among Virus-Infected Cells of the Respiratory Tract
Rudraraju, R., Sealy, R. E., Surman, S. L., Thomas, P. G., Dayton, B. H., & Hurwitz, J. L. (2013) · Viral Immunology · doi:10.1089/vim.2013.0033 · Cited by 3
Satomi, S., Kokubu, D., Inoue, T., Sugiyama, M., Mizokami, M., Suzuki, S., & Murata, K. (2022) · Microorganisms · doi:10.3390/microorganisms10040827 · Cited by 3
Interactions of Probiotics with the Immune Cells of Patients with COVID-19 Pneumonia
Mitrou, I., Dimοpoulos, G., Dakou, K., Koufargyris, P., Damoraki, G., Gkavogianni, T., & Giamarellos‐Bourboulis, E. J. (2025) · Journal of Innate Immunity · doi:10.1159/000545873 · Cited by 2
Yamamoto, K., Inoue, T., Ikeda, T., Sawai, T., Nagayoshi, Y., Hashiguchi, K., Futsuki, Y., Matsubara, Y., Harada, Y., Ashizawa, N., et al. (2025) · Infectious Diseases and Therapy · doi:10.1007/s40121-025-01246-8 · Cited by 2
Self-citationZhu, Z., Xu, Y.-M., Tang, P.-Q., Luo, W.-L., Yang, W.-F., Wu, S., Liu, M., Huang, X.-H., Huang, Y.-H., Sun, H.-Y., et al. (2026) · Aquaculture · doi:10.1016/j.aquaculture.2026.744060 · Cited by 2
Metadata
- Authors
- Jounai, K., Ikado, K., Sugimura, T., Ano, Y., Braun, J., & Fujiwara, D.
- Affiliations
- Kirin (Japan) (JP)
- University of California, Los Angeles (US)
- Corresponding author
- Fujiwara, Daisuke
- Venue
- PLoS ONE
- Publisher
- Public Library of Science (PLoS)
- Published
- 2012-04-10
- Volume
- 7
- Issue
- 4
- Pages
- e32588
- ISSN
- 1932-6203 (ISSN-L)
- PMC
- PMC3323594
- OpenAlex
- W2062007417
- Cited by
- 133
- References
- 54
- Citations by year
- 2026: 9 · 2025: 10 · 2024: 12 · 2023: 15 · 2022: 11 · 2021: 11 · 2020: 7 · 2019: 7 · 2018: 12 · 2017: 9 · 2016: 8 · 2015: 10 · 2014: 5 · 2013: 6 · 2012: 1
- FWCI
- 3.07
- Type
- journal article
- Language
- en
- Open access
- gold
- doi.org
- Locations
- PLoS ONE (publishedVersion, cc-by)
- Europe PMC (PubMed Central) (publishedVersion, cc-by)
- PubMed Central (publishedVersion, cc-by)
- PubMed (publishedVersion)
- DOAJ (DOAJ: Directory of Open Access Journals) (submittedVersion)
- Figshare (submittedVersion, cc-by)
- Funders
- National Institutes of Health (1ul1rr033176-01, UL1TR000124)
- National Institute of Allergy and Infectious Diseases (R01AI078885)
- National Center for Research Resources (UL1-RR-033176)
- National Center for Advancing Translational Sciences
- Topics
- Life Sciences › Immunology and Microbiology › Immunology › Immune Response and Inflammation
- Life Sciences › Agricultural and Biological Sciences › Food Science › Probiotics and Fermented Foods
- Life Sciences › Immunology and Microbiology › Immunology › Immunotherapy and Immune Responses
- Keywords
- lactic acid bacteria, plasmacytoid dendritic cells, myeloid dendritic cells, TLR9, MyD88, interferon-alpha, Lactococcus lactis, type I interferon, interferon lambda, TLR4, ICOSL, PD-L1, regulatory T cells, oral administration, mesenteric lymph nodes, immunomodulation, probiotics, antiviral immunity
- MeSH terms
- Animals, Bone Marrow, Cell Communication, Cells, Cultured, Dendritic Cells, Female, Immunologic Factors, Leuconostoc, Mice, Inbred C57BL, Pediococcus, Streptococcus, Lactococcus lactis, Interferon-alpha, Coculture Techniques, Lactic Acid, Myeloid Cells, T-Lymphocytes, Regulatory, Toll-Like Receptor 9, Mice, Myeloid Differentiation Factor 88
About these checks
Registry, retraction, Cites and statistics results are computed, not judged, with one exception: a printed reference that no index lists is read once by a model before it counts as a citation error. Claims are extracted by a model and kept only when their quote appears verbatim in the text; each cited source is then checked, with a model’s help, for whether it says what the claim relies on. Those verdicts can be wrong — read the claim’s quote and the cited source before relying on one.
Statistics and arithmetic are recomputed, not judged.
Confidence bands are shown only for fields calibrated on our annotated test set. None is calibrated yet, so no band is shown.
What counts as a claim ›How we measure confidence ›How we check this ›
Are you an author, or do you see a problem with this page? Request a review
