Cited by 270Parkinson's Disease Mechanisms and TreatmentsAlzheimer's disease research and treatmentsNeuroinflammation and Neurodegeneration Mechanisms

The DOI matches its Crossref record; 45 of the 45 references it cites were found in a registry or an index.

Alpha-Synuclein Cell-to-Cell Transfer and Seeding in Grafted Dopaminergic Neurons In Vivo

Open access
Angot, Elodie, Steiner, Jennifer A., Lema Tomé, Carla M., Ekström, Peter, Mattsson, Bengt, Björklund, Anders, Brundin, Patrik·2012·PLoS ONE

Abstract

Several people with Parkinson's disease have been treated with intrastriatal grafts of fetal dopaminergic neurons. Following autopsy, 10-22 years after surgery, some of the grafted neurons contained Lewy bodies similar to those observed in the host brain. Numerous studies have attempted to explain these findings in cell and animal models. In cell culture, α-synuclein has been found to transfer from one cell to another, via mechanisms that include exosomal transport and endocytosis, and in certain cases seed aggregation in the recipient cell. In animal models, transfer of α-synuclein from host brain cells to grafted neurons has been shown, but the reported frequency of the event has been relatively low and little is known about the underlying mechanisms as well as the fate of the transferred α-synuclein. We now demonstrate frequent transfer of α-synuclein from a rat brain engineered to overexpress human α-synuclein to grafted dopaminergic neurons. Further, we show that this model can be used to explore mechanisms underlying cell-to-cell transfer of α-synuclein. Thus, we present evidence both for the involvement of endocytosis in α-synuclein uptake in vivo, and for seeding of aggregation of endogenous α-synuclein in the recipient neuron by the transferred α-synuclein. Finally, we show that, at least in a subset of the studied cells, the transmitted α-synuclein is sensitive to proteinase K. Our new model system could be used to test compounds that inhibit cell-to-cell transfer of α-synuclein and therefore might retard progression of Parkinson neuropathology.

Overview

The claims and statistics of this paper haven’t been checked yet.

Run the check — free, no account needed. It reads the open-access text and checks the sources it cites.

A few free checks a day · papers already verified open instantly · results are public

Integrity signals

Registry

Crossref · 10.1371/journal.pone.0039465

Cites

45 of 45 references verified0 citation errors · 0 not checkable

Statistics

Figures

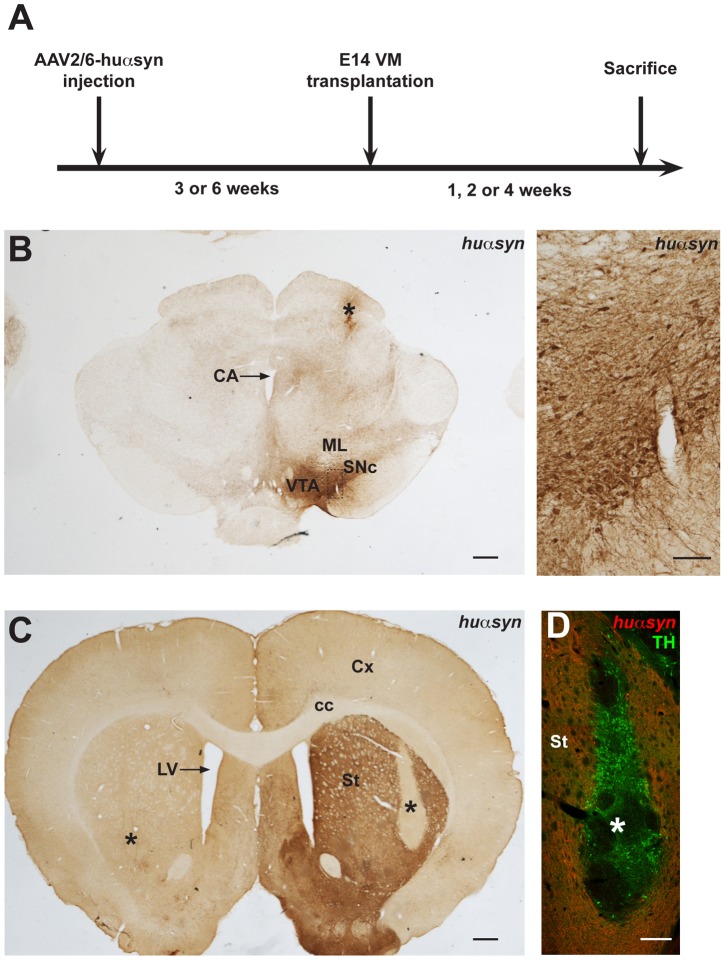
Figure 1 AAV2/6-huαsyn- and transplantation-based rat model for prion-like propagation of α-synuclein. (A) Experimental protocol. Rats were injected in the right substantia nigra with AAV2/6-huαsyn. Three or six weeks later, these rats were transplanted with wild-type rat embryonic day 14 ventral mesencephalic tissue bilaterally in the striatum. Finally, the animals were sacrificed one, two or four weeks after grafting. (B, left) Coronal section at the level of the interpeduncular fossa of a rat ten weeks after AAV2/6 injection. Asterisk marks the injection site. (B, right) High magnification view of the left panel (dashed box) demonstrating expression of huαsyn in the cell bodies of the SNc. (C) Coronal section at the level of the gyrus diagonalis of a rat transplanted with VM tissue six weeks after AAV2/6-huαsyn injection and sacrificed four weeks after grafting. The immunohistochemical analysis with antibodies directed against huαsyn shows the overexpression of this protein in the axon terminals of the right striatum. The center of the bilateral grafts is marked with an asterisk. On the right, the graft is clearly located in the area devoid of signal. (D) Adjacent section from the same animal, subjected to double immunofluorescence with antibodies directed against TH (green) and huαsyn (red). The TH-positive cell bodies of the transplanted neurons are easily distinguished from the surrounding huαsyn-positive host tissue. Here again the asterisk is located in the center of the graft. Abbreviations: CA, cerebral aquaduct; cc, corpus callosum; Cx, cortex; E, embryonic day; LV, lateral ventricle; ML, medial lemniscus; St, striatum; SNc, substantia nigra pars compacta; VM, ventral mesencephalon; VTA, ventral tegmental area. The scale bars for panels B (left), C, and D represent 500 µm, while the scale bar for panel B (right) represents 100 µm.
Figure 1 AAV2/6-huαsyn- and transplantation-based rat model for prion-like propagation of α-synuclein. (A) Experimental protocol. Rats were injected in the right substantia nigra with AAV2/6-huαsyn. Three or six weeks later, these rats were transplanted with wild-type rat embryonic day 14 ventral mesencephalic tissue bilaterally in the striatum. Finally, the animals were sacrificed one, two or four weeks after grafting. (B, left) Coronal section at the level of the interpeduncular fossa of a rat ten weeks after AAV2/6 injection. Asterisk marks the injection site. (B, right) High magnification view of the left panel (dashed box) demonstrating expression of huαsyn in the cell bodies of the SNc. (C) Coronal section at the level of the gyrus diagonalis of a rat transplanted with VM tissue six weeks after AAV2/6-huαsyn injection and sacrificed four weeks after grafting. The immunohistochemical analysis with antibodies directed against huαsyn shows the overexpression of this protein in the axon terminals of the right striatum. The center of the bilateral grafts is marked with an asterisk. On the right, the graft is clearly located in the area devoid of signal. (D) Adjacent section from the same animal, subjected to double immunofluorescence with antibodies directed against TH (green) and huαsyn (red). The TH-positive cell bodies of the transplanted neurons are easily distinguished from the surrounding huαsyn-positive host tissue. Here again the asterisk is located in the center of the graft. Abbreviations: CA, cerebral aquaduct; cc, corpus callosum; Cx, cortex; E, embryonic day; LV, lateral ventricle; ML, medial lemniscus; St, striatum; SNc, substantia nigra pars compacta; VM, ventral mesencephalon; VTA, ventral tegmental area. The scale bars for panels B (left), C, and D represent 500 µm, while the scale bar for panel B (right) represents 100 µm.CC BY · PubMed Central
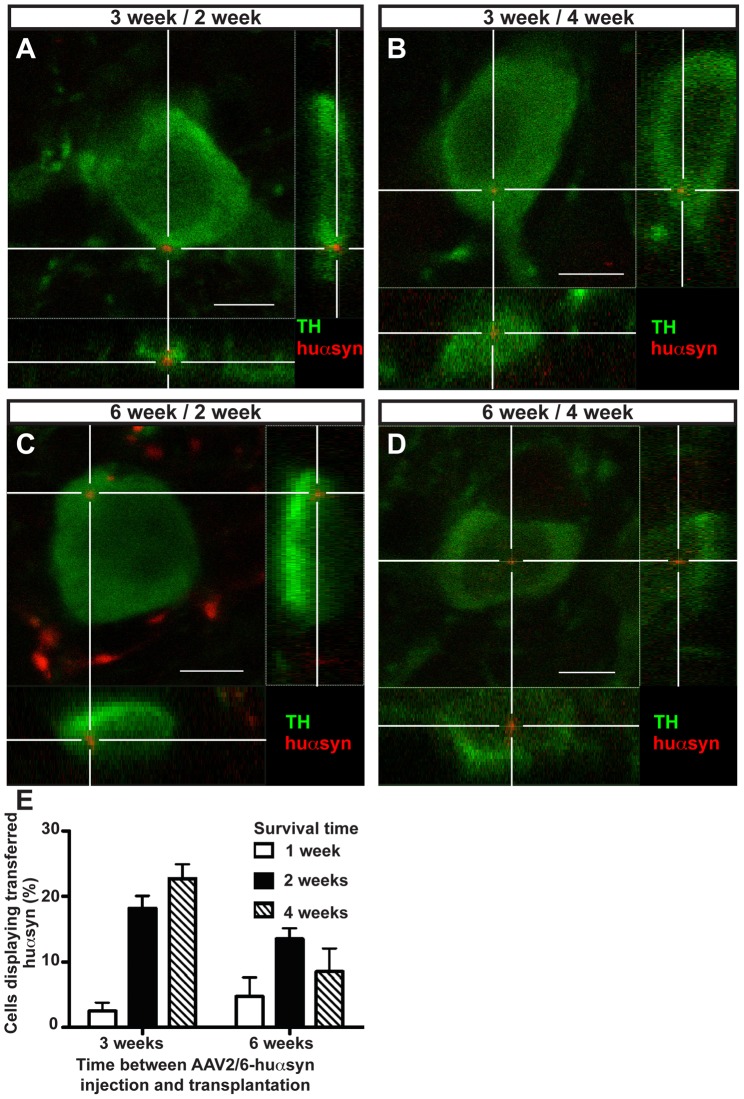
Figure 2 The propagation of human α-synuclein from host tissue to transplanted dopaminergic neurons is a disease stage- and time-dependent process. (A-D) Confocal three-dimensional reconstructions of grafted TH-positive neurons (green) displaying intracellular puncta of transferred huαsyn (red), which are marked by the white cross. Reconstructed orthogonal projections are presented as viewed in the x-z (bottom) and y-z (right) planes. These cells were detected in rats transplanted either three (A, B) or six (C, D) weeks after AAV2/6-huαsyn injection and sacrificed two (A, C) or four (B, D) weeks after grafting. (E) Quantification of the percentage of transplanted TH-expressing cells that show intracellular puncta of huαsyn in each experimental group. Each bar represents the number of transferred huαsyn-positive cells compared to the total TH-positive cells counted in each group. We randomly sampled more than 20 TH-positive cells per rat, in three to seven rats per group. Scale bars equal 6 µm.
Figure 2 The propagation of human α-synuclein from host tissue to transplanted dopaminergic neurons is a disease stage- and time-dependent process. (A-D) Confocal three-dimensional reconstructions of grafted TH-positive neurons (green) displaying intracellular puncta of transferred huαsyn (red), which are marked by the white cross. Reconstructed orthogonal projections are presented as viewed in the x-z (bottom) and y-z (right) planes. These cells were detected in rats transplanted either three (A, B) or six (C, D) weeks after AAV2/6-huαsyn injection and sacrificed two (A, C) or four (B, D) weeks after grafting. (E) Quantification of the percentage of transplanted TH-expressing cells that show intracellular puncta of huαsyn in each experimental group. Each bar represents the number of transferred huαsyn-positive cells compared to the total TH-positive cells counted in each group. We randomly sampled more than 20 TH-positive cells per rat, in three to seven rats per group. Scale bars equal 6 µm.CC BY · PubMed Central
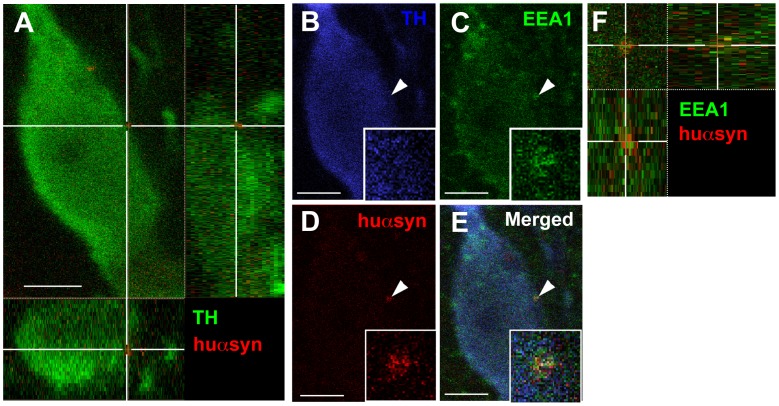
Figure 3 Endocytosis is involved in human α-synuclein intercellular transfer. (A) Confocal three-dimensional reconstruction showing the intracellular location of a transferred huαsyn punctum (red) within a TH-positive transplanted neuron (green) from the 3 week/4 week group. (B-D) Triple staining with antibodies raised against TH (B, blue), EEA1 (C, green) and huαsyn (D, red) shows the colocalization of this transmitted huαsyn punctum with EEA1 (arrowheads). Panel E is a merged picture of (B), (C), and (D). The insets in (B), (C), (D) and (E) are higher magnifications of the huαsyn- and EEA1-positive punctum. (F) High magnification three-dimensional reconstruction of the huαsyn- (red) and EEA1-positive (green) punctum. Scale bars represent 6 µm.
Figure 3 Endocytosis is involved in human α-synuclein intercellular transfer. (A) Confocal three-dimensional reconstruction showing the intracellular location of a transferred huαsyn punctum (red) within a TH-positive transplanted neuron (green) from the 3 week/4 week group. (B-D) Triple staining with antibodies raised against TH (B, blue), EEA1 (C, green) and huαsyn (D, red) shows the colocalization of this transmitted huαsyn punctum with EEA1 (arrowheads). Panel E is a merged picture of (B), (C), and (D). The insets in (B), (C), (D) and (E) are higher magnifications of the huαsyn- and EEA1-positive punctum. (F) High magnification three-dimensional reconstruction of the huαsyn- (red) and EEA1-positive (green) punctum. Scale bars represent 6 µm.CC BY · PubMed Central
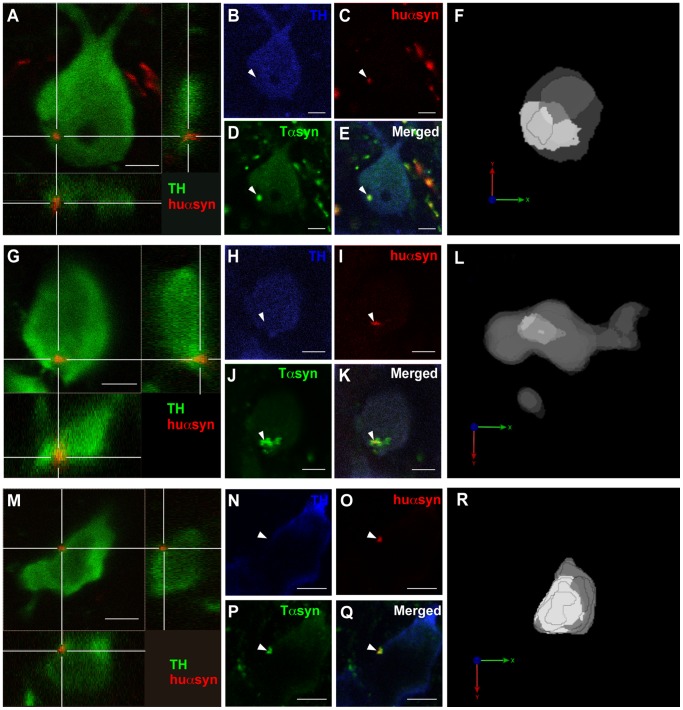
Figure 4 Transferred human α-synuclein seeds the aggregation of rat α-synuclein in the recipient cell. (A, G, M) Confocal three-dimensional reconstructions of three transplanted TH-expressing (green) cells positive for huαsyn (red) transfer. Panel A shows a TH-positive cell from the 6 week/4 week group, panel G displays a TH-expressing cell from the 6 week/2 week group and panel M corresponds to a TH-expressing cell from the 3 week/4 week group. (B-E, H-K, N-Q) Triple staining with antibodies directed against TH (B, H, N, blue), huαsyn (C, I, O, red) and both huαsyn and rodent αsyn (Tαsyn, D, J, P, green) shows the larger area stained with the total αsyn antibody compared to the huαsyn signal alone (arrowheads). The E, K and Q panels are merged pictures of (B), (C), and (D); (H), (I) and (J); and (N), (O) and (P), respectively. (F, L, R) Three-dimensional reconstructions with opaque rendering showing the core of huαsyn in light grey whereas the total αsyn is in dark grey. This view underlines the embedding of huαsyn nucleus within a shell of total αsyn signal. The orientation is indicated by the coordinate system with the x axis in green, y axis in red and z axis in blue. Scale bars represent 5 µm.
Figure 4 Transferred human α-synuclein seeds the aggregation of rat α-synuclein in the recipient cell. (A, G, M) Confocal three-dimensional reconstructions of three transplanted TH-expressing (green) cells positive for huαsyn (red) transfer. Panel A shows a TH-positive cell from the 6 week/4 week group, panel G displays a TH-expressing cell from the 6 week/2 week group and panel M corresponds to a TH-expressing cell from the 3 week/4 week group. (B-E, H-K, N-Q) Triple staining with antibodies directed against TH (B, H, N, blue), huαsyn (C, I, O, red) and both huαsyn and rodent αsyn (Tαsyn, D, J, P, green) shows the larger area stained with the total αsyn antibody compared to the huαsyn signal alone (arrowheads). The E, K and Q panels are merged pictures of (B), (C), and (D); (H), (I) and (J); and (N), (O) and (P), respectively. (F, L, R) Three-dimensional reconstructions with opaque rendering showing the core of huαsyn in light grey whereas the total αsyn is in dark grey. This view underlines the embedding of huαsyn nucleus within a shell of total αsyn signal. The orientation is indicated by the coordinate system with the x axis in green, y axis in red and z axis in blue. Scale bars represent 5 µm.CC BY · PubMed Central
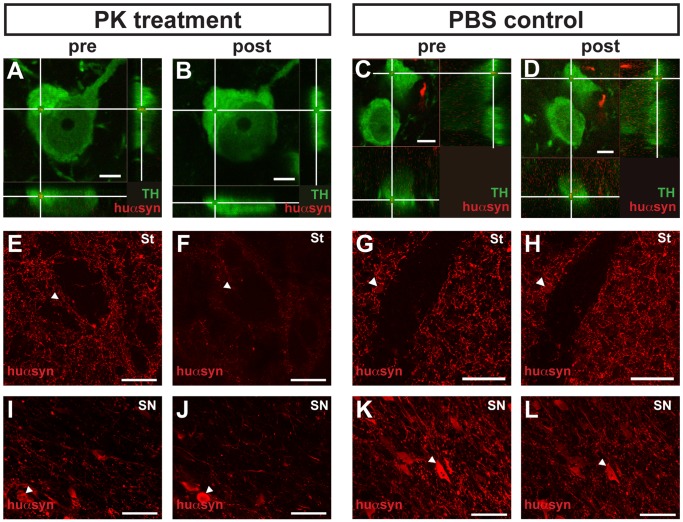
Figure 5 Transferred human α-synuclein is proteinase-K sensitive. (A-D) Confocal three-dimensional reconstructions of two TH-positive neurons (green) transplanted in rats from the 3 week/4 week group. (A) and (C) show the intracellular localization of a transferred huαsyn punctum (red) within these neurons. (B) and (D) depict the same neurons as (A) and (C); however, the antibodies were stripped from (A) and (C), and the sections were then treated with PK (B) or PBS (control, D), then re-stained. Whereas the huαsyn dot is still present in the cell treated with PBS (compare D to C), the transferred huαsyn has been dissolved by the PK treatment (compare B to A). The white cross marks the transferred huαsyn punctum (A, C, D) or its localization prior to the PK treatment (B). (E-H) and (I-L) show confocal planes of coronal sections from, respectively, the striatum and the subtantia nigra of rats of the 3 week/4 week group, stained with antibodies directed against huαsyn. (F), (H), (J) and (L) correspond to the same areas as (E), (G), (I) and (K), respectively; however, the antibodies were stripped from (E), (G), (I) and (K), and the sections were then treated with PK (F, J) or PBS (control, H, L) and re-stained. The arrowheads indicate landmarks that have been used to match the areas of interest before and after treatment. Note the apparent attenuation of signal in total area stained after PK treatment (compare F to E and J to I) and the very high similarity between the staining before and after PBS control treatment (compare H to G and L to K). The sections in (A-B), (E-F), (I-J) on one side and (C-D), (G-H) and (K-L) on the other side have been processed simultaneously, in the exact same conditions. Abbreviations: PK, proteinase K; St, striatum; SN, subtantia nigra. Scale bars represent 5 µm (A-D) or 50 µm (E-L).
Figure 5 Transferred human α-synuclein is proteinase-K sensitive. (A-D) Confocal three-dimensional reconstructions of two TH-positive neurons (green) transplanted in rats from the 3 week/4 week group. (A) and (C) show the intracellular localization of a transferred huαsyn punctum (red) within these neurons. (B) and (D) depict the same neurons as (A) and (C); however, the antibodies were stripped from (A) and (C), and the sections were then treated with PK (B) or PBS (control, D), then re-stained. Whereas the huαsyn dot is still present in the cell treated with PBS (compare D to C), the transferred huαsyn has been dissolved by the PK treatment (compare B to A). The white cross marks the transferred huαsyn punctum (A, C, D) or its localization prior to the PK treatment (B). (E-H) and (I-L) show confocal planes of coronal sections from, respectively, the striatum and the subtantia nigra of rats of the 3 week/4 week group, stained with antibodies directed against huαsyn. (F), (H), (J) and (L) correspond to the same areas as (E), (G), (I) and (K), respectively; however, the antibodies were stripped from (E), (G), (I) and (K), and the sections were then treated with PK (F, J) or PBS (control, H, L) and re-stained. The arrowheads indicate landmarks that have been used to match the areas of interest before and after treatment. Note the apparent attenuation of signal in total area stained after PK treatment (compare F to E and J to I) and the very high similarity between the staining before and after PBS control treatment (compare H to G and L to K). The sections in (A-B), (E-F), (I-J) on one side and (C-D), (G-H) and (K-L) on the other side have been processed simultaneously, in the exact same conditions. Abbreviations: PK, proteinase K; St, striatum; SN, subtantia nigra. Scale bars represent 5 µm (A-D) or 50 µm (E-L).CC BY · PubMed Central

Verification

Claims the paper makes

The claims and statistics of this paper haven’t been checked yet.

Run the check — free, no account needed. It reads the open-access text and checks the sources it cites.

A few free checks a day · papers already verified open instantly · results are public

Claims other papers make about this one

Each is checked against this paper’s own text: does it say what the citing paper says it does?

Self-check

Percentages, sums and reported differences re-computed from the paper’s own numbers.

The self-check needs the paper’s full text.

Citations

Cites

Show all 45 references

Cited by

Sorted by citations

See all 270

Metadata

Authors
Angot, E., Steiner, J. A., Lema Tomé, C. M., Ekström, P., Mattsson, B., Björklund, A., & Brundin, P.
Affiliations
  • Van Andel Institute (US)
  • Lund University (SE)
Venue
PLoS ONE
Published
2012-06-21
Volume
7
Issue
6
Pages
e39465
ISSN
1932-6203 (ISSN-L)
OpenAlex
W1973113152
Cited by
270
References
45
Citations by year
2026: 5 · 2025: 6 · 2024: 8 · 2023: 8 · 2022: 15 · 2021: 22 · 2020: 30 · 2019: 24 · 2018: 19 · 2017: 28 · 2016: 27 · 2015: 23 · 2014: 23 · 2013: 27 · 2012: 3
FWCI
15.89
Type
journal article
Language
en
Open access
Locations
  • PLoS ONE (publishedVersion, cc-by)
  • PubMed Central (publishedVersion, cc-by)
  • PubMed (publishedVersion)
  • DOAJ (DOAJ: Directory of Open Access Journals) (submittedVersion, cc-by-sa)
  • Figshare (submittedVersion, cc-by)
  • Lund University Publications (Lund University) (submittedVersion, other-oa)
Funders
  • Michael J. Fox Foundation for Parkinson's Research
  • Rosenberg Foundation
  • Strong
  • Lunds Universitet
  • Vetenskapsrådet
  • Parkinsonfonden
Topics
  • Health Sciences › Medicine › Clinical Neurology › Parkinson's Disease Mechanisms and Treatments
  • Life Sciences › Neuroscience › Cellular and Molecular Neuroscience › Alzheimer's disease research and treatments
  • Life Sciences › Neuroscience › Neurology › Neuroinflammation and Neurodegeneration Mechanisms
Keywords
alpha-synuclein, cell-to-cell transmission, seeding, Parkinson's disease, intrastriatal transplantation, Lewy bodies, endocytosis, exosomes, proteinase K sensitivity, alpha-synuclein overexpression, alpha-synuclein aggregation, rat model
MeSH terms
Animals, Brain, Cell Communication, Cell Survival, Disease Models, Animal, Dopamine, Female, Gene Expression Regulation, Humans, Parkinson Disease, Phosphorylation, Lewy Bodies, Rats, Sprague-Dawley, Endopeptidase K, Rats, alpha-Synuclein, Dopaminergic Neurons

About these checks

Registry, retraction, Cites and statistics results are computed, not judged, with one exception: a printed reference that no index lists is read once by a model before it counts as a citation error. Claims are extracted by a model and kept only when their quote appears verbatim in the text; each cited source is then checked, with a model’s help, for whether it says what the claim relies on. Those verdicts can be wrong — read the claim’s quote and the cited source before relying on one.

Statistics and arithmetic are recomputed, not judged.

Confidence bands are shown only for fields calibrated on our annotated test set. None is calibrated yet, so no band is shown.

What counts as a claim ›How we measure confidence ›How we check this ›

Are you an author, or do you see a problem with this page? Request a review