

The DOI matches its Crossref record; 55 of the 55 references it cites were found in a registry or an index.
Osteocyte Network; a Negative Regulatory System for Bone Mass Augmented by the Induction of Rankl in Osteoblasts and Sost in Osteocytes at Unloading
Open accessAbstract
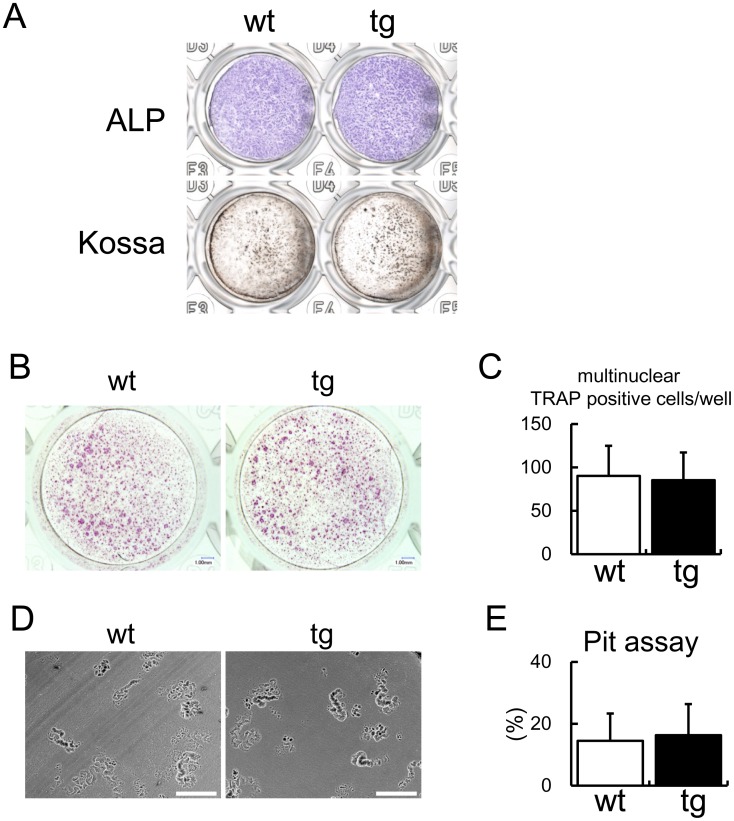
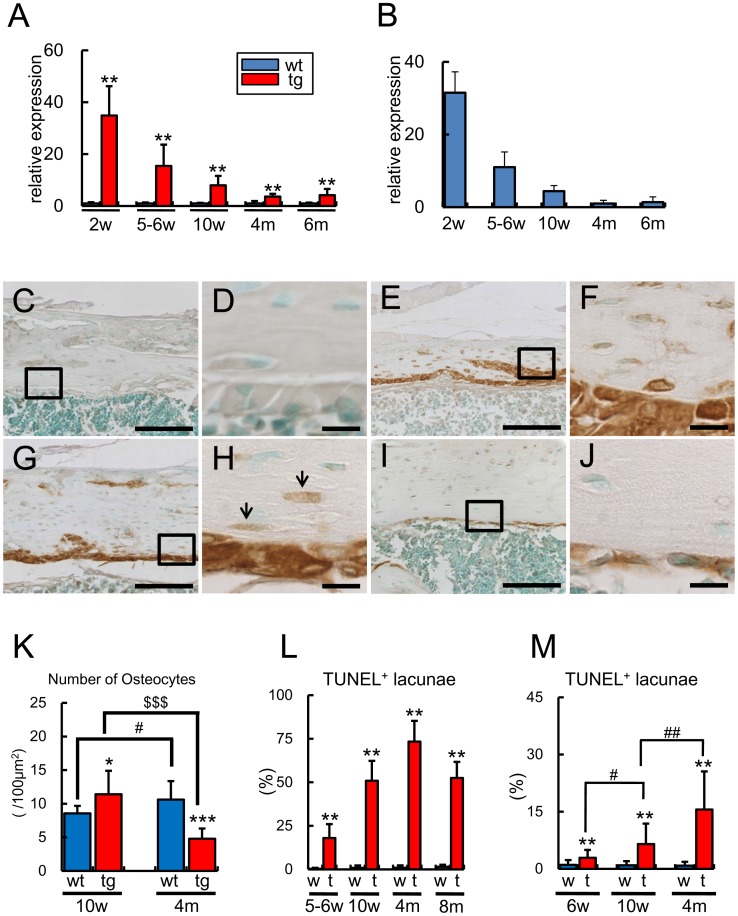
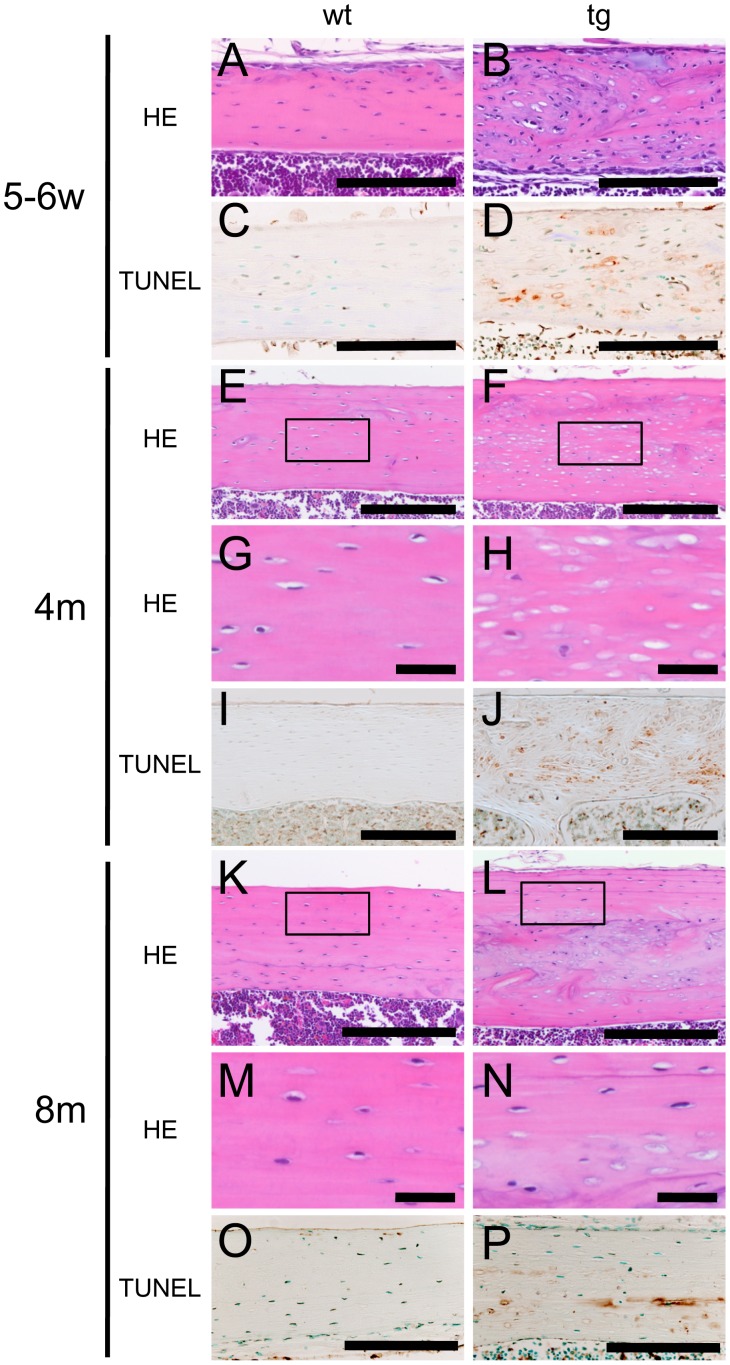
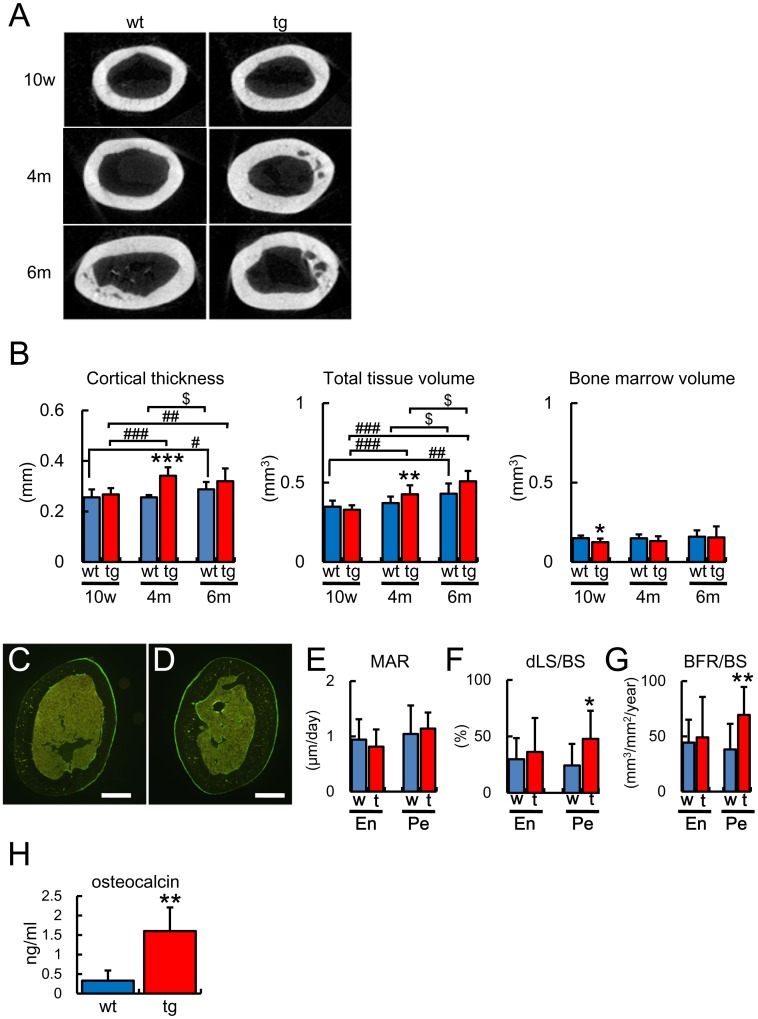
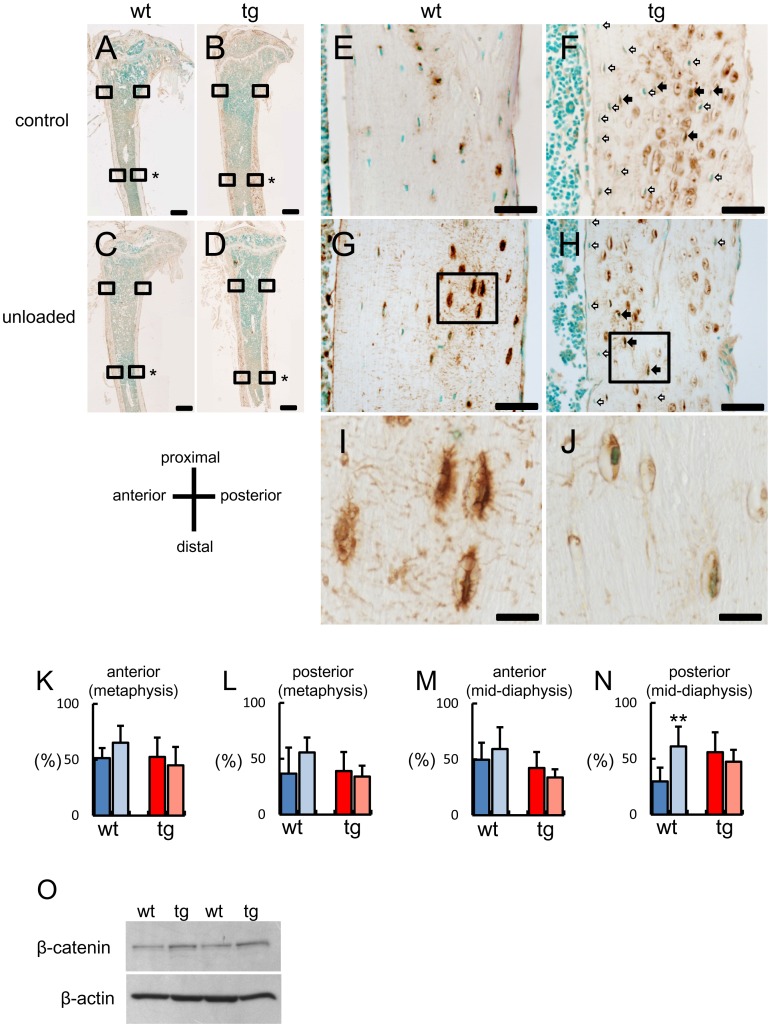
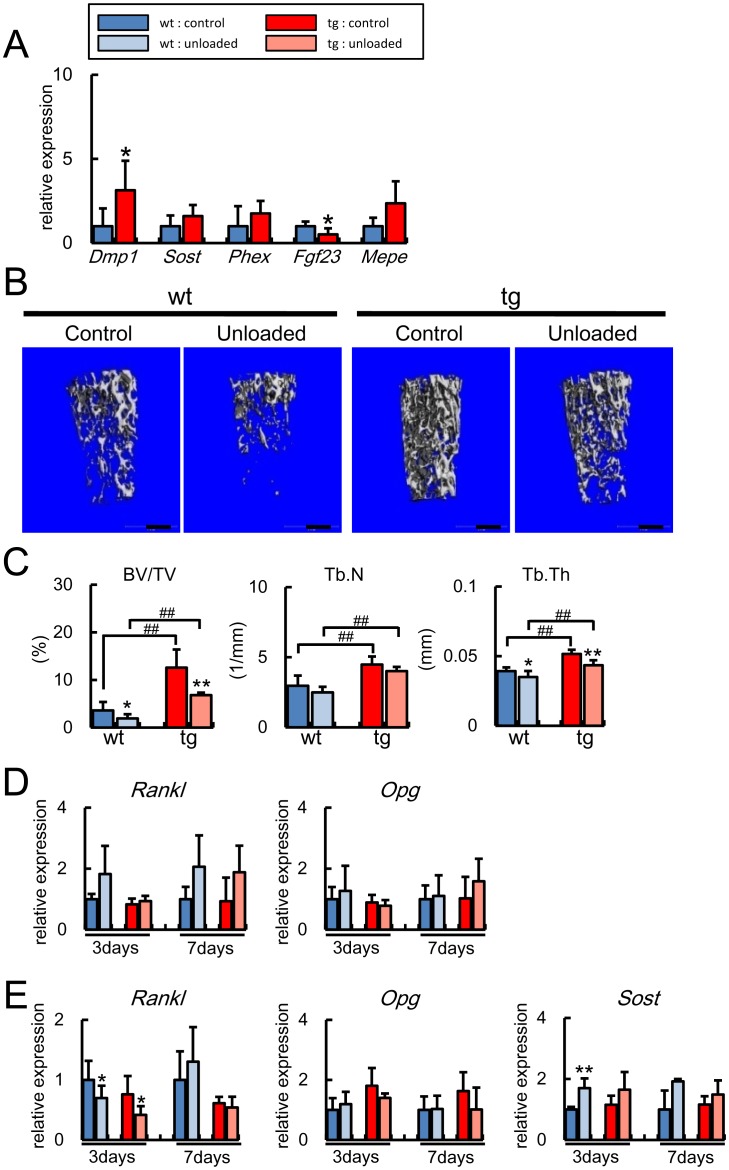
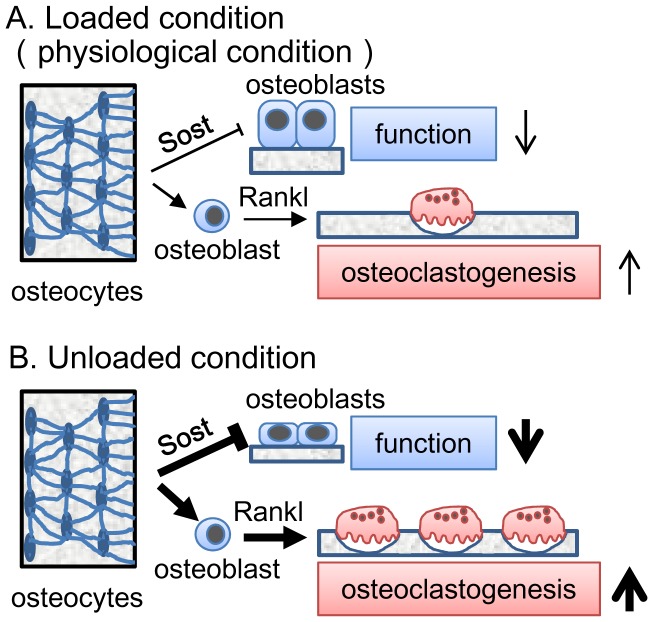
Reduced mechanical stress is a major cause of osteoporosis in the elderly, and the osteocyte network, which comprises a communication system through processes and canaliculi throughout bone, is thought to be a mechanosensor and mechanotransduction system; however, the functions of osteocytes are still controversial and remain to be clarified. Unexpectedly, we found that overexpression of BCL2 in osteoblasts eventually caused osteocyte apoptosis. Osteoblast and osteoclast differentiation were unaffected by BCL2 transgene in vitro. However, the cortical bone mass increased due to enhanced osteoblast function and suppressed osteoclastogenesis at 4 months of age, when the frequency of TUNEL-positive lacunae reached 75%. In the unloaded condition, the trabecular bone mass decreased in both wild-type and BCL2 transgenic mice at 6 weeks of age, while it decreased due to impaired osteoblast function and enhanced osteoclastogenesis in wild-type mice but not in BCL2 transgenic mice at 4 months of age. Rankl and Opg were highly expressed in osteocytes, but Rankl expression in osteoblasts but not in osteocytes was increased at unloading in wild-type mice but not in BCL2 transgenic mice at 4 months of age. Sost was locally induced at unloading in wild-type mice but not in BCL2 transgenic mice, and the dissemination of Sost was severely interrupted in BCL2 transgenic mice, showing the severely impaired osteocyte network. These findings indicate that the osteocyte network is required for the upregulation of Rankl in osteoblasts and Sost in osteocytes in the unloaded condition. These findings suggest that the osteocyte network negatively regulate bone mass by inhibiting osteoblast function and activating osteoclastogenesis, and these functions are augmented in the unloaded condition at least partly through the upregulation of Rankl expression in osteoblasts and that of Sost in osteocytes, although it cannot be excluded that low BCL2 transgene expression in osteoblasts contributed to the enhanced osteoblast function.
Overview
The claims and statistics of this paper haven’t been checked yet.
Run the check — free, no account needed. It reads the open-access text and checks the sources it cites.
Integrity signals
Registry
Cites
Statistics
Figures
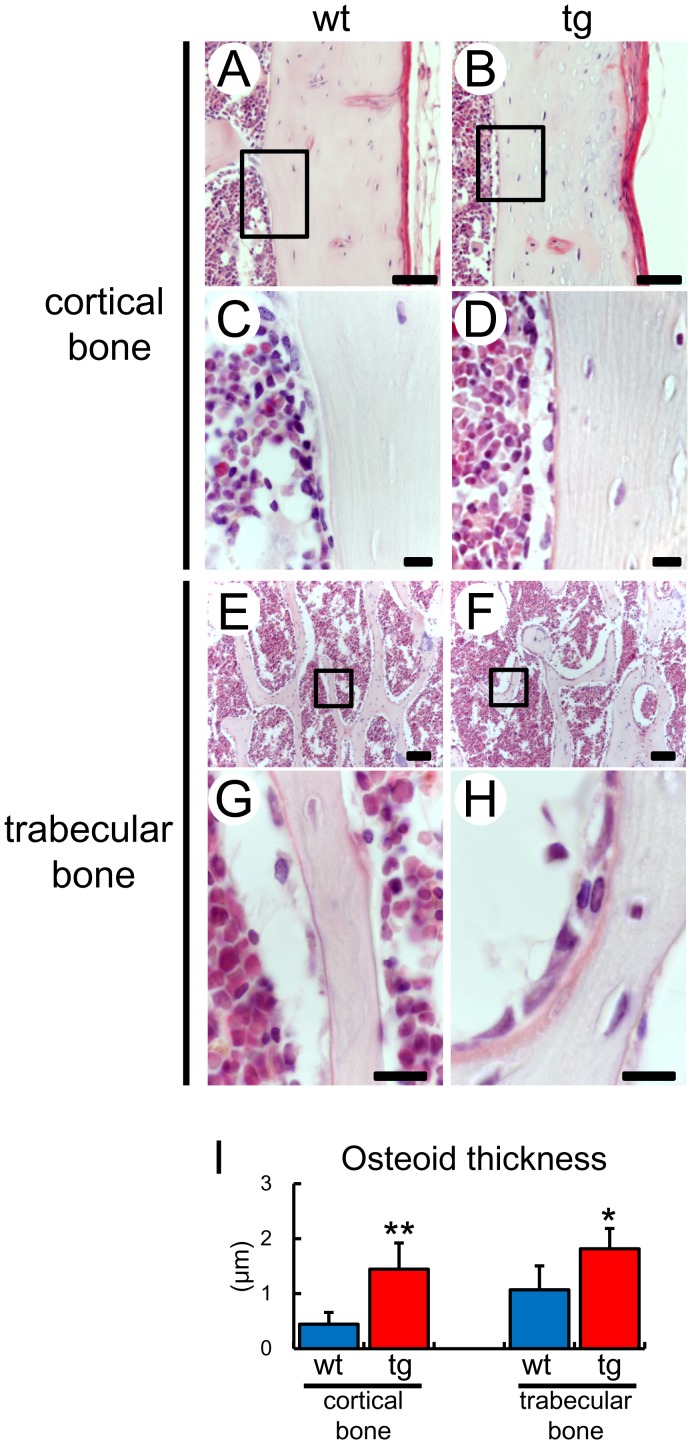
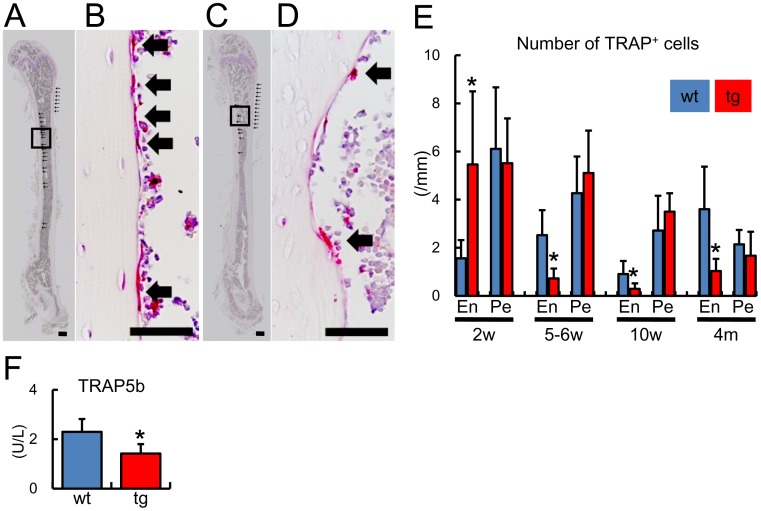
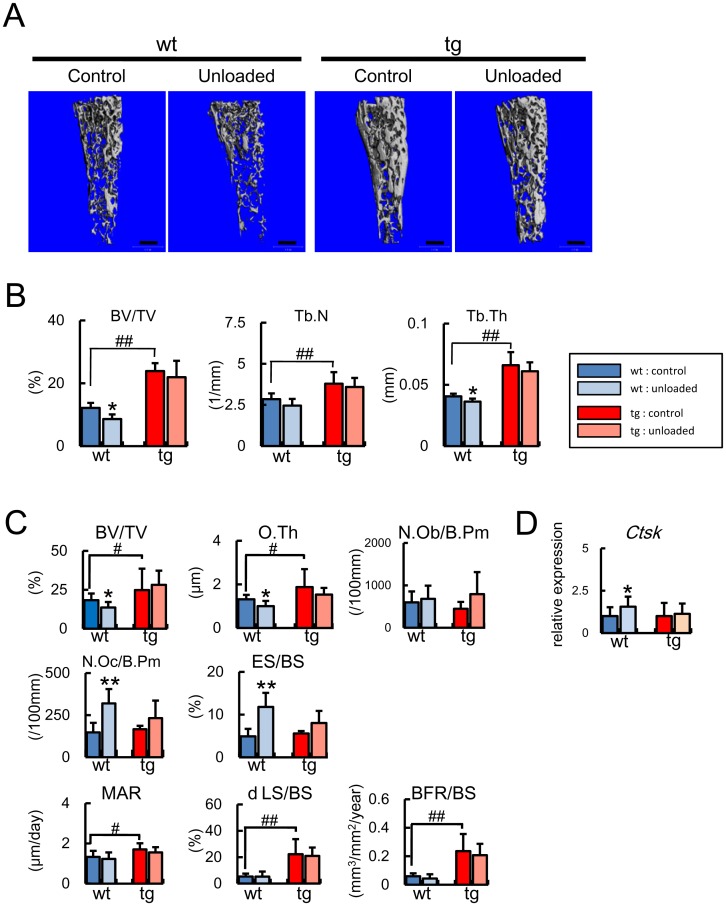
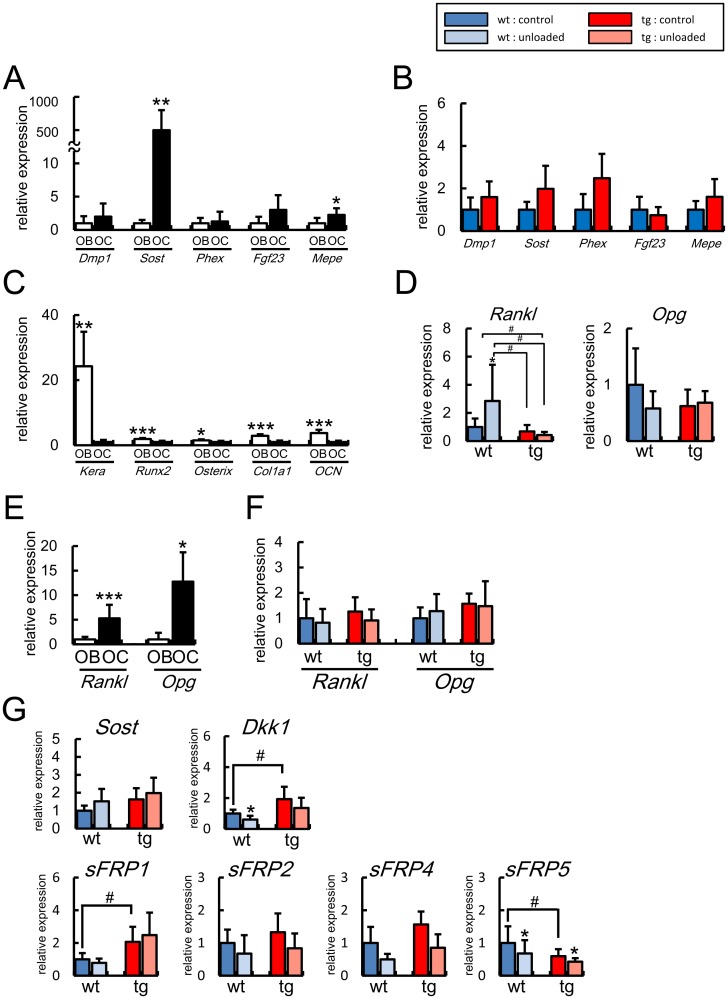
Verification
Claims the paper makes
The claims and statistics of this paper haven’t been checked yet.
Run the check — free, no account needed. It reads the open-access text and checks the sources it cites.
Claims other papers make about this one
Each is checked against this paper’s own text: does it say what the citing paper says it does?
In the citing paper
“On the other hand, mechanical unloading downregulates anabolic factors and stimulates osteocytes to produce sclerostin and DKK-1, which are inhibitors of osteoblast activity [185–188], as well as specific factors that stimulate local osteoclastogenesis [189].”
From Biology of Bone Tissue: Structure, Function, and Factors That Influence Bone Cells (2015) · cites this paper as [188]
Self-check
Percentages, sums and reported differences re-computed from the paper’s own numbers.
The self-check needs the paper’s full text.
Citations
Cites
Bonewald, L. F. (2011) · Journal of Bone and Mineral Research · doi:10.1002/jbmr.320 · Cited by 2,287
Das Gesetz der Transformation der Knochen
Wolff, J. (1893) · DMW - Deutsche Medizinische Wochenschrift · doi:10.1055/s-0028-1144106 · Cited by 2,037
Evidence for osteocyte regulation of bone homeostasis through RANKL expression
Nakashima, T., Hayashi, M., Fukunaga, T., Kurata, K., Oh-hora, M., Feng, J. Q., Bonewald, L. F., Kodama, T., Wutz, A., Wagner, E. F., et al. (2011) · Nature Medicine · doi:10.1038/nm.2452 · Cited by 1,778
Sclerostin Binds to LRP5/6 and Antagonizes Canonical Wnt Signaling
Li, X., Zhang, Y., Kang, H., Liu, W., Liu, P., Zhang, J., Harris, S. E., & Wu, D. (2005) · Journal of Biological Chemistry · doi:10.1074/jbc.m413274200 · Cited by 1,366 · cited 1×
“encoding a collagenase-resistant form of type I collagen, showed osteocyte apoptosis and increased bone formation [53], and it has been shown that osteocytes secrete Sost, which is a potent antagonist of Wnt, and inhibits bone formation [54], [55], [56], [57]; therefore, there were contrasting observations that osteoc…”
Mechanical Stimulation of Bone in Vivo Reduces Osteocyte Expression of Sost/Sclerostin
Robling, A. G., Niziolek, P. J., Baldridge, L. A., Condon, K. W., Allen, M. R., Alam, I., Mantila, S. M., Gluhak-Heinrich, J., Bellido, T. M., Harris, S. E., et al. (2008) · Journal of Biological Chemistry · doi:10.1074/jbc.m705092200 · Cited by 1,350
Matrix-embedded cells control osteoclast formation
Xiong, J., Onal, M., Jilka, R. L., Weinstein, R. S., Manolagas, S. C., & O'Brien, C. A. (2011) · Nature Medicine · doi:10.1038/nm.2448 · Cited by 1,304
Martin, R. B., Burr, D. B., Sharkey, N. A., & Fyhrie, D. P. (2015) · doi:10.1007/978-1-4939-3002-9 · Cited by 1,159
Osteocyte control of bone formation via sclerostin, a novel BMP antagonist
Winkler, D. G., Sutherland, M. K., Geoghegan, J. C., Yu, C., Hayes, T., Skonier, J. E., Shpektor, D., Jonas, M., Kovacevich, B. R., Staehling‐Hampton, K., et al. (2003) · The EMBO Journal · doi:10.1093/emboj/cdg599 · Cited by 1,114
Osteocytes, mechanosensing and Wnt signaling
Bonewald, L. F., & Johnson, M. L. (2008) · Bone · doi:10.1016/j.bone.2007.12.224 · Cited by 1,076
Sclerostin is a delayed secreted product of osteocytes that inhibits bone formation
Poole, K. E. S., Van Bezooijen, R. L., Loveridge, N., Hamersma, H., Papapoulos, S. E., Löwik, C. W., & Reeve, J. (2005) · The FASEB Journal · doi:10.1096/fj.05-4221fje · Cited by 965
Research works printed but not linked: 5
- J Xiong, 2011, Matrix-embedded cells control osteoclast formation., Nat Med, 17, 1235, 10.1038/nm.2448 · DOI · Paper page
- KE Poole, 2005, Sclerostin is a delayed secreted product of osteocytes that inhibits bone formation., FASEB J, 19, 1842, 10.1096/fj.05-4221fje · DOI · Paper page
- X Li, 2005, Sclerostin Binds to LRP5/6 and Antagonizes Canonical Wnt Signaling., J Biol Chem, 280, 19883, 10.1074/jbc.M413274200 · DOI · Paper page
- M Semenov, 2005, SOST Is a Ligand for LRP5/LRP6 and a Wnt Signaling Inhibitor., J Biol Chem, 280, 26770, 10.1074/jbc.M504308200 · DOI · Paper page
- X Li, 2008, Targeted Deletion of the Sclerostin Gene in Mice Results in Increased Bone Formation and Bone Strength., J Bone Miner Res, 23, 860, 10.1359/jbmr.080216 · DOI
Cited by
Sorted by citations
Biology of Bone Tissue: Structure, Function, and Factors That Influence Bone Cells
Florencio-Silva, R., Sasso, G. R. D. S., Sasso-Cerri, E., Simões, M. J., & Cerri, P. S. (2015) · BioMed Research International · doi:10.1155/2015/421746 · Cited by 2,044
Osteocytes: master orchestrators of bone
Schaffler, M. B., Cheung, W.-Y., Majeska, R., & Kennedy, O. (2014) · Calcified Tissue International · doi:10.1007/s00223-013-9790-y · Cited by 514
Runx2, an inducer of osteoblast and chondrocyte differentiation
Komori, T. (2018) · Histochemistry and Cell Biology · doi:10.1007/s00418-018-1640-6 · Cited by 468
Self-citationOsteoblast and osteocyte: Games without frontiers
Capulli, M., Paone, R., & Rucci, N. (2014) · Archives of Biochemistry and Biophysics · doi:10.1016/j.abb.2014.05.003 · Cited by 413
Xiong, J., Piemontese, M., Onal, M., Campbell, J., Goellner, J. J., Dusevich, V., Bonewald, L., Manolagas, S. C., & O’Brien, C. A. (2015) · PLOS ONE · doi:10.1371/journal.pone.0138189 · Cited by 323
Animal models for osteoporosis
Komori, T. (2015) · European Journal of Pharmacology · doi:10.1016/j.ejphar.2015.03.028 · Cited by 317
Self-citationCytokine networking of innate immunity cells: a potential target of therapy
Střı́ž, I., Brabcová, E., Kolesár, L., & Sekerková, A. (2014) · Clinical Science · doi:10.1042/cs20130497 · Cited by 231
Moriishi, T., Ozasa, R., Ishimoto, T., Nakano, T., Hasegawa, T., Miyazaki, T., Liu, W., Fukuyama, R., Wang, Y., Komori, H., et al. (2020) · PLoS Genetics · doi:10.1371/journal.pgen.1008586 · Cited by 218
Self-citationCell Death in Chondrocytes, Osteoblasts, and Osteocytes
Komori, T. (2016) · International Journal of Molecular Sciences · doi:10.3390/ijms17122045 · Cited by 176
“In BCl2 transgenic mice, osteocyte death does not induce bone resorption because the extracellular communication system is also disrupted [120].”
BackgroundSelf-citationUpdate on the effects of microgravity on the musculoskeletal system
Juhl, O. J., Buettmann, E. G., Friedman, M. A., DeNapoli, R. C., Hoppock, G. A., & Donahue, H. J. (2021) · npj Microgravity · doi:10.1038/s41526-021-00158-4 · Cited by 204
Osteocytic Canalicular Networks: Morphological Implications for Altered Mechanosensitivity
Milovanovic, P. D., Zimmermann, E. A., Hahn, M. P., Djonić, D., Püschel, K., Djuric, M. P., Amling, M., & Busse, B. (2013) · ACS Nano · doi:10.1021/nn401360u · Cited by 186
The osteocyte plays multiple roles in bone remodeling and mineral homeostasis
Chen, H., Senda, T., & Kubo, K. (2015) · Medical Molecular Morphology · doi:10.1007/s00795-015-0099-y · Cited by 139
Glucocorticoid Signaling and Bone Biology
Komori, T. (2016) · Hormone and Metabolic Research · doi:10.1055/s-0042-110571 · Cited by 131
Self-citationJing, D., Cai, J., Wu, Y., Shen, G., Li, F., Xu, Q., Xie, K., Tang, C., Liu, J., Guo, W., et al. (2014) · Journal of Bone and Mineral Research · doi:10.1002/jbmr.2260 · Cited by 114
Jing, D., Baik, A. D., Lu, X. L., Zhou, B., Lai, X., Wang, L., Luo, E., & Guo, X.-D. E. (2013) · The FASEB Journal · doi:10.1096/fj.13-237578 · Cited by 112
Functions of the osteocyte network in the regulation of bone mass
Komori, T. (2013) · Cell and Tissue Research · doi:10.1007/s00441-012-1546-x · Cited by 113
Self-citationXu, X., Liu, S., Liu, H., Ru, K., Jia, Y., Wu, Z., Liang, S., Khan, Z., Chen, Z., Qian, A., et al. (2021) · International Journal of Molecular Sciences · doi:10.3390/ijms22126429 · Cited by 119
Exosomes: Mediators of bone diseases, protection, and therapeutics potential
Behera, J., & Tyagi, N. (2018) · Oncoscience · doi:10.18632/oncoscience.421 · Cited by 101
Osteoporosis therapies and their mechanisms of action (Review)
Kim, B., Cho, Y., & Lim, W. (2021) · Experimental and Therapeutic Medicine · doi:10.3892/etm.2021.10815 · Cited by 106
Qin, X., Jiang, Q., Komori, H., Sakane, C., Fukuyama, R., Matsuo, Y., Ito, K., Miyazaki, T., & Komori, T. (2020) · Journal of Bone and Mineral Research · doi:10.1002/jbmr.4386 · Cited by 95
Self-citationPeriostin expression contributes to cortical bone loss during unloading
Gerbaix, M., Vico, L., Ferrari, S., & Bonnet, N. (2014) · Bone · doi:10.1016/j.bone.2014.10.011 · Cited by 89
Bone's Response to Mechanical Loading in Aging and Osteoporosis: Molecular Mechanisms
Carina, V., Bella, E. D., Costa, V., Bellavia, D., Veronesi, F., Cepollaro, S., Fini, M., & Giavaresi, G. (2020) · Calcified Tissue International · doi:10.1007/s00223-020-00724-0 · Cited by 77
Advances in Animal Models for Studying Bone Fracture Healing
Gao, H., Huang, J., Wei, Q., & He, C. (2023) · Bioengineering · doi:10.3390/bioengineering10020201 · Cited by 61
Regulation of Skeletal Development and Maintenance by Runx2 and Sp7
Komori, T. (2024) · International Journal of Molecular Sciences · doi:10.3390/ijms251810102 · Cited by 67
Self-citationIn Vitro Co-Culture Model of Primary Human Osteoblasts and Osteocytes in Collagen Gels
Skottke, J., Gelinsky, M., & Bernhardt, A. (2019) · International Journal of Molecular Sciences · doi:10.3390/ijms20081998 · Cited by 53
Connexin 43 hemichannels protect bone loss during estrogen deficiency
Ma, L., Hua, R., Tian, Y., Cheng, H., Fajardo, R. J., Pearson, J. J., Guda, T., Shropshire, D. B., Gu, S., & Jiang, J. X. (2019) · Bone Research · doi:10.1038/s41413-019-0050-2 · Cited by 48
Bcl2 Deficiency Activates FoxO through Akt Inactivation and Accelerates Osteoblast Differentiation
Moriishi, T., Kawai, Y., Komori, H., Rokutanda, S., Eguchi, Y., Tsujimoto, Y., Asahina, I., & Komori, T. (2014) · PLoS ONE · doi:10.1371/journal.pone.0086629 · Cited by 47
Self-citationSystemic Bone Loss After Fracture
Osipov, B., Emami, A. J., & Christiansen, B. (2018) · Clinical Reviews in Bone and Mineral Metabolism · doi:10.1007/s12018-018-9253-0 · Cited by 47
Taxonomy of rare genetic metabolic bone disorders
Masi, L., Agnusdei, D., Bilezikian, J. P., Chappard, D., Chapurlat, R. D., Cianferotti, L., Devolgelaer, J.-P., Maghraoui, A. E., Ferrari, S., Javaid, M. K., et al. (2015) · Osteoporosis International · doi:10.1007/s00198-015-3188-9 · Cited by 47
Roles of Toll-like Receptor Signaling in Inflammatory Bone Resorption
Tominari, T., Matsumoto, C., Tanaka, Y., Shimizu, K., Takatoya, M., Sugasaki, M., Karouji, K., Kasuga, U., Miyaura, C., Miyata, S., et al. (2024) · Biology · doi:10.3390/biology13090692 · Cited by 42
RUNX2 promotes malignant progression in gastric cancer by regulating COL1A1
Li, Y., Sun, R., Zhao, X., & Sun, B. (2021) · Cancer Biomarkers · doi:10.3233/cbm-200472 · Cited by 42
Matsui, H., Fukuno, N., Kanda, Y., Kantoh, Y., Chida, T., Nagaura, Y., Suzuki, O., Nishitoh, H., Takeda, K., Ichijo, H., et al. (2014) · Journal of Biological Chemistry · doi:10.1074/jbc.m113.536300 · Cited by 41
Prevention of muscle wasting and osteoporosis: the value of examining novel animal models
Reilly, B. D., & Franklin, C. E. (2016) · Journal of Experimental Biology · doi:10.1242/jeb.128348 · Cited by 43
The osteocyte as a therapeutic target in the treatment of osteoporosis
Rochefort, G. Y. (2014) · Therapeutic Advances in Musculoskeletal Disease · doi:10.1177/1759720x14523500 · Cited by 40
Multimodal spatiotemporal transcriptomic resolution of embryonic palate osteogenesis
Oliver, J. D., Raju, R., Roth, D. M., Winchester, E. W., Chattaraj, P., Kidwai, F. K., Faucz, F. R., Iben, J., Mitra, A., Campbell, K. S., et al. (2023) · Nature Communications · doi:10.1038/s41467-023-41349-9 · Cited by 41
Inter-site Variability of the Human Osteocyte Lacunar Network: Implications for Bone Quality
Milovanovic, P. D., & Busse, B. (2019) · Current Osteoporosis Reports · doi:10.1007/s11914-019-00508-y · Cited by 36
Human Tooth-Derived Biomaterial as a Graft Substitute for Hard Tissue Regeneration
Rijal, G., & Shin, H. (2017) · Regenerative Medicine · doi:10.2217/rme-2016-0147 · Cited by 37
Moriishi, T., Fukuyama, R., Miyazaki, T., Furuichi, T., Ito, M., & Komori, T. (2016) · Journal of Bone and Mineral Research · doi:10.1002/jbmr.2808 · Cited by 33
Self-citationVinculin Force Sensor Detects Tumor-Osteocyte Interactions
Li, F., Chen, A. B., Reeser, A., Wang, Y., Fan, Y., Liu, S., Zhao, X., Prakash, R., Kota, D., Li, B., et al. (2019) · Scientific Reports · doi:10.1038/s41598-019-42132-x · Cited by 33
Invernizzi, M., Alessandro de, S. I. R. E., Renò, F., Cisari, C., Runza, L., Baricich, A., Carda, S., & Fusco, N. (2020) · Frontiers in Endocrinology · doi:10.3389/fendo.2020.00204 · Cited by 34
Pyroptosis: A spoiler of peaceful coexistence between cells in degenerative bone and joint diseases
Li, Z., Cheng, W., Gao, K., Liang, S., Ke, L., Wang, M., Fan, J., Li, D., Zhang, P., Xu, Z., et al. (2024) · Journal of Advanced Research · doi:10.1016/j.jare.2024.06.010 · Cited by 37
Gifre, L., Ruiz-Gaspà, S., Carrasco, J. L., Portell, E., Vidal, J., Muxí, Á., Monegal, A., Guañabens, N., & Peris, P. (2017) · Osteoporosis International · doi:10.1007/s00198-017-4090-4 · Cited by 32
Insights into the mechanism of vascular endothelial cells on bone biology
Yin, Y., Tang, Q., Xie, M., Li, H., & Chen, L. (2021) · Bioscience Reports · doi:10.1042/bsr20203258 · Cited by 29
Osteocytes: Their Lacunocanalicular Structure and Mechanoresponses
Moriishi, T., & Komori, T. (2022) · International Journal of Molecular Sciences · doi:10.3390/ijms23084373 · Cited by 36
Self-citationThe Rho-GEF Kalirin regulates bone mass and the function of osteoblasts and osteoclasts
Huang, S., Eleniste, P. P., Wayakanon, K., Mandela, P., Eipper, B. A., Mains, R. E., Allen, M. R., & Bruzzaniti, A. (2014) · Bone · doi:10.1016/j.bone.2013.12.023 · Cited by 30
Mechanical strain-mediated reduction in RANKL expression is associated with RUNX2 and BRD2
Galea, G. L., Paradise, C. R., Meakin, L. B., Camilleri, E. T., Taipaleenmäki, H., Stein, G. S., Lanyon, L. E., Price, J. S., van Wijnen, A. J., & Dudakovic, A. (2020) · Gene · doi:10.1016/j.gene.2020.100027 · Cited by 27
Iandolo, D., Strigini, M., Guignandon, A., & Vico, L. (2021) · Current Osteoporosis Reports · doi:10.1007/s11914-021-00713-8 · Cited by 27
Mouse Models for the Evaluation of Osteocyte Functions
Komori, T. (2014) · Journal of Bone Metabolism · doi:10.11005/jbm.2014.21.1.55 · Cited by 26
Self-citationAssembling the Puzzle Pieces. Insights for in Vitro Bone Remodeling
Krasnova, O. A., & Neganova, I. E. (2023) · Stem Cell Reviews and Reports · doi:10.1007/s12015-023-10558-6 · Cited by 26
Structural and Qualitative Bone Remodeling Around Repetitive Loaded Implants in Rabbits
Kuroshima, S., Yasutake, M., Tsuiki, K., Nakano, T., & Sawase, T. (2015) · Clinical Implant Dentistry and Related Research · doi:10.1111/cid.12318 · Cited by 26
Sun, T., Yan, Z., Cai, J., Shao, X., Wang, D., Ding, Y., Ying, F., Yang, J., Luo, E., Feng, X., et al. (2019) · Cell Biology International · doi:10.1002/cbin.11221 · Cited by 22
Zuo, G., Zhang, L., Jin, Q., Kang, H., Jia, P., Chen, H., Shen, X., Guo, L., Zhou, H., Wang, J., et al. (2015) · PLoS ONE · doi:10.1371/journal.pone.0121266 · Cited by 22
Ru, Y., Gu, H., Sun, L., Zhang, W. J., & Wang, L. (2024) · Discovery Medicine · doi:10.24976/discov.med.202436182.46 · Cited by 21
Role of the Wnt/β-Catenin Pathway in Renal Osteodystrophy
Bisson, S.-K., Ung, R., & Mac‐Way, F. (2018) · International Journal of Endocrinology · doi:10.1155/2018/5893514 · Cited by 21
Beta-Catenin Haplo Insufficient Male Mice Do Not Lose Bone in Response to Hindlimb Unloading
Maurel, D. B., Duan, P., Farr, J. N., Cheng, A.-L., Johnson, M. L., & Bonewald, L. F. (2016) · PLoS ONE · doi:10.1371/journal.pone.0158381 · Cited by 19
Thompson, M. L., Jiménez‐Andrade, J. M., & Mantyh, P. W. (2015) · Journal of Histochemistry & Cytochemistry · doi:10.1369/0022155415626499 · Cited by 21
Effects of advanced glycation end products on osteocytes mechanosensitivity
Yang, X. Y., Liu, C., Wang, Z., Ding, D., Shi, J., Wu, X., Sun, L., & Fan, Y. (2021) · Biochemical and Biophysical Research Communications · doi:10.1016/j.bbrc.2021.06.074 · Cited by 18
Cunningham, H. C., Orr, S. V., Murugesh, D. K., Hsia, A. W., Osipov, B., Go, L., Wu, P. H., Wong, A., Loots, G. G., Kazakia, G. J., et al. (2022) · Bone · doi:10.1016/j.bone.2022.116646 · Cited by 18
Roles of Sp7 in osteoblasts for the proliferation, differentiation, and osteocyte process formation
Jiang, Q., Nagano, K., Moriishi, T., Komori, H., Sakane, C., Matsuo, Y., Zhang, Z., Nishimura, R., Ito, K., Qin, X., et al. (2024) · Journal of Orthopaedic Translation · doi:10.1016/j.jot.2024.06.005 · Cited by 22
Self-citationYang, X. Y., Sun, L., Wu, X., Liang, M., & Fan, Y. (2015) · Acta Astronautica · doi:10.1016/j.actaastro.2015.07.020 · Cited by 15
Osteocyte Apoptosis Contributes to Cold Exposure-induced Bone Loss
Du, J., He, Z., Cui, J., Li, H., Xu, M., Zhang, S., Zhang, S., Yan, M., Qu, X., & Yu, Z. (2021) · Frontiers in Bioengineering and Biotechnology · doi:10.3389/fbioe.2021.733582 · Cited by 16
Bone mechanobiology in mice: toward single-cell in vivo mechanomics
Scheuren, A. C., Wehrle, E., Flohr, F. R., & Müller, R. (2017) · Biomechanics and Modeling in Mechanobiology · doi:10.1007/s10237-017-0935-1 · Cited by 17
Moriishi, T., Ito, T., Fukuyama, R., Qin, X., Komori, H., Kaneko, H., Matsuo, Y., Yoshida, N., & Komori, T. (2022) · International Journal of Molecular Sciences · doi:10.3390/ijms23063173 · Cited by 14
Self-citationCell life-or-death events in osteoporosis: All roads lead to mitochondrial dynamics
Li, Z., Liang, S., Ke, L., Wang, M., Gao, K., Li, D., Xu, Z., Li, N., Zhang, P., & Cheng, W. (2024) · Pharmacological Research · doi:10.1016/j.phrs.2024.107383 · Cited by 14
Optimization of screw fixation in rat bone with extracorporeal shock waves
Koolen, M. K. E., Kruyt, M. C., ZADPOOR, A. A., Öner, F. C., Weinans, H., & van der Jagt, O. P. (2017) · Journal of Orthopaedic Research® · doi:10.1002/jor.23615 · Cited by 13
A mouse model of disuse osteoporosis based on a movable noninvasive 3D-printed unloading device
Li, J., Geng, J., Lin, T., Cai, M., & Sun, Y. (2022) · Journal of Orthopaedic Translation · doi:10.1016/j.jot.2021.11.009 · Cited by 13
Ko, F. C., Vliet, M. V., Ellman, R., Grasso, D. J., Brooks, D. J., Spatz, J., Conlon, C., Aguirre, J. I., Wronski, T. J., & Bouxsein, M. (2017) · JBMR Plus · doi:10.1002/jbm4.10012 · Cited by 12
Aging: A struggle for beneficial to overcome negative factors made by muscle and bone
Welc, S. S., Brotto, M., White, K. E., & Bonewald, L. F. (2025) · Mechanisms of Ageing and Development · doi:10.1016/j.mad.2025.112039 · Cited by 11
Quent, V. M. C., Theodoropoulos, C., Hutmacher, D. W., & Reichert, J. C. (2015) · Biomedizinische Technik/Biomedical Engineering · doi:10.1515/bmt-2014-0159 · Cited by 12
Miyamura, G., Wakabayashi, H., Nagao, N., Kato, S., Nakagawa, T., Naito, Y., & Sudo, A. (2020) · Modern Rheumatology · doi:10.1080/14397595.2020.1782592 · Cited by 10
Effects of osteocytes on vibration-induced reflex muscle activity in postmenopausal women
Karamehmetoğlu, Ş. S., Karacan, İ., Çidem, M., Küçük, S. H., Ekmekçi, H., & Bahadır, C. (2014) · TURKISH JOURNAL OF MEDICAL SCIENCES · doi:10.3906/sag-1305-3 · Cited by 9
Booker, C. N., Haga, C. L., Boregowda, S. V., Strivelli, J., & Phinney, D. G. (2021) · npj Microgravity · doi:10.1038/s41526-021-00178-0 · Cited by 9
Woo, S., Paek, K., Yoon, Y. M., Kim, H., Park, S. I., & Kim, J. A. (2025) · Materials Today Bio · doi:10.1016/j.mtbio.2025.101658 · Cited by 8
He, M., Tian, J.-Q., He, X., Yang, P. H., Lin, T., Zhang, Q., He, W., & Wei, Q. (2023) · Frontiers in Cell and Developmental Biology · doi:10.3389/fcell.2023.1250070 · Cited by 6
Gao, X., Wang, S., Zhang, J., Wang, S., Bai, F., Liang, J., Wu, J., Wang, H., Gao, Y., & Chang, H. (2021) · Journal of Comparative Physiology B · doi:10.1007/s00360-021-01375-9 · Cited by 6
Peurière, L., Mastrandrea, C. J., Vanden‐Bossche, A., Linossier, M., Thomas, M., Normand, M., Lafage‐Proust, M., & Vico, L. (2022) · SSRN Electronic Journal · doi:10.2139/ssrn.4232740 · Cited by 6
Kahla, R. B., & Barkaoui, A. (2021) · Elsevier eBooks · doi:10.1016/b978-0-323-88467-9.00002-3 · Cited by 6
Development of Osteopenia During Distal Radius Fracture Recovery
Yousaf, I. S., Guarino, G. M., Sanghavi, K. K., Rozental, T. D., Means, K. R., & Giladi, A. M. (2022) · Journal of Hand Surgery Global Online · doi:10.1016/j.jhsg.2022.09.001 · Cited by 5
Gao, X., Wang, S., Shen, S., Wang, S., Xie, M., Storey, K. B., Yu, C., Lefai, É., Song, W., Chang, H., et al. (2023) · Journal of Comparative Physiology B · doi:10.1007/s00360-023-01482-9 · Cited by 5
Surowiec, R. K., Battle, L., Schlecht, S. H., Wojtys, E. M., Caird, M. S., & Kozloff, K. M. (2020) · JBMR Plus · doi:10.1002/jbm4.10377 · Cited by 5
Spatz, J., Ko, F. C., Ayturk, U. M., Warman, M. L., & Bouxsein, M. (2021) · PLoS ONE · doi:10.1371/journal.pone.0250715 · Cited by 4
Lu, K., Bhat, M., Peters, S. B., Mitra, R. B., Mo, X. M., Oberyszyn, T. M., Dasgupta, P., & Basu, S. (2021) · Cancer Prevention Research · doi:10.1158/1940-6207.capr-21-0052 · Cited by 4
Exosomes: Mediators of bone diseases, protection, and therapeutics potential
(2018) · Oncoscience · doi:10.18632/oncoscience.409 · Cited by 4
A review of the differing roles of dead and live osteocytes
Komori, T. (2014) · Journal of Oral Biosciences · doi:10.1016/j.job.2014.05.001 · Cited by 4
Self-citationCCN Proteins as Matricellular Regulators of Bone in Aging and Disease
Azees, P. A. A., Rajesh, R., Block, T. J., Dean, D. D., Yeh, C., Capitano, M. L., Kacena, M. A., Chen, X., & Marinković, M. (2025) · Current Osteoporosis Reports · doi:10.1007/s11914-025-00915-4 · Cited by 5
Altered post-fracture systemic bone loss in a mouse model of osteocyte dysfunction
Osipov, B., Emami, A. J., Cunningham, H. C., Orr, S. V., Lin, Y., Jbeily, E. H., Punati, R. S., Murugesh, D. K., Zukowski, H. M., Loots, G. G., et al. (2024) · JBMR Plus · doi:10.1093/jbmrpl/ziae135 · Cited by 3
Effects of anti-sclerostin antibody and running on bone remodeling and strength
Toumi, H., Benaîtreau, D., Pallu, S., Mazor, M., Hambli, R., Ominsky, M. S., & Lespessailles, É. (2015) · Bone Reports · doi:10.1016/j.bonr.2015.03.002 · Cited by 3
Dental Implants and Osseous Healing in the Oral Cavity
Matsuura, T., & Yamashita, J. (2018) · Primer on the metabolic bone diseases and disorders of mineral metabolism · doi:10.1002/9781119266594.ch123 · Cited by 3
A novel stromal cell source of RANKL during sustained osteoclast activation in disuse osteoporosis
Gochi, K., Sumiya, E., Sakitani, N., Otsuka, Y., Muratani, M., Sawa, S., Ochi, H., Sawada, Y., Nakahama, K., & Shinohara, M. (2026) · The Journal of Physiology · doi:10.1113/jp289268 · Cited by 2
Pei, S., Wasi, M., Wang, S., Chu, T., Guerra, R. M., & Wang, L. (2023) · Elsevier eBooks · doi:10.1016/b978-0-323-96123-3.00010-5 · Cited by 3
Ma, J., Wen, J., Qiu, Y., Wang, Y., Liu, T., Xiao, Q., Zhang, D., Zhao, Y., Li, J., Li, J., et al. (2025) · Geriatric Nursing · doi:10.1016/j.gerinurse.2025.103451 · Cited by 1
The Mass Transfer Within the Lacunar-canalicular System of Rats Under Simulated Microgravity
Xiong, B., Liu, B., Wang, X., Ye, J., Gao, L., Li, X., & Zhang, C. (2025) · Microgravity Science and Technology · doi:10.1007/s12217-025-10206-3 · Cited by 1
Integrated spatiotemporal transcriptomic resolution of embryonic palate osteogenesisPreprint
Oliver, J. D., Raju, R., Roth, D. M., Chattaraj, P., Kidwai, F. K., Faucz, F. R., Iben, J., Mitra, A., Campbell, K. S., Fridell, G., et al. (2023) · bioRxiv (Cold Spring Harbor Laboratory) · doi:10.1101/2023.03.30.534875 · Cited by 1
Tobias, J. H., & Gregson, C. L. (2016) · Journal of Bone and Mineral Research · doi:10.1002/jbmr.3032
de Oliveira, K. M. H. (2018) · Digital Library of Theses and Dissertations (Universidade de São Paulo) · doi:10.11606/t.58.2018.tde-27022018-152210
Pathophysiology of osteoporosis
Streeten, E. A., Jaimungal, S., & Hochberg, M. C. (2015) · Elsevier eBooks · doi:10.1016/b978-0-323-09138-1.00199-6
Babalian, V. O., Pavlov, S., & Khvysyuk, О. (2020) · ORTHOPAEDICS TRAUMATOLOGY and PROSTHETICS · doi:10.15674/0030-59872020188-98
Surowiec, R. K. (2019) · Deep Blue (University of Michigan)
(2018) · Elsevier eBooks · doi:10.1016/b978-3-437-22102-6.00004-4
Metadata
- Authors
- Moriishi, T., Fukuyama, R., Ito, M., Miyazaki, T., Maeno, T., Kawai, Y., Komori, H., & Komori, T.
- Affiliations
- Nagasaki University (JP)
- Hiroshima International University (JP)
- Osaka City University (JP)
- Corresponding author
- Komori, Toshihisa
- Venue
- PLoS ONE
- Publisher
- Public Library of Science (PLoS)
- Published
- 2012-06-29
- Volume
- 7
- Issue
- 6
- Pages
- e40143
- ISSN
- 1932-6203 (ISSN-L)
- PMC
- PMC3387151
- OpenAlex
- W1964279564
- Cited by
- 105
- References
- 55
- Citations by year
- 2026: 2 · 2025: 5 · 2024: 7 · 2023: 8 · 2022: 7 · 2021: 13 · 2020: 9 · 2019: 6 · 2018: 8 · 2017: 5 · 2016: 6 · 2015: 12 · 2014: 11 · 2013: 6
- FWCI
- 3.72
- Type
- journal article
- Language
- en
- Open access
- gold
- doi.org
- Locations
- PLoS ONE (publishedVersion, cc-by)
- Europe PMC (PubMed Central) (publishedVersion, cc-by)
- PubMed Central (publishedVersion, cc-by)
- PubMed (publishedVersion)
- Institutional Repositories DataBase (IRDB) (publishedVersion, other-oa)
- DOAJ (DOAJ: Directory of Open Access Journals) (submittedVersion, cc-by-sa)
- Figshare (submittedVersion, cc-by)
- Nagasaki University's Academic Output SITE (Nagasaki University) (submittedVersion, cc-by-nc-nd)
- Funders
- Nakatomi Foundation
- Ministry of Education, Culture, Sports, Science and Technology
- Japan Society for the Promotion of Science (24659829, 22249062)
- Topics
- Life Sciences › Biochemistry, Genetics and Molecular Biology › Molecular Biology › Bone Metabolism and Diseases
- Health Sciences › Medicine › Orthopedics and Sports Medicine › Bone health and osteoporosis research
- Health Sciences › Medicine › Physiology (medical) › Spaceflight effects on biology
- Keywords
- osteocyte network, osteocyte apoptosis, Bcl-2, osteoblast activity, osteoclastogenesis, RANKL, sclerostin, osteoporosis, mechanical unloading, mechanotransduction, bone mass regulation, trabecular bone, cortical bone
- MeSH terms
- Animals, Bone and Bones, Bone Resorption, Cell Count, Cell Differentiation, Glycoproteins, Humans, Immunohistochemistry, Mice, Transgenic, Models, Biological, Organ Size, Osteoblasts, Osteocytes, Osteogenesis, Up-Regulation, Apoptosis, Transgenes, Proto-Oncogene Proteins c-bcl-2, Hindlimb Suspension, Reverse Transcriptase Polymerase Chain Reaction, In Situ Nick-End Labeling, Intercellular Signaling Peptides and Proteins, Adaptor Proteins, Signal Transducing, Mice, RANK Ligand, X-Ray Microtomography, Real-Time Polymerase Chain Reaction
About these checks
Registry, retraction, Cites and statistics results are computed, not judged, with one exception: a printed reference that no index lists is read once by a model before it counts as a citation error. Claims are extracted by a model and kept only when their quote appears verbatim in the text; each cited source is then checked, with a model’s help, for whether it says what the claim relies on. Those verdicts can be wrong — read the claim’s quote and the cited source before relying on one.
Statistics and arithmetic are recomputed, not judged.
Confidence bands are shown only for fields calibrated on our annotated test set. None is calibrated yet, so no band is shown.
What counts as a claim ›How we measure confidence ›How we check this ›
Are you an author, or do you see a problem with this page? Request a review
