

Auditory Processing in High-Functioning Adolescents with Autism Spectrum Disorder
Open accessThe DOI matches its Crossref record; 148 of the 148 references it cites were found in a registry or an index.
Abstract
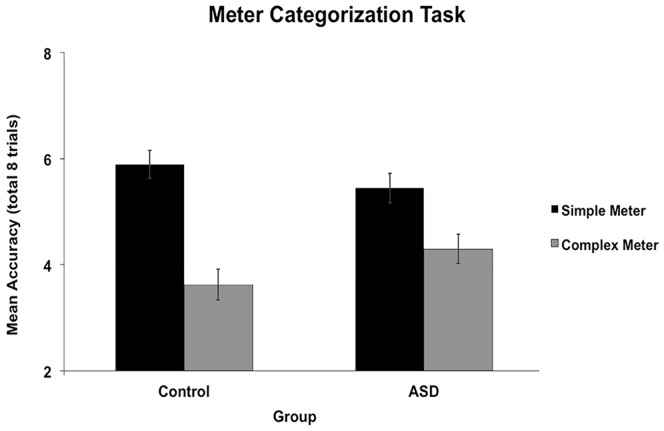
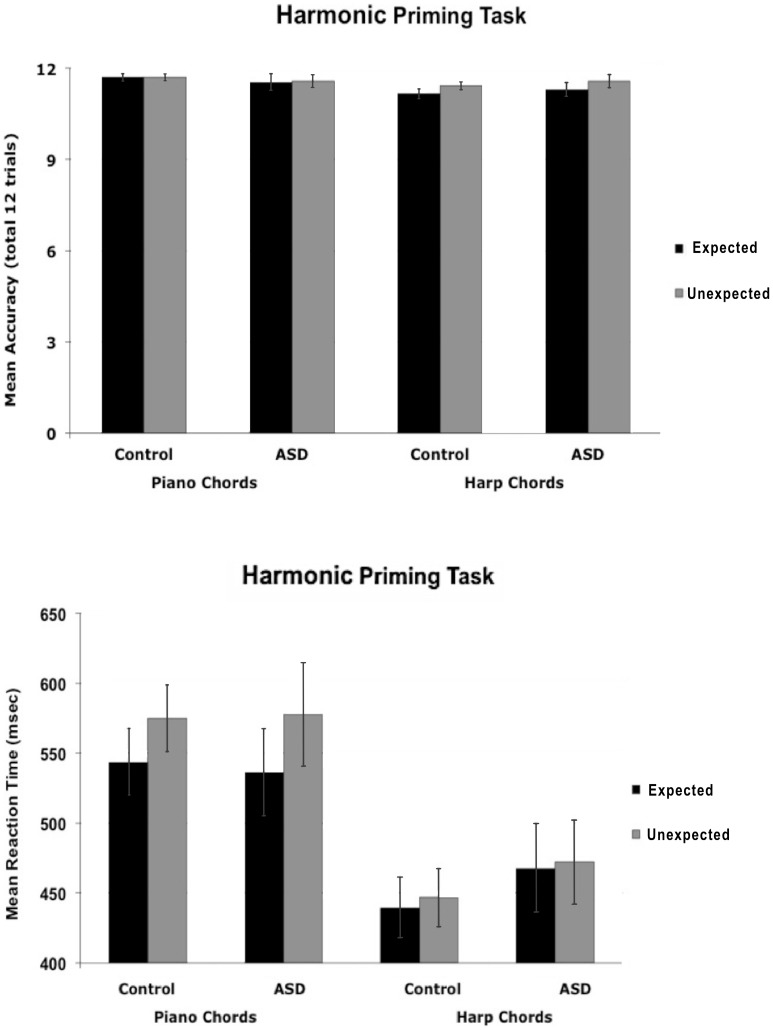
Autism Spectrum Disorder (ASD) is a pervasive developmental disorder including abnormalities in perceptual processing. We measure perception in a battery of tests across speech (filtering, phoneme categorization, multisensory integration) and music (pitch memory, meter categorization, harmonic priming). We found that compared to controls, the ASD group showed poorer filtering, less audio-visual integration, less specialization for native phonemic and metrical categories, and a higher instance of absolute pitch. No group differences were found in harmonic priming. Our results are discussed in a developmental framework where culture-specific knowledge acquired early compared to late in development is most impaired, perhaps because of early-accelerated brain growth in ASD. These results suggest that early auditory remediation is needed for good communication and social functioning.
Overview
The claims and statistics of this paper haven’t been checked yet.
Free: it reads the open-access text and checks the first 5 claims that cite a source we can check. Create a free account to check every claim.
Integrity signals
Registry
Cites
Statistics
Figures


Verification
Claims the paper makes
The claims and statistics of this paper haven’t been checked yet.
Free: it reads the open-access text and checks the first 5 claims that cite a source we can check. Create a free account to check every claim.
Claims other papers make about this one
Each is checked against this paper’s own text: does it say what the citing paper says it does?
In the citing paper
“These hypersensitivities cannot be explained as outcomes of abnormally enhanced sensation (29 -31).”
From Autism as a disorder of prediction (2014) · cites this paper as [29]
Self-check
Percentages, sums and reported differences re-computed from the paper’s own numbers.
The self-check needs the paper’s full text.
Citations
Cites
Proceedings of the National Academy of Sciences of the United States of America
Dowling, J. E., & Wald, G. (2009) · Nutrition Reviews · doi:10.1111/j.1753-4887.1981.tb06752.x · Cited by 17,893
The Proceedings of the National Academy of Sciences
Richards, J. W. (1915) · Science · doi:10.1126/science.42.1074.161 · Cited by 13,983
Lord, C., Rutter, M., & Le Couteur, A. (1994) · Journal of Autism and Developmental Disorders · doi:10.1007/bf02172145 · Cited by 9,065 · cited 1×
“Among the ASD group, 16 participants had diagnoses (ADOS and ADI) [88,89] that were completed at the Offord Centre in Hamilton and 11 confirmed through a letter from their family doctor (diagnosis outside of Hamilton) because ADOS and ADI scores were not available.”
MethodHearing lips and seeing voices
MCGURK, H., & MACDONALD, J. (1976) · Nature · doi:10.1038/264746a0 · Cited by 6,183 · cited 2×
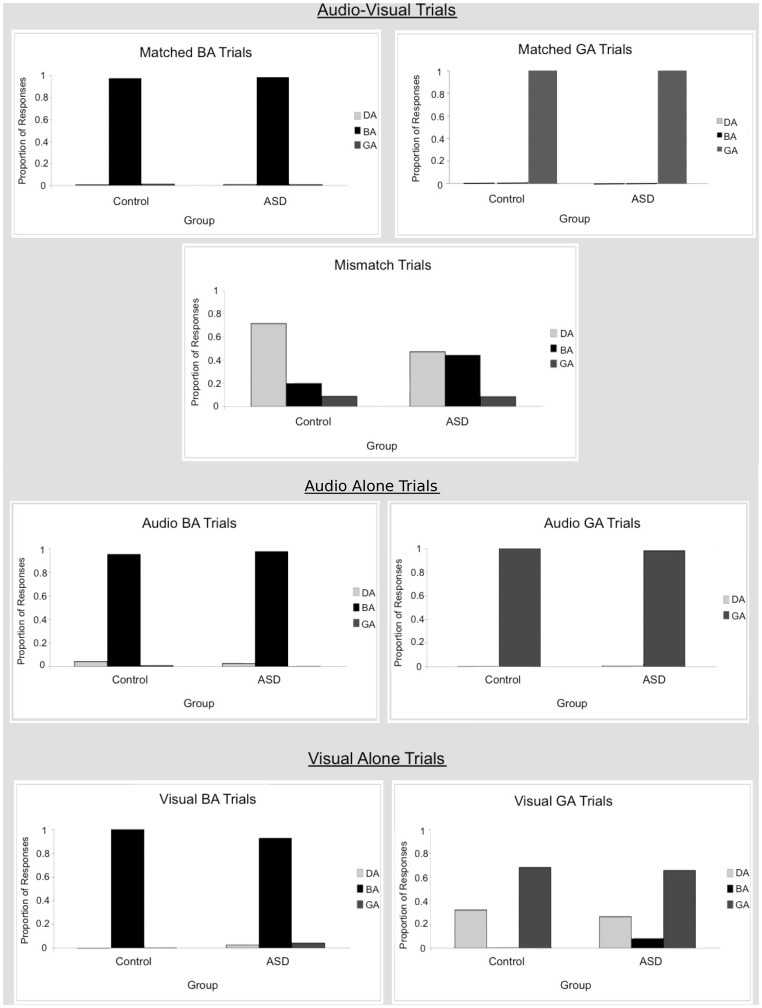
“For example, when presented with a visual ‘‘ga’’ and an audio ‘‘ba’’, people report hearing a third percept ‘‘da’’ which represents a fusion between what they see and what they hear [58].”
THE JOURNAL OF THE AMERICAN MEDICAL ASSOCIATION
(1911) · Journal of the American Medical Association · doi:10.1001/jama.1911.04260070032017 · Cited by 3,361
American Journal of Mental Retardation
Staff (2008) · Encyclopedia of Special Education · doi:10.1002/9780470373699.speced0106 · Cited by 2,972
The weak coherence account: detail-focused cognitive style in autism spectrum disorders
Happé, F., & Frith, U. (2006) · Journal of Autism and Developmental Disorders · doi:10.1007/s10803-005-0039-0 · Cited by 2,884
Philosophical Transactions of the Royal Society B: biological sciences
(2026) · Philosophical Transactions of the Royal Society B Biological Sciences · doi:10.1098/rstb · Cited by 2,876
(1989) · UCL Discovery (University College London) · Cited by 2,724
Quest: A Bayesian adaptive psychometric method
Watson, A. B., & Pelli, D. G. (1983) · Perception & Psychophysics · doi:10.3758/bf03202828 · Cited by 2,410 · cited 1×
“A Bayesian adaptive psychometric procedure [99] was used such that the test ended when the standard deviation of the signal threshold estimate reached 1.”
Method
Cited by
Autism Spectrum Disorder: Classification, diagnosis and therapy
Sharma, S. R., Gonda, X., & Tarazi, F. I. (2018) · Pharmacology & Therapeutics · doi:10.1016/j.pharmthera.2018.05.007 · Cited by 673
Autism as a disorder of prediction
Sinha, P., Kjelgaard, M. M., Gandhi, T. K., Tsourides, K., Cardinaux, A. L., Pantazis, D., Diamond, S. P., & Held, R. M. (2014) · Proceedings of the National Academy of Sciences · doi:10.1073/pnas.1416797111 · Cited by 563
Foxe, J. J., Molholm, S., Del Bene, V. A., Frey, H.-P., Russo, N. N., Blanco, D., Saint-Amour, D., & Ross, L. A. (2015) · Cerebral Cortex · doi:10.1093/cercor/bht213 · Cited by 263
“In a similar vein, DePape et al. (2012) asked ASD adolescents (n = 27) to repeat sentences presented to one ear while they tried to ignore competing sentences presented to the other ear.”
BackgroundVeridical mapping in the development of exceptional autistic abilities
Mottron, L., Bouvet, L., Bonnel, A., Samson, F., Burack, J. A., Dawson, M., & Heaton, P. (2013) · Neuroscience & Biobehavioral Reviews · doi:10.1016/j.neubiorev.2012.11.016 · Cited by 234
DePape, A.-M., & Lindsay, S. (2016) · Focus on Autism and Other Developmental Disabilities · doi:10.1177/1088357615587504 · Cited by 153
“These problems are documented in other research reporting sensory and perceptual problems among those with ASD (DePape, Hall, Tillmann, & Trainor, 2012; Kern et al., 2006).”
BackgroundSelf-citation
Metadata
- Authors
- DePape, A.-M. R., Hall, G. B. C., Tillmann, B., & Trainor, L. J.
- Affiliations
- McMaster University (CA)
- Lyon 1 Université (FR)
- Baycrest Hospital (CA)
- Corresponding author
- Trainor, Laurel J.
- Venue
- PLoS ONE
- Publisher
- Public Library of Science (PLoS)
- Published
- 2012-09-12
- Volume
- 7
- Issue
- 9
- Pages
- e44084
- ISSN
- 1932-6203 (ISSN-L)
- PMC
- PMC3440400
- OpenAlex
- W2050650787
- Cited by
- 139
- References
- 148
- Citations by year
- 2026: 5 · 2025: 13 · 2024: 18 · 2023: 13 · 2022: 14 · 2021: 10 · 2020: 9 · 2019: 14 · 2018: 7 · 2017: 8 · 2016: 1 · 2015: 7 · 2014: 11 · 2013: 6 · 2012: 2
- FWCI
- 4.25
- Type
- journal article
- Language
- en
- Open access
- gold
- doi.org
- Locations
- PLoS ONE (publishedVersion, cc-by)
- Europe PMC (PubMed Central) (publishedVersion, cc-by)
- PubMed Central (publishedVersion, cc-by)
- PubMed (publishedVersion)
- DOAJ (DOAJ: Directory of Open Access Journals) (submittedVersion, cc-by-sa)
- Funders
- Natural Sciences and Engineering Research Council of Canada
- Social Sciences and Humanities Research Council of Canada
- Topics
- Life Sciences › Neuroscience › Cognitive Neuroscience › Autism Spectrum Disorder Research
- Life Sciences › Neuroscience › Cognitive Neuroscience › Neuroscience and Music Perception
- Social Sciences › Psychology › Experimental and Cognitive Psychology › Multisensory perception and integration
- Keywords
- autism spectrum disorder, auditory processing, adolescents, auditory filtering, phoneme categorization, multisensory integration, audiovisual integration, pitch memory, absolute pitch, developmental framework
- MeSH terms
- Acoustic Stimulation, Adolescent, Auditory Perception, Child, Child Development Disorders, Pervasive, Demography, Humans, Male, Music, Phonetics, Speech Perception, Task Performance and Analysis, Signal-To-Noise Ratio
About these checks
Registry, retraction, Cites and statistics results are computed, not judged, with one exception: a printed reference that no index lists is read once by a model before it counts as a citation error. Claims are extracted by a model and kept only when their quote appears verbatim in the text; each cited source is then checked, with a model’s help, for whether it says what the claim relies on. Those verdicts can be wrong — read the claim’s quote and the cited source before relying on one.
Statistics and arithmetic are recomputed, not judged.
Confidence bands are shown only for fields calibrated on our annotated test set. None is calibrated yet, so no band is shown.
What counts as a claim ›How we measure confidence ›How we check this ›
Are you an author, or do you see a problem with this page? Request a review
How to cite
Cite CoChat for the checks on this page, and the paper for its own findings.
- This page
- CoChat. (2026). Citation check: Auditory Processing in High-Functioning Adolescents with Autism Spectrum Disorder. https://app.cochat.ai/papers/10.1371/journal.pone.0044084
- The paper
- DePape, A.-M. R., Hall, G. B. C., Tillmann, B., & Trainor, L. J. (2012). Auditory Processing in High-Functioning Adolescents with Autism Spectrum Disorder. PLoS ONE. https://doi.org/10.1371/journal.pone.0044084
Data sources
Bibliographic data: Semantic Scholar, OpenAlex, Crossref.
Contains information from the Semantic Scholar Academic Graph Datasets, made available under the ODC Attribution License (ODC-BY 1.0).
Semantic Scholar’s data is described in: Kinney, R., et al. (2023). The Semantic Scholar Open Data Platform. arXiv:2301.10140.
