

The DOI matches its Crossref record; 68 of the 68 references it cites were found in a registry or an index.
Dynamic Sounds Capture the Boundaries of Peripersonal Space Representation in Humans
Open accessAbstract
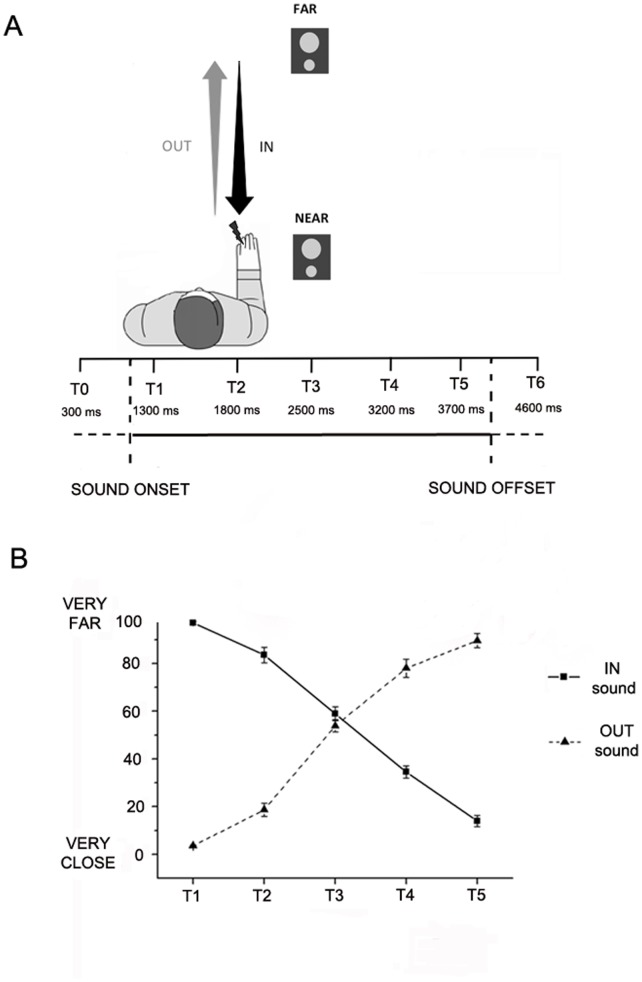
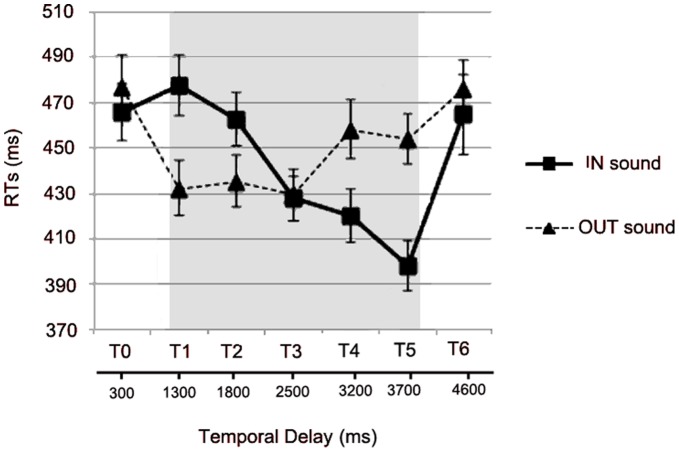
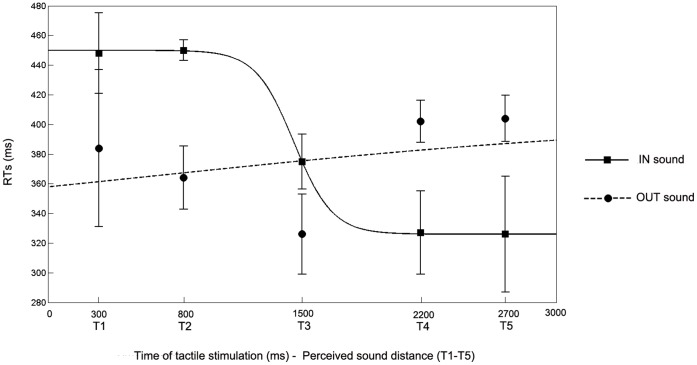
BACKGROUND: We physically interact with external stimuli when they occur within a limited space immediately surrounding the body, i.e., Peripersonal Space (PPS). In the primate brain, specific fronto-parietal areas are responsible for the multisensory representation of PPS, by integrating tactile, visual and auditory information occurring on and near the body. Dynamic stimuli are particularly relevant for PPS representation, as they might refer to potential harms approaching the body. However, behavioural tasks for studying PPS representation with moving stimuli are lacking. Here we propose a new dynamic audio-tactile interaction task in order to assess the extension of PPS in a more functionally and ecologically valid condition. METHODOLOGY/PRINCIPAL FINDINGS: Participants vocally responded to a tactile stimulus administered at the hand at different delays from the onset of task-irrelevant dynamic sounds which gave the impression of a sound source either approaching or receding from the subject's hand. Results showed that a moving auditory stimulus speeded up the processing of a tactile stimulus at the hand as long as it was perceived at a limited distance from the hand, that is within the boundaries of PPS representation. The audio-tactile interaction effect was stronger when sounds were approaching compared to when sounds were receding. CONCLUSION/SIGNIFICANCE: This study provides a new method to dynamically assess pps representation: The function describing the relationship between tactile processing and the position of sounds in space can be used to estimate the location of PPS boundaries, along a spatial continuum between far and near space, in a valuable and ecologically significant way.
Overview
The claims and statistics of this paper haven’t been checked yet.
Run the check — free, no account needed. It reads the open-access text and checks the sources it cites.
Integrity signals
Registry
Cites
Statistics
Figures
Verification
Claims the paper makes
The claims and statistics of this paper haven’t been checked yet.
Run the check — free, no account needed. It reads the open-access text and checks the sources it cites.
Claims other papers make about this one
Each is checked against this paper’s own text: does it say what the citing paper says it does?
In the citing paper
“We used an audio-tactile interaction task to identify the point in space where a looming sound speeded up tactile processing as a proxy of the boundaries of multisensory PPS (see Canzoneri et al., 2012; Canzoneri et al., 2013a; Canzoneri et al., 2013b; Teneggi et al., 2013, Noel et al., 2014).”
From Peripersonal space as the space of the bodily self (2015) · cites this paper as Canzoneri et al., 2012
Self-check
Percentages, sums and reported differences re-computed from the paper’s own numbers.
The self-check needs the paper’s full text.
Citations
Cites
Sound Localization by Human Listeners
Middlebrooks, J. C., & Green, D. M. (1991) · Annual Review of Psychology · doi:10.1146/annurev.ps.42.020191.001031 · Cited by 1,211
Complex Movements Evoked by Microstimulation of Precentral Cortex
Graziano, M. S. A., Taylor, C. S. R., & Moore, T. (2002) · Neuron · doi:10.1016/s0896-6273(02)00698-0 · Cited by 921
Coding of visual space by premotor neurons.
Graziano, M. S. A., Yap, G. S., & Gross, C. G. (1994) · Science · doi:10.1126/science.7973661 · Cited by 841
Afferent properties of periarcuate neurons in macaque monkeys. II. Visual responses.
Rizzolatti, G., Scandolara, C., Matelli, M., & Gentilucci, M. (1981) · Behavioural Brain Research · doi:10.1016/0166-4328(81)90053-x · Cited by 831
Polymodal Motion Processing in Posterior Parietal and Premotor Cortex
Bremmer, F., Schlack, A., Shah, N. J., Zafiris, O., Kubischik, M., Hoffmann, K.-P., Zilles, K., & Fink, G. R. (2001) · Neuron · doi:10.1016/s0896-6273(01)00198-2 · Cited by 803
Rizzolatti, G., Fadiga, L., Fogassi, L., & Gallese, V. (1997) · Science · doi:10.1126/science.277.5323.190 · Cited by 712
Ventral intraparietal area of the macaque: Anatomic location and visual response properties
Colby, C. L., Duhamel, J. R., & Goldberg, M. E. (1993) · Journal of Neurophysiology · doi:10.1152/jn.1993.69.3.902 · Cited by 701
Coding of peripersonal space in inferior premotor cortex (area F4).
Fogassi, L., Gallese, V., Fadiga, L., Luppino, G., Matelli, M., & Rizzolatti, G. (1996) · Journal of Neurophysiology · doi:10.1152/jn.1996.76.1.141 · Cited by 688 · cited 2×
“Second, this paradigm directly resembles the stimulations used in monkey neurophysiology to study PPS bimodal or trimodal neurons, where a visual or an auditory stimulus was presented, as approaching to or receding from the animal’s body part where the neuron’s tactile receptive field was located [6,8,9,11].”
BackgroundMethodParieto-frontal interactions, personal space, and defensive behavior
Graziano, M. S. A., & Cooke, D. F. (2006) · Neuropsychologia · doi:10.1016/j.neuropsychologia.2005.09.011 · Cited by 653
Spatial invariance of visual receptive fields in parietal cortex neurons
Duhamel, J., Bremmer, F., Hamed, S. B., & Graf, W. M. (1997) · Nature · doi:10.1038/39865 · Cited by 635
Cited by
Sorted by citations
Behavioral, Neural, and Computational Principles of Bodily Self-Consciousness
Blanke, O., Slater, M., & Serino, A. (2015) · Neuron · doi:10.1016/j.neuron.2015.09.029 · Cited by 698
Self-citationSerino, A. (2019) · Neuroscience & Biobehavioral Reviews · doi:10.1016/j.neubiorev.2019.01.016 · Cited by 304
Self-citationKolarik, A. J., Moore, B. C. J., Zahorik, P., Cirstea, S., & Pardhan, S. (2015) · Attention Perception & Psychophysics · doi:10.3758/s13414-015-1015-1 · Cited by 301
Social modulation of peripersonal space boundaries
Teneggi, C., Canzoneri, E., di Pellegrino, G., & Serino, A. (2013) · Current Biology · doi:10.1016/j.cub.2013.01.043 · Cited by 257
Self-citationTool-use reshapes the boundaries of body and peripersonal space representations
Canzoneri, E., Ubaldi, S., Rastelli, V., Finisguerra, A., Bassolino, M., & Serino, A. (2013) · Experimental Brain Research · doi:10.1007/s00221-013-3532-2 · Cited by 257
Self-citation
Metadata
- Authors
- Canzoneri, E., Magosso, E., & Serino, A.
- Affiliations
- University of Bologna (IT)
- Corresponding author
- Serino, Andrea
- Venue
- PLoS ONE
- Publisher
- Public Library of Science (PLoS)
- Published
- 2012-09-28
- Volume
- 7
- Issue
- 9
- Pages
- e44306
- ISSN
- 1932-6203 (ISSN-L)
- PMC
- PMC3460958
- OpenAlex
- W1996403482
- Cited by
- 248
- References
- 68
- Citations by year
- 2026: 18 · 2025: 25 · 2024: 17 · 2023: 13 · 2022: 16 · 2021: 34 · 2020: 25 · 2019: 20 · 2018: 24 · 2017: 15 · 2016: 10 · 2015: 16 · 2014: 10 · 2013: 5
- FWCI
- 13.31
- Type
- journal article
- Language
- en
- Open access
- gold
- doi.org
- Locations
- PLoS ONE (publishedVersion, cc-by)
- PubMed Central (publishedVersion, cc-by)
- PubMed (publishedVersion)
- Archivio istituzionale della ricerca (Alma Mater Studiorum Università di Bologna) (submittedVersion)
- DOAJ (DOAJ: Directory of Open Access Journals) (submittedVersion, cc-by-sa)
- Topics
- Social Sciences › Psychology › Experimental and Cognitive Psychology › Multisensory perception and integration
- Life Sciences › Neuroscience › Cognitive Neuroscience › Tactile and Sensory Interactions
- Physical Sciences › Computer Science › Human-Computer Interaction › Virtual Reality Applications and Impacts
- Keywords
- peripersonal space, tactile processing, multisensory integration, frontoparietal cortex, spatial perception, ecological validity
- MeSH terms
- Acoustic Stimulation, Adult, Brain, Female, Humans, Male, Personal Space, Physical Stimulation, Sound Localization, Space Perception, Touch, Young Adult
About these checks
Registry, retraction, Cites and statistics results are computed, not judged, with one exception: a printed reference that no index lists is read once by a model before it counts as a citation error. Claims are extracted by a model and kept only when their quote appears verbatim in the text; each cited source is then checked, with a model’s help, for whether it says what the claim relies on. Those verdicts can be wrong — read the claim’s quote and the cited source before relying on one.
Statistics and arithmetic are recomputed, not judged.
Confidence bands are shown only for fields calibrated on our annotated test set. None is calibrated yet, so no band is shown.
What counts as a claim ›How we measure confidence ›How we check this ›
Are you an author, or do you see a problem with this page? Request a review
