

The DOI matches its Crossref record; 34 of the 34 references it cites were found in a registry or an index.
Age- and sex-related variations in platelet count in Italy: a proposal of reference ranges based on 40987 subjects’ data
Abstract
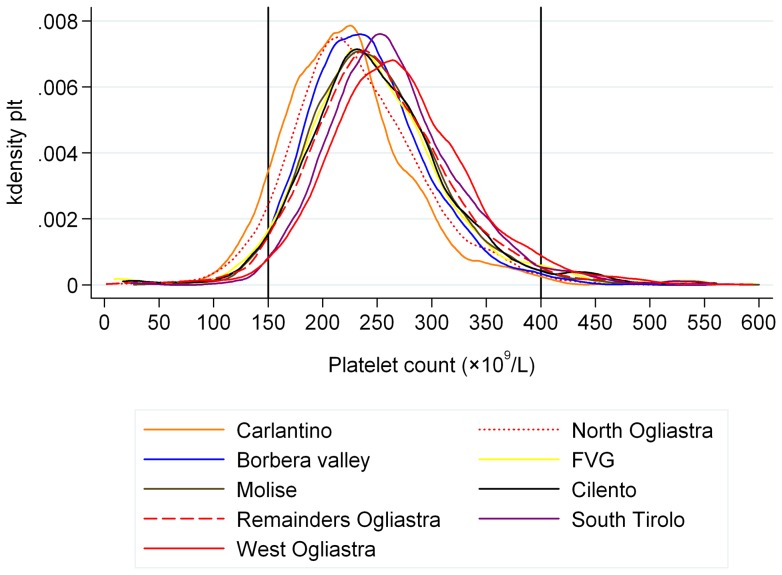
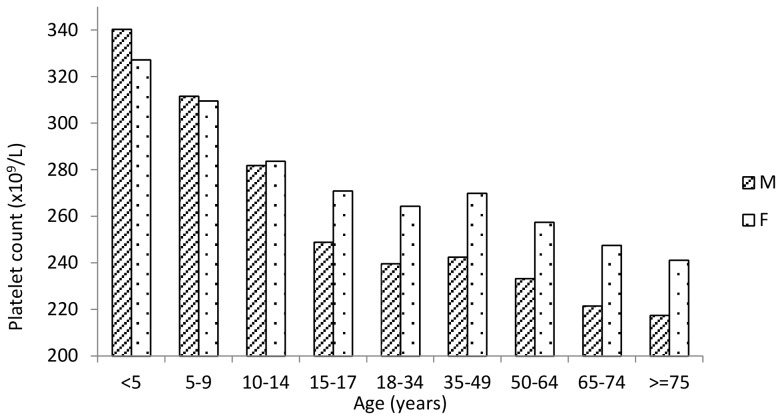
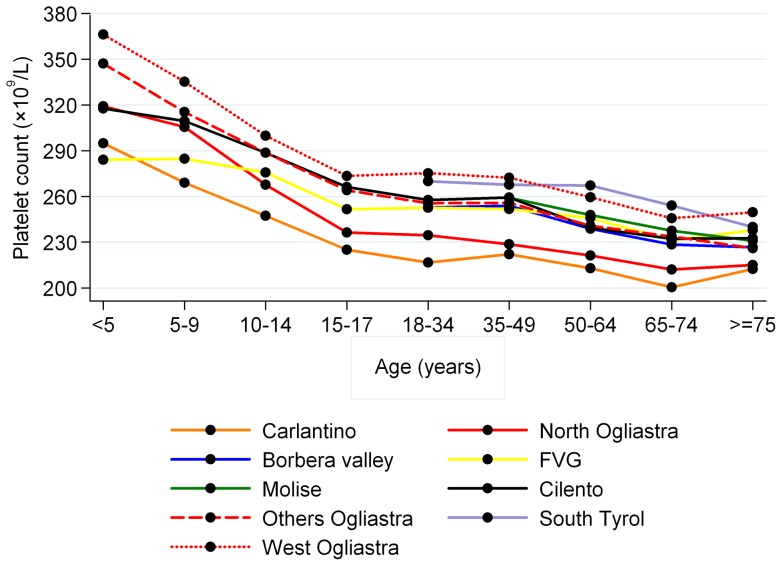
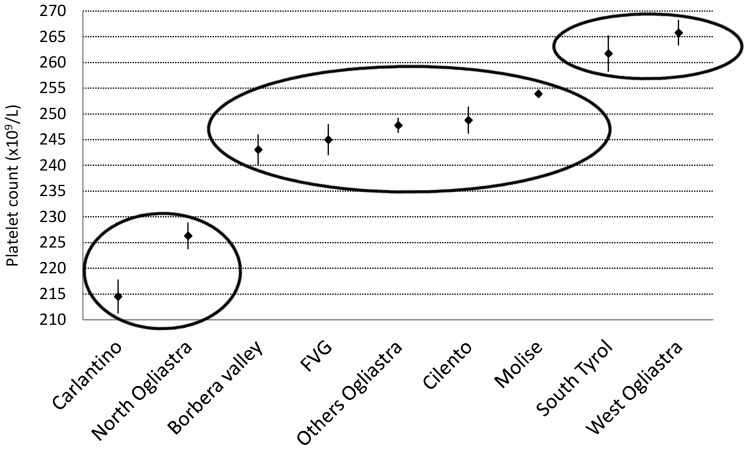
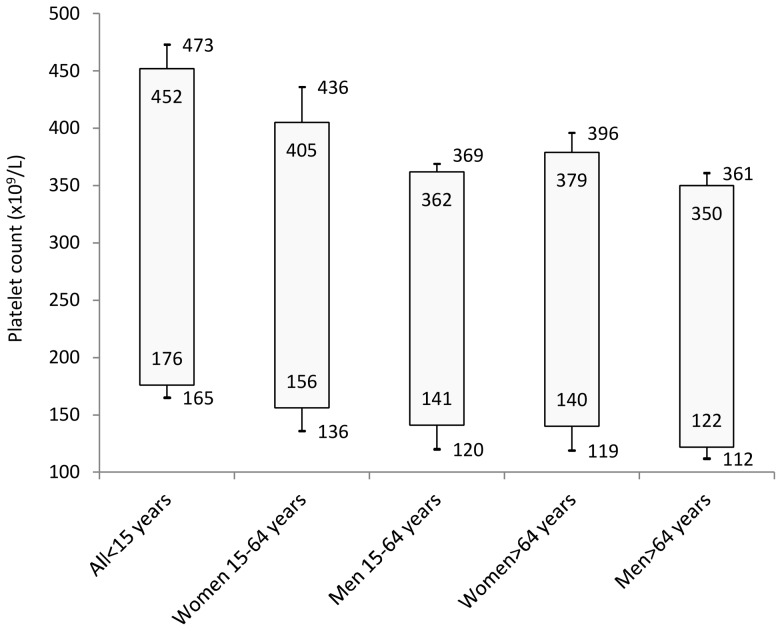
BACKGROUND AND OBJECTIVES: Although several studies demonstrated that platelet count is higher in women, decreases with age, and is influenced by genetic background, most clinical laboratories still use the reference interval 150-400×10(9) platelets/L for all subjects. The present study was to identify age- and sex-specific reference intervals for platelet count. METHODS: We analysed electronic records of subjects enrolled in three population-based studies that investigated inhabitants of seven Italian areas including six geographic isolates. After exclusion of patients with malignancies, liver diseases, or inherited thrombocytopenias, which could affect platelet count, reference intervals were estimated from 40,987 subjects with the non parametric method computing the 2.5° and 97.5° percentiles. RESULTS: Platelet count was similar in men and women until the age of 14, but subsequently women had steadily more platelets than men. The number of platelets decreases quickly in childhood, stabilizes in adulthood, and further decreases in oldness. The final result of this phenomenon is that platelet count in old age was reduced by 35% in men and by 25% in women compared with early infancy. Based on these findings, we estimated reference intervals for platelet count ×10(9)/L in children (176-452), adult men (141-362), adult women (156-405), old men (122-350) and, old women (140-379). Moreover, we calculated an "extended" reference interval that takes into account the differences in platelet count observed in different geographic areas. CONCLUSIONS: The age-, sex-, and origin-related variability of platelet count is very wide, and the patient-adapted reference intervals we propose change the thresholds for diagnosing both thrombocytopenia and thrombocytosis in Italy.
Overview
The claims and statistics of this paper haven’t been checked yet.
Run the check — free, no account needed. It reads the open-access text and checks the sources it cites.
Integrity signals
Registry
Cites
Statistics
Figures
Verification
Claims the paper makes
The claims and statistics of this paper haven’t been checked yet.
Run the check — free, no account needed. It reads the open-access text and checks the sources it cites.
Claims other papers make about this one
Each is checked against this paper’s own text: does it say what the citing paper says it does?
In the citing paper
“consistent with phenotypic parameters that are frequently observed in human aged non-malignant hematopoiesis, but which are not typically manifest in experimental mice housed under laboratory conditions”
From Inflammatory exposure drives long-lived impairment of hematopoietic stem cell self-renewal activity and accelerated aging (2022) · cites this paper as Biino et al., 2013
Self-check
Percentages, sums and reported differences re-computed from the paper’s own numbers.
The self-check needs the paper’s full text.
Citations
Cites
National Committee for Clinical Laboratory Standards
Bruck, E. (1980) · Pediatrics · doi:10.1542/peds.65.1.187 · Cited by 14,751
Influence of Statistical Method Used on the Resulting Estimate of Normal Range
Reed, A. H., Henry, R. J., & Mason, W. B. (1971) · Clinical Chemistry · doi:10.1093/clinchem/17.4.275 · Cited by 531
Soranzo, N., Spector, T. D., Mangino, M., Kuehnel, B., Rendon, A., Teumer, A., Willenborg, C., Wright, B. J., Chen, L., Li, M., et al. (2009) · Nature Genetics · doi:10.1038/ng.467 · Cited by 527
New gene functions in megakaryopoiesis and platelet formation
Gieger, C., Radhakrishnan, A., Cvejic, A., Tang, W., Porcu, E., Pistis, G., Serbanovic‐Canic, J., Elling, U., Goodall, A. H., Labrune, Y., et al. (2011) · Nature · doi:10.1038/nature10659 · Cited by 410
Self-citationEthnic and sex differences in the total and differential white cell count and platelet count.
Bain, B. J. (1996) · Journal of Clinical Pathology · doi:10.1136/jcp.49.8.664 · Cited by 388
Platelet Counts Differ by Sex, Ethnicity, and Age in the United States
Segal, J. B., & Moliterno, A. R. (2005) · Annals of Epidemiology · doi:10.1016/j.annepidem.2005.06.052 · Cited by 289
The IFCC recommendation on estimation of reference intervals. The RefVal Program
Solberg, H. E. (2004) · Clinical Chemistry and Laboratory Medicine (CCLM) · doi:10.1515/cclm.2004.121 · Cited by 258
The Platelet Count and Mean Platelet Volume
Giles, C. (1981) · British Journal of Haematology · doi:10.1111/j.1365-2141.1981.00031.x · Cited by 241
Cheng, C. K.-W., Chan, J., Cembrowski, G. S., & van Assendelft, O. W. (2004) · Laboratory Hematology · doi:10.1532/lh96.04010 · Cited by 222
Tepper, B. J., Koelliker, Y., Zhao, L., Ullrich, N. V., Lanzara, C., D’Adamo, P., Ferrara, A., Ulivi, S., Esposito, L., & Gasparini, P. (2008) · Obesity · doi:10.1038/oby.2008.357 · Cited by 195
Self-citationImmunohematological Reference Ranges for Adult Ethiopians
Tsegaye, A., Messele, T., Tilahun, T., et al. (1999) · Clinical and Diagnostic Laboratory Immunology · doi:10.1128/cdli.6.3.410-414.1999 · Cited by 195
Santimone, I., Castelnuovo, A. F. D., Curtis, A. D., Spinelli, M., Cugino, D., Gianfagna, F., Zito, F., Donati, M. B., Cerletti, C., de Gaetano, G., et al. (2011) · Haematologica · doi:10.3324/haematol.2011.043042 · Cited by 186
Self-citationA Novel Approach to the Assessment of Variations in the Human Platelet Count
James, J. W., Brown, D., Whyte, G. S., Dean, M., Chesterman, C., Donald, J. A., & Buckley, M. F. (2000) · Thrombosis and Haemostasis · doi:10.1055/s-0037-1613840 · Cited by 143
Erythropoietin and platelet production.
Beguin, Y. P. (1999) · PubMed · Cited by 122
Platelet parameters in women with iron deficiency anemia.
Kadıköylü, G., Yavaşoğlu, İ., Bolaman, Z., & Şentürk, T. (2006) · PubMed Central · Cited by 115
Qayyum, R., Snively, B. M., Ziv, E., Nalls, M. A., Liu, Y., Tang, W., Yanek, L. R., Lange, L. A., Evans, M. K., Ganesh, S. K., et al. (2012) · PLoS Genetics · doi:10.1371/journal.pgen.1002491 · Cited by 109
Proplatelet formation of megakaryocytes is triggered by autocrine-synthesized estradiolPreprint
Nagata, Y., Yoshikawa, J., Hashimoto, A., Yamamoto, M. P., Payne, A. H., & Todokoro, K. (2003) · Genes & Development · doi:10.1101/gad.1128003 · Cited by 108
Stasi, R., Amadori, S., Osborn, J., Newland, A. C., & Provan, D. (2006) · PLoS Medicine · doi:10.1371/journal.pmed.0030024 · Cited by 104
Immunohematological Reference Ranges for Adults from the Central African Republic
Ménard, D., Mandeng, M.-J., Tothy, M. B., Kassa-Kelembho, E., Grésenguet, G., & Talarmin, A. (2003) · Clinical and Vaccine Immunology · doi:10.1128/cdli.10.3.443-445.2003 · Cited by 97
Biino, G., Balduini, C. L., Casula, L., Cavallo, P., Vaccargiu, S., Parracciani, D., Serra, D., Portas, L., Murgia, F., & Pirastu, M. (2010) · Haematologica · doi:10.3324/haematol.2010.029934 · Cited by 89
Self-citationGirotto, G., Pirastu, N., Sorice, R., Biino, G., Campbell, H., D’Adamo, P., Hastie, N. D., Nutile, T., Polašek, O., Portas, L., et al. (2011) · Journal of Medical Genetics · doi:10.1136/jmg.2010.088310 · Cited by 81
Self-citationPattaro, C., Marroni, F., Riegler, A., Mascalzoni, D., Pichler, I., Volpato, C. B., Cero, U. D., Grandi, A. D., Egger, C., Eisendle, A., et al. (2007) · BMC Medical Genetics · doi:10.1186/1471-2350-8-29 · Cited by 77
Self-citationPlatelet Counting by the Coulter LH 750, Sysmex XE 2100, and Advia 120
Sandhaus, L. M., Osei, E. S., Agrawal, N. N., Dillman, C. A., & Meyerson, H. J. (2002) · American Journal of Clinical Pathology · doi:10.1309/mk3g-mc3v-p06r-pnv2 · Cited by 76
A Sex Difference in the Platelet Count
Stevens, R., & Alexander, M. (1977) · British Journal of Haematology · doi:10.1111/j.1365-2141.1977.tb06847.x · Cited by 73
Ishiguro, A., Nakahata, T., Matsubara, K., Hayashi, Y., Kato, T., Suzuki, Y., & Shimbo, T. (1999) · British Journal of Haematology · doi:10.1046/j.1365-2141.1999.01641.x · Cited by 64
Traglia, M., Sala, C. F., Masciullo, C., Cverhova, V., Lori, F., Pistis, G., Bione, S., Gasparini, P., Ulivi, S., Ciullo, M., et al. (2009) · PLoS ONE · doi:10.1371/journal.pone.0007554 · Cited by 46
Self-citationComparing population structure as inferred from genealogical versus genetic information
Colonna, V., Nutile, T., Ferrucci, R. R., Fardella, G., Aversano, M., Barbujani, G., & Ciullo, M. (2009) · European Journal of Human Genetics · doi:10.1038/ejhg.2009.97 · Cited by 43
Self-citationAutomated Platelet-Sizing Parameters on a Normal Population
Graham, S. S., Traub, B., & Mink, I. B. (1987) · American Journal of Clinical Pathology · doi:10.1093/ajcp/87.3.365 · Cited by 41
Biino, G., Gasparini, P., D’Adamo, P., Ciullo, M., Nutile, T., Toniolo, D., Sala, C. F., Minelli, C., Gögele, M., & Balduini, C. L. (2011) · British Journal of Haematology · doi:10.1111/j.1365-2141.2011.08981.x · Cited by 37
Self-citationPopulation‐based platelet reference values for an Iranian population
Adibi, P., IMANI, E. F., Talaei, M., & Ghanei, M. (2007) · International Journal of Laboratory Hematology · doi:10.1111/j.1751-553x.2006.00843.x · Cited by 37
The Influence of Age upon Serum Iron in Normal Subjects
Pirrie, R. (1952) · Journal of Clinical Pathology · doi:10.1136/jcp.5.1.10 · Cited by 36
Pistis, G., Piras, I. S., Pirastu, N., Persico, I., Sassu, A., Picciau, A., Prodi, D. A., Fraumene, C., Mocci, E., Manias, M. T., et al. (2009) · PLoS ONE · doi:10.1371/journal.pone.0004654 · Cited by 34
Self-citationCampora: A Young Genetic Isolate in South Italy
Colonna, V., Nutile, T., Astore, M., Guardiola, O., Antoniol, G., Ciullo, M., & Persico, M. G. (2007) · Human Heredity · doi:10.1159/000101964 · Cited by 31
Self-citationEffects of biological variations on platelet count in healthy subjects in China
Yang, J., Lu, X., Okada, T., Kondo, T., Ruan, C., Wu, Y., Xin, X., & Peng, L. (2003) · Thrombosis and Haemostasis · doi:10.1160/th03-05-0276 · Cited by 29
Research works printed but not linked: 1
- Dacie JV, Lewis SM (1991) Practical Haematology, Seventh Edition. London: Churchill Livingstone. 668 p.
Cited by
Integrative Analysis of Drug Response and Clinical Outcome in Acute Myeloid Leukemia
Bottomly, D., Long, N., Schultz, A. R., Kurtz, S. E., Tognon, C. E., Johnson, K., Abel, M., Agarwal, A., Avaylon, S., Benton, E., et al. (2022) · Cancer Cell · doi:10.1016/j.ccell.2022.07.002 · Cited by 403
Bogeska, R., Mikecin, A.-M., Kaschutnig, P., Fawaz, M., Büchler-Schäff, M., Le, D., Ganuza, M., Vollmer, A., Paffenholz, S. V., Asada, N., et al. (2022) · Cell Stem Cell · doi:10.1016/j.stem.2022.06.012 · Cited by 299
Platelets: The missing link between the blood and brain?
Leiter, O., & Walker, T. L. (2019) · Progress in Neurobiology · doi:10.1016/j.pneurobio.2019.101695 · Cited by 103
Altered functions of platelets during aging
Montenont, E., Rondina, M. T., & Campbell, R. A. (2019) · Current Opinion in Hematology · doi:10.1097/moh.0000000000000526 · Cited by 66
Roadmap for alleviating the manifestations of ageing in the cardiovascular system
Liberale, L., Tual-Chalot, S., Sedej, S., Ministrini, S., Georgiopoulos, G., Grunewald, M., Bäck, M., Bochaton-Piallat, M.-L., Boon, R. A., Ramos, G. C., et al. (2025) · Nature Reviews Cardiology · doi:10.1038/s41569-025-01130-5 · Cited by 59
Metadata
- Authors
- Biino, G., Santimone, I., Minelli, C., Sorice, R., Frongia, B., Traglia, M., Ulivi, S., Di Castelnuovo, A., Gögele, M., Nutile, T., Francavilla, M., Sala, C., Pirastu, N., Cerletti, C., Iacoviello, L., Gasparini, P., Toniolo, D., Ciullo, M., Pramstaller, P., Pirastu, M., de Gaetano, G., & Balduini, C. L.
- Venue
- PLoS ONE
- Publisher
- Public Library of Science (PLoS)
- Published
- 2013-01-31
- Volume
- 8
- Issue
- 1
- Pages
- e54289
- ISSN
- 1932-6203
- PMC
- PMC3561305
- Cited by
- 227
- References
- 34
- Language
- en
About these checks
Registry, retraction, Cites and statistics results are computed, not judged, with one exception: a printed reference that no index lists is read once by a model before it counts as a citation error. Claims are extracted by a model and kept only when their quote appears verbatim in the text; each cited source is then checked, with a model’s help, for whether it says what the claim relies on. Those verdicts can be wrong — read the claim’s quote and the cited source before relying on one.
Statistics and arithmetic are recomputed, not judged.
Confidence bands are shown only for fields calibrated on our annotated test set. None is calibrated yet, so no band is shown.
What counts as a claim ›How we measure confidence ›How we check this ›
Are you an author, or do you see a problem with this page? Request a review
Data sources
Bibliographic data: Semantic Scholar, OpenAlex, Crossref.
Contains information from the Semantic Scholar Academic Graph Datasets, made available under the ODC Attribution License (ODC-BY 1.0).
Semantic Scholar’s data is described in: Kinney, R., et al. (2023). The Semantic Scholar Open Data Platform. arXiv:2301.10140.
