Cited by 113Epilepsy research and treatmentMemory and Neural MechanismsNeuroscience and Neuropharmacology Research

The DOI matches its Crossref record; 71 of the 71 references it cites were found in a registry or an index.

Rapamycin Reverses Status Epilepticus-Induced Memory Deficits and Dendritic Damage

Open access
Brewster, Amy L., Lugo, Joaquin N., Patil, Vinit V., Lee, Wai L., Qian, Yan, Vanegas, Fabiola, Anderson, Anne E.·2013·PLoS ONE

Abstract

Cognitive impairments are prominent sequelae of prolonged continuous seizures (status epilepticus; SE) in humans and animal models. While often associated with dendritic injury, the underlying mechanisms remain elusive. The mammalian target of rapamycin complex 1 (mTORC1) pathway is hyperactivated following SE. This pathway modulates learning and memory and is associated with regulation of neuronal, dendritic, and glial properties. Thus, in the present study we tested the hypothesis that SE-induced mTORC1 hyperactivation is a candidate mechanism underlying cognitive deficits and dendritic pathology seen following SE. We examined the effects of rapamycin, an mTORC1 inhibitor, on the early hippocampal-dependent spatial learning and memory deficits associated with an episode of pilocarpine-induced SE. Rapamycin-treated SE rats performed significantly better than the vehicle-treated rats in two spatial memory tasks, the Morris water maze and the novel object recognition test. At the molecular level, we found that the SE-induced increase in mTORC1 signaling was localized in neurons and microglia. Rapamycin decreased the SE-induced mTOR activation and attenuated microgliosis which was mostly localized within the CA1 area. These findings paralleled a reversal of the SE-induced decreases in dendritic Map2 and ion channels levels as well as improved dendritic branching and spine density in area CA1 following rapamycin treatment. Taken together, these findings suggest that mTORC1 hyperactivity contributes to early hippocampal-dependent spatial learning and memory deficits and dendritic dysregulation associated with SE.

Overview

The claims and statistics of this paper haven’t been checked yet.

Run the check — free, no account needed. It reads the open-access text and checks the sources it cites.

A few free checks a day · papers already verified open instantly · results are public

Integrity signals

Registry

Crossref · 10.1371/journal.pone.0057808

Cites

71 of 71 references verified0 citation errors · 0 not checkable

Statistics

Figures

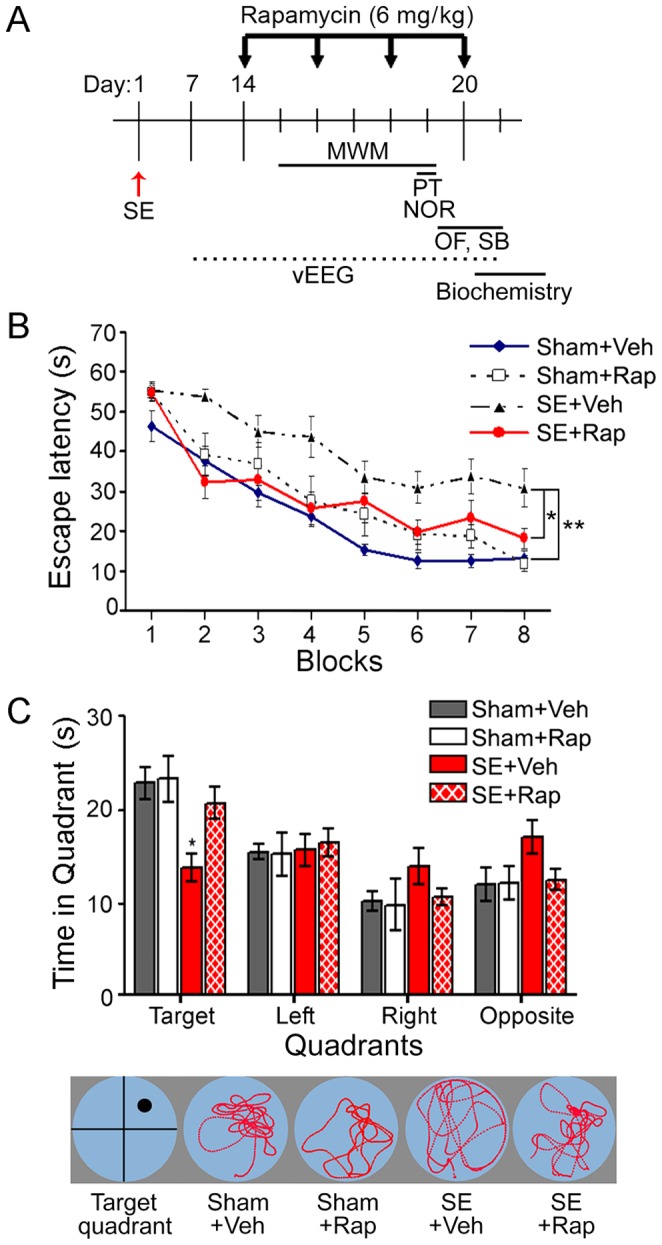
Figure 1 Rapamycin improved spatial learning and memory in rats subjected to SE. (A) The timeline of SE induction (day 1), rapamycin (Rap) treatment (6 mg/kg; days 14, 16, 18 and 20), Morris water maze (MWM) training (days 15–19), probe test (PT) (day 19), novel object recognition (NOR) (day 19) (Fig. 2), social behavior (SB) and open field (OF) (days 20–21), video-electroencephalogram (vEEG) recordings (between 7–21 days after SE), and hippocampi dissection for biochemical analyses is shown. (B–C) MWM results for the four experimental groups. (B) The rats were trained over 8 blocks (2/day, 4 days) to find a hidden platform (target quadrant) in opaque water using visual cues (acquisition phase). The time to find the hidden platform (escape latency) was significantly longer in the SE+Veh compared to the Sham+Veh group. There was no difference in the SE+Rap, Sham+Veh, and Sham+Rap groups. (C, top panel) The hidden platform was removed, and the rats were tested for memory retention of the target quadrant (probe trial). The SE+Veh group spent significantly less time in the target quadrant compared to the Sham+Veh group. The SE+Rap group performed similar to the Sham+Veh and Sham+Rap groups. (C, bottom panel) Representative tracking of the swim patterns during the probe trial. *P<0.05; **P<0.01, ANOVA with Tukey’s post hoc test; n = 8−12. Error bars = SEM.
Figure 1 Rapamycin improved spatial learning and memory in rats subjected to SE. (A) The timeline of SE induction (day 1), rapamycin (Rap) treatment (6 mg/kg; days 14, 16, 18 and 20), Morris water maze (MWM) training (days 15–19), probe test (PT) (day 19), novel object recognition (NOR) (day 19) (Fig. 2), social behavior (SB) and open field (OF) (days 20–21), video-electroencephalogram (vEEG) recordings (between 7–21 days after SE), and hippocampi dissection for biochemical analyses is shown. (B–C) MWM results for the four experimental groups. (B) The rats were trained over 8 blocks (2/day, 4 days) to find a hidden platform (target quadrant) in opaque water using visual cues (acquisition phase). The time to find the hidden platform (escape latency) was significantly longer in the SE+Veh compared to the Sham+Veh group. There was no difference in the SE+Rap, Sham+Veh, and Sham+Rap groups. (C, top panel) The hidden platform was removed, and the rats were tested for memory retention of the target quadrant (probe trial). The SE+Veh group spent significantly less time in the target quadrant compared to the Sham+Veh group. The SE+Rap group performed similar to the Sham+Veh and Sham+Rap groups. (C, bottom panel) Representative tracking of the swim patterns during the probe trial. *P<0.05; **P<0.01, ANOVA with Tukey’s post hoc test; n = 8−12. Error bars = SEM.CC BY · PubMed Central
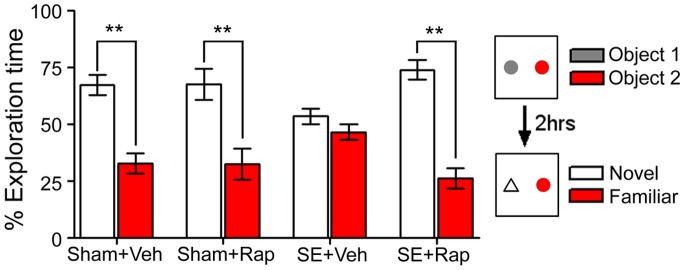
Figure 2 Rapamycin improved recognition memory in rats subjected to SE. The novel object recognition test was used to assess recognition memory in sham and SE rats treated with rapamycin (Rap) or vehicle (Veh). Rats were allowed to explore 2 objects for 5 minutes during the training phase. Two hours later, the rats were re-exposed to a previously explored object (familiar object) and a novel object, and exploration time of each object was evaluated. Sham+Veh and Sham+Rap rats spent significantly more time exploring the novel object than the familiar object. SE+Veh rats spent a similar amount of time exploring both objects. This deficit was reversed by rapamycin in the SE+Rap group. **P<0.001, ANOVA with Tukey’s post hoc test; n = 7−11. Error bars = SEM.
Figure 2 Rapamycin improved recognition memory in rats subjected to SE. The novel object recognition test was used to assess recognition memory in sham and SE rats treated with rapamycin (Rap) or vehicle (Veh). Rats were allowed to explore 2 objects for 5 minutes during the training phase. Two hours later, the rats were re-exposed to a previously explored object (familiar object) and a novel object, and exploration time of each object was evaluated. Sham+Veh and Sham+Rap rats spent significantly more time exploring the novel object than the familiar object. SE+Veh rats spent a similar amount of time exploring both objects. This deficit was reversed by rapamycin in the SE+Rap group. **P<0.001, ANOVA with Tukey’s post hoc test; n = 7−11. Error bars = SEM.CC BY · PubMed Central
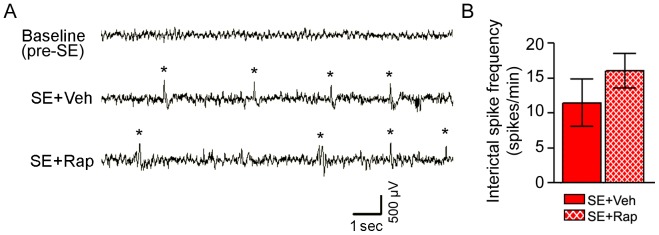
Figure 3 Interictal spike frequency following SE was unaffected by rapamycin. (A–B) EEG activity was recorded one week before (baseline) and 2–3 weeks after pilocarpine-induced SE during rapamycin (SE+Rap) or vehicle treatments (SE+Veh). Interictal spikes were quantified from each experimental group. (A) Representative EEG traces from cortex show abnormal interictal spike activity (*) in the SE+Veh and SE+Rap groups 2–3 weeks after SE, which is not evident in the baseline EEG trace. (B) Quantification of interictal spike frequency showed no differences between SE+Veh and SE+Rap groups. Similar findings were evident in hippocampal EEG traces (data not shown). P>0.05, Student’s t test; n = 7−8. Scale bar = 500 µV/sec. Error bars = SEM.
Figure 3 Interictal spike frequency following SE was unaffected by rapamycin. (A–B) EEG activity was recorded one week before (baseline) and 2–3 weeks after pilocarpine-induced SE during rapamycin (SE+Rap) or vehicle treatments (SE+Veh). Interictal spikes were quantified from each experimental group. (A) Representative EEG traces from cortex show abnormal interictal spike activity (*) in the SE+Veh and SE+Rap groups 2–3 weeks after SE, which is not evident in the baseline EEG trace. (B) Quantification of interictal spike frequency showed no differences between SE+Veh and SE+Rap groups. Similar findings were evident in hippocampal EEG traces (data not shown). P>0.05, Student’s t test; n = 7−8. Scale bar = 500 µV/sec. Error bars = SEM.CC BY · PubMed Central
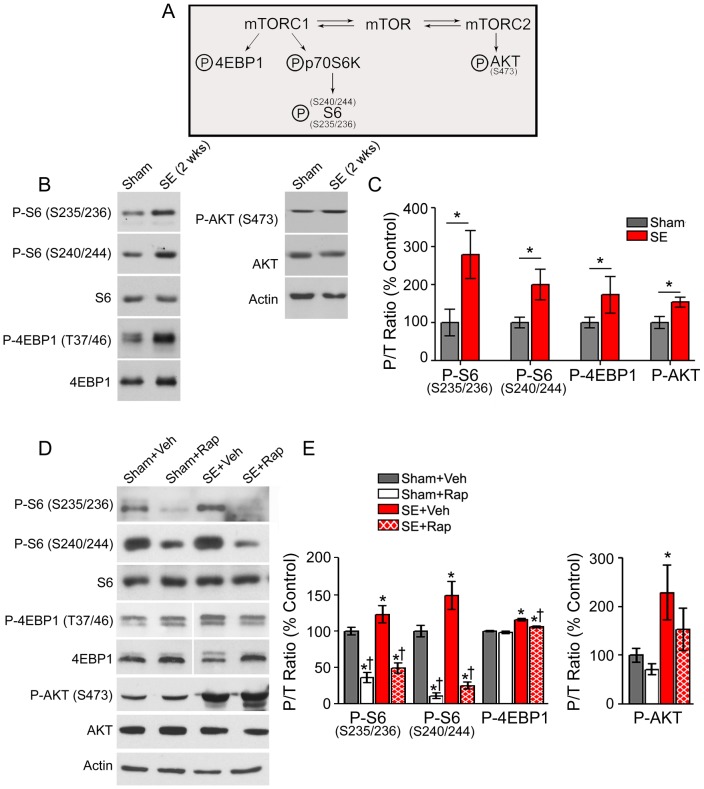
Figure 4 Rapamycin treatment suppressed SE-induced hyperphosphorylation of mTORC1 downstream targets. Western blotting was performed in whole hippocampal homogenates from SE and sham rats 2 weeks after SE (B–C) and after treatment with rapamycin (Rap) or vehicle (Veh) following the behavioral tests (D–E). (A) Diagram illustrating mTORC1/2 targets evaluated. (B) Representative immunoblots from hippocampal proteins derived from sham and SE rats 2 weeks after pilocarpine-induced SE probed for the total and phosphorylated (P-) forms of S6, 4EBP1, AKT and actin are shown. (C) Quantitative analysis of the phosphorylated to total protein (P/T) ratio shows a significant increase in P-S6, P-4EBP1 and P-AKT 2 weeks after SE compared to shams. * P<0.05, student’s t test; n = 3−5. (D) Representative immunoblots from hippocampal proteins derived from Sham+Veh, Sham+Rap, SE+Veh and SE+Rap following behavioral tests, probed for total and P- S6, 4EBP1, AKT, and actin are shown. (E) Quantitative analysis of the P/T ratio of immunoreactive bands shows significantly increased levels of P-S6, P-4EBP1, and P-AKT in the SE+Veh group compared to Sham+Veh. Rapamycin suppressed P-S6 levels in the Sham+Rap and SE+Rap groups, and partially reduced P-4EBP1 in the SE+Rap group but not in the Sham+Rap group. P-AKT levels remained elevated despite rapamycin treatment. Note that blots for total and phospho-4EBP1 were run in the same gel but were noncontiguous. * compared to Sham+Veh, P<0.05; † compared to SE+Veh, P<0.05, ANOVA with Tukey’s post hoc test; n = 5−8. Error bars = SEM.
Figure 4 Rapamycin treatment suppressed SE-induced hyperphosphorylation of mTORC1 downstream targets. Western blotting was performed in whole hippocampal homogenates from SE and sham rats 2 weeks after SE (B–C) and after treatment with rapamycin (Rap) or vehicle (Veh) following the behavioral tests (D–E). (A) Diagram illustrating mTORC1/2 targets evaluated. (B) Representative immunoblots from hippocampal proteins derived from sham and SE rats 2 weeks after pilocarpine-induced SE probed for the total and phosphorylated (P-) forms of S6, 4EBP1, AKT and actin are shown. (C) Quantitative analysis of the phosphorylated to total protein (P/T) ratio shows a significant increase in P-S6, P-4EBP1 and P-AKT 2 weeks after SE compared to shams. * P<0.05, student’s t test; n = 3−5. (D) Representative immunoblots from hippocampal proteins derived from Sham+Veh, Sham+Rap, SE+Veh and SE+Rap following behavioral tests, probed for total and P- S6, 4EBP1, AKT, and actin are shown. (E) Quantitative analysis of the P/T ratio of immunoreactive bands shows significantly increased levels of P-S6, P-4EBP1, and P-AKT in the SE+Veh group compared to Sham+Veh. Rapamycin suppressed P-S6 levels in the Sham+Rap and SE+Rap groups, and partially reduced P-4EBP1 in the SE+Rap group but not in the Sham+Rap group. P-AKT levels remained elevated despite rapamycin treatment. Note that blots for total and phospho-4EBP1 were run in the same gel but were noncontiguous. * compared to Sham+Veh, P<0.05; † compared to SE+Veh, P<0.05, ANOVA with Tukey’s post hoc test; n = 5−8. Error bars = SEM.CC BY · PubMed Central
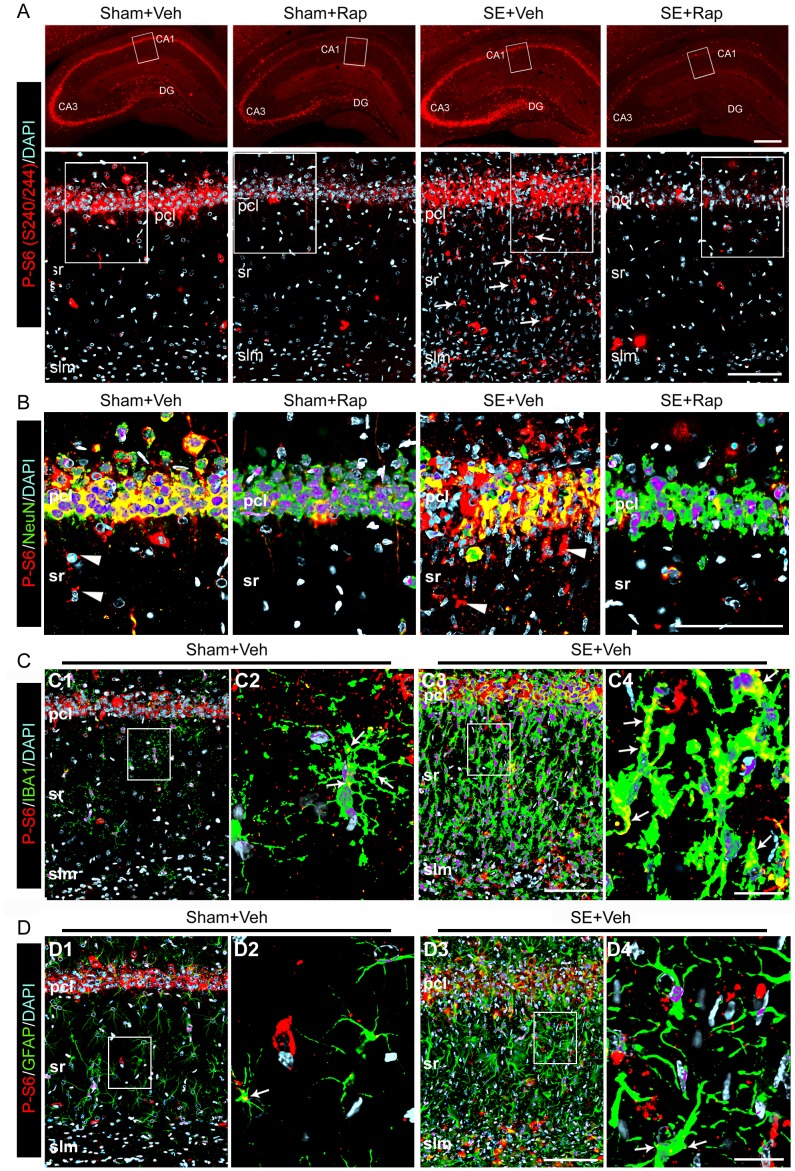
Figure 5 Rapamycin suppressed the SE-induced hyperphosphorylation of the S6 protein in hippocampal neurons and microglia. Immunohistochemistry was performed using antibodies against phosphorylated (P)-S6 (S240/244) on coronal brain sections derived from SE and sham rats after treatment with rapamycin (Rap) or vehicle (Veh) following behavioral tests. (A) Representative low (top panels) and high (bottom panels) power images show P-S6 staining (red) in cells localized within the CA1 and DG regions of the Sham+Veh and SE+Veh groups and in glial-appearing cells that is more intense within sr and slm of the SE+Veh group (bottom panel arrows). P-S6 was drastically reduced below basal levels in the rapamycin-treated groups. (B) Higher magnification images (boxed on A bottom panels) show co-localization (yellow) of P-S6 staining (red) with NeuN (green) within the CA1 pcl of all groups, but not in some cells localized within sr of the Sham+Veh and SE+Veh groups (arrowhead). (C–D) Co-localization (yellow) of P-S6 (red) with IBA1 (green) (arrows) (C) and GFAP (D) (green) in the Sham+SE was greater than the Sham+Veh group. (C2, C4, D2, D4) High magnification images from areas boxed in C1, C3, D1 and D4, respectively. (B–D) Deconvoluted maximum projection images are from 21 Z-stacks (0.5 µm steps). Scale bars: A top panels: 500 µm; A bottom panels, B, C3, D3∶100 µm; C4, D4∶25 µm; Abbreviations: pcl, pyramidal cell layer; sr, stratum radiatum; slm, stratum lacunosum moleculare; gcl, granule cell layer; DG, dentate gyrus; n = 4−6.
Figure 5 Rapamycin suppressed the SE-induced hyperphosphorylation of the S6 protein in hippocampal neurons and microglia. Immunohistochemistry was performed using antibodies against phosphorylated (P)-S6 (S240/244) on coronal brain sections derived from SE and sham rats after treatment with rapamycin (Rap) or vehicle (Veh) following behavioral tests. (A) Representative low (top panels) and high (bottom panels) power images show P-S6 staining (red) in cells localized within the CA1 and DG regions of the Sham+Veh and SE+Veh groups and in glial-appearing cells that is more intense within sr and slm of the SE+Veh group (bottom panel arrows). P-S6 was drastically reduced below basal levels in the rapamycin-treated groups. (B) Higher magnification images (boxed on A bottom panels) show co-localization (yellow) of P-S6 staining (red) with NeuN (green) within the CA1 pcl of all groups, but not in some cells localized within sr of the Sham+Veh and SE+Veh groups (arrowhead). (C–D) Co-localization (yellow) of P-S6 (red) with IBA1 (green) (arrows) (C) and GFAP (D) (green) in the Sham+SE was greater than the Sham+Veh group. (C2, C4, D2, D4) High magnification images from areas boxed in C1, C3, D1 and D4, respectively. (B–D) Deconvoluted maximum projection images are from 21 Z-stacks (0.5 µm steps). Scale bars: A top panels: 500 µm; A bottom panels, B, C3, D3∶100 µm; C4, D4∶25 µm; Abbreviations: pcl, pyramidal cell layer; sr, stratum radiatum; slm, stratum lacunosum moleculare; gcl, granule cell layer; DG, dentate gyrus; n = 4−6.CC BY · PubMed Central
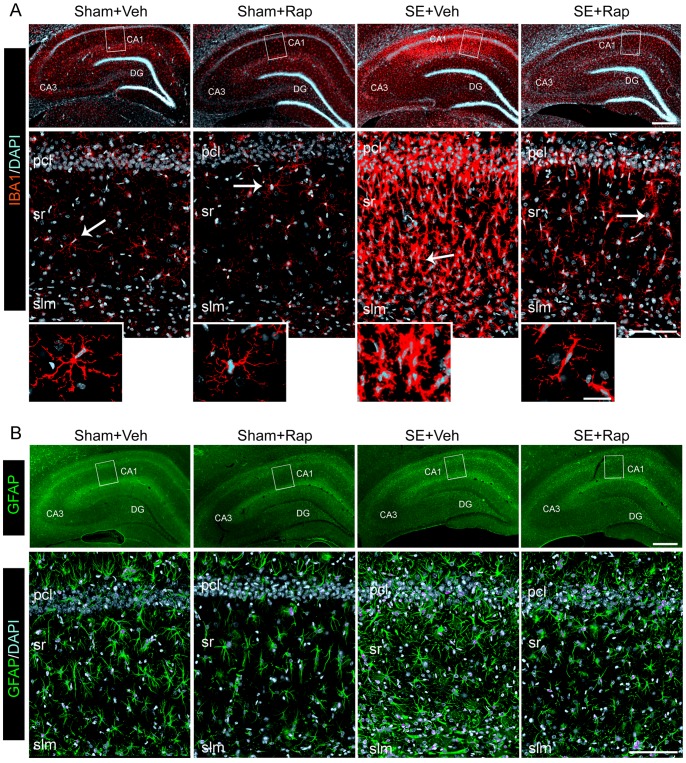
Figure 6 Rapamycin reduced SE-induced hippocampal gliosis. (A–B) We used immunohistochemistry to evaluate the distribution of staining for IBA1 (for microglia) (A) and GFAP (for astrocytes) (B). Immunostaining was performed in hippocampi from SE and sham rats after treatment with rapamycin (Rap) or vehicle (Veh), following behavioral tests. (A–B top panels) Representative low power images with IBA1 (red) (A) and GFAP (green) (B) staining within the CA1 and DG regions is shown. DAPI (blue) shows nuclear staining. (A–B bottom panels) Representative deconvoluted higher magnification projection images of the IBA1 (A) and GFAP (B) staining within CA1 pcl, sr, and slm. These images show a robust increase in IBA1 (A) and GFAP (B) staining in the CA1 area of the SE+Veh group that is drastically reduced in the SE+Rap group. Insets in A show IBA1-stained microglia with branched processes and small cell bodies in the Sham+Veh, Sham+Rap and SE+Rap groups, which in contrast are hypertrophied and amoeboid shaped in the SE+Veh group (arrows). Scale bars: A,B top panels: 500 µm; A,B bottom panels: 100 µm; deconvoluted maximum projection images are from 21 Z-stacks (0.5 µm steps). Abbreviations: pcl, pyramidal cell layer; sr, stratum radiatum; slm, stratum lacunosum moleculare; gcl, granule cell layer; DG, dentate gyrus; n = 6.
Figure 6 Rapamycin reduced SE-induced hippocampal gliosis. (A–B) We used immunohistochemistry to evaluate the distribution of staining for IBA1 (for microglia) (A) and GFAP (for astrocytes) (B). Immunostaining was performed in hippocampi from SE and sham rats after treatment with rapamycin (Rap) or vehicle (Veh), following behavioral tests. (A–B top panels) Representative low power images with IBA1 (red) (A) and GFAP (green) (B) staining within the CA1 and DG regions is shown. DAPI (blue) shows nuclear staining. (A–B bottom panels) Representative deconvoluted higher magnification projection images of the IBA1 (A) and GFAP (B) staining within CA1 pcl, sr, and slm. These images show a robust increase in IBA1 (A) and GFAP (B) staining in the CA1 area of the SE+Veh group that is drastically reduced in the SE+Rap group. Insets in A show IBA1-stained microglia with branched processes and small cell bodies in the Sham+Veh, Sham+Rap and SE+Rap groups, which in contrast are hypertrophied and amoeboid shaped in the SE+Veh group (arrows). Scale bars: A,B top panels: 500 µm; A,B bottom panels: 100 µm; deconvoluted maximum projection images are from 21 Z-stacks (0.5 µm steps). Abbreviations: pcl, pyramidal cell layer; sr, stratum radiatum; slm, stratum lacunosum moleculare; gcl, granule cell layer; DG, dentate gyrus; n = 6.CC BY · PubMed Central
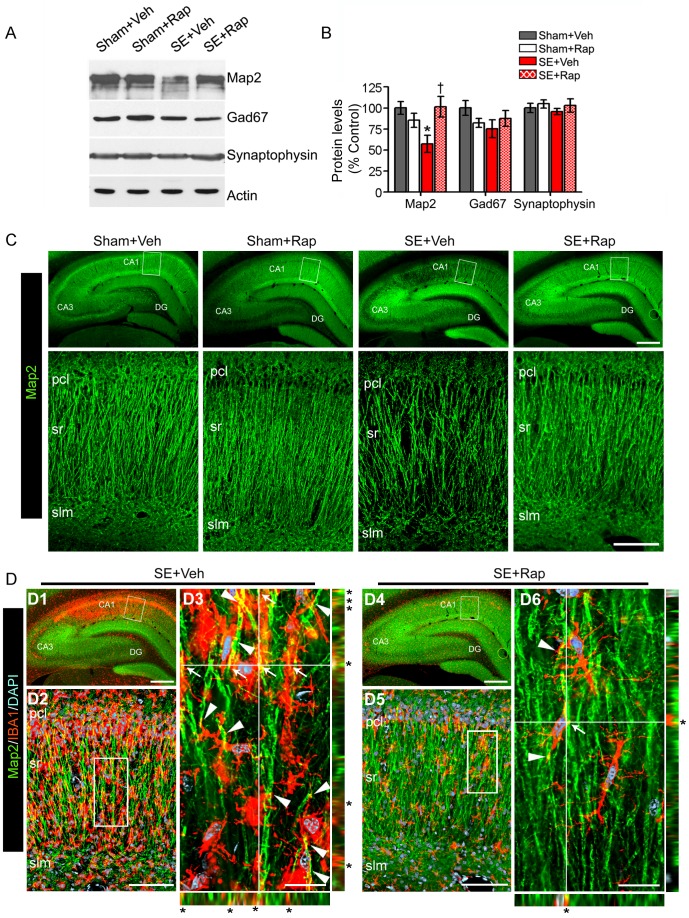
Figure 7 Rapamycin rescues Map2 protein levels in hippocampi from rats subjected to SE. (A–B) We used western blotting to measure the levels of Map2, Gad67, synaptophysin and actin in hippocampi from SE and sham rats after treatment with rapamycin (Rap) or vehicle (Veh) following the behavioral tests. (A) Representative immunoblots. (B) Map2 levels were lower in the SE+Veh compared to the Sham+Veh group and reversed in the SE+Rap group. Levels of Gad67, synaptophysin or actin were not different between the groups. * compared to Sham+Veh, P<0.05; † compared to SE+Veh, P<0.05, ANOVA with Tukey’s post hoc test; n = 5−7. Error bars = SEM. (C–D) We used immunohistochemistry to evaluate Map2 distribution. (C) Representative low (top panels) and higher (bottom panels) magnification images show prominent Map2 loss within the CA1 sr of the SE+Veh compared with the Sham+Veh group that was reversed in the SE+Rap group. (D) Co-immunostaining with Map2 and IBA1 antibodies show a correlation in their localization in the SE+Veh group that is diminished in the SE+Rap group. (D2–3, D5–6) The images with corresponding XZ and YZ projections show microglia processes (red) intertwined with (arrowheads) and touching (arrows/asterisks) (yellow) the Map2-labeled dendrites (green) in the SE+Veh (D3) and SE+Rap (D6) groups. Deconvoluted maximum projection images: C, D2, D5∶21 Z-stacks (0.5 µm steps); D3, D6∶31 Z-stacks (0.1 µm steps). Scale bars: C top panels, D1, D4∶500 µm; C bottom panels, D2, D5∶100 µm; D3, D6∶20 µm. Abbreviations: pcl, pyramidal cell layer; sr, stratum radiatum; slm, stratum lacunosum moleculare; DG, dentate gyrus; n = 6.
Figure 7 Rapamycin rescues Map2 protein levels in hippocampi from rats subjected to SE. (A–B) We used western blotting to measure the levels of Map2, Gad67, synaptophysin and actin in hippocampi from SE and sham rats after treatment with rapamycin (Rap) or vehicle (Veh) following the behavioral tests. (A) Representative immunoblots. (B) Map2 levels were lower in the SE+Veh compared to the Sham+Veh group and reversed in the SE+Rap group. Levels of Gad67, synaptophysin or actin were not different between the groups. * compared to Sham+Veh, P<0.05; † compared to SE+Veh, P<0.05, ANOVA with Tukey’s post hoc test; n = 5−7. Error bars = SEM. (C–D) We used immunohistochemistry to evaluate Map2 distribution. (C) Representative low (top panels) and higher (bottom panels) magnification images show prominent Map2 loss within the CA1 sr of the SE+Veh compared with the Sham+Veh group that was reversed in the SE+Rap group. (D) Co-immunostaining with Map2 and IBA1 antibodies show a correlation in their localization in the SE+Veh group that is diminished in the SE+Rap group. (D2–3, D5–6) The images with corresponding XZ and YZ projections show microglia processes (red) intertwined with (arrowheads) and touching (arrows/asterisks) (yellow) the Map2-labeled dendrites (green) in the SE+Veh (D3) and SE+Rap (D6) groups. Deconvoluted maximum projection images: C, D2, D5∶21 Z-stacks (0.5 µm steps); D3, D6∶31 Z-stacks (0.1 µm steps). Scale bars: C top panels, D1, D4∶500 µm; C bottom panels, D2, D5∶100 µm; D3, D6∶20 µm. Abbreviations: pcl, pyramidal cell layer; sr, stratum radiatum; slm, stratum lacunosum moleculare; DG, dentate gyrus; n = 6.CC BY · PubMed Central
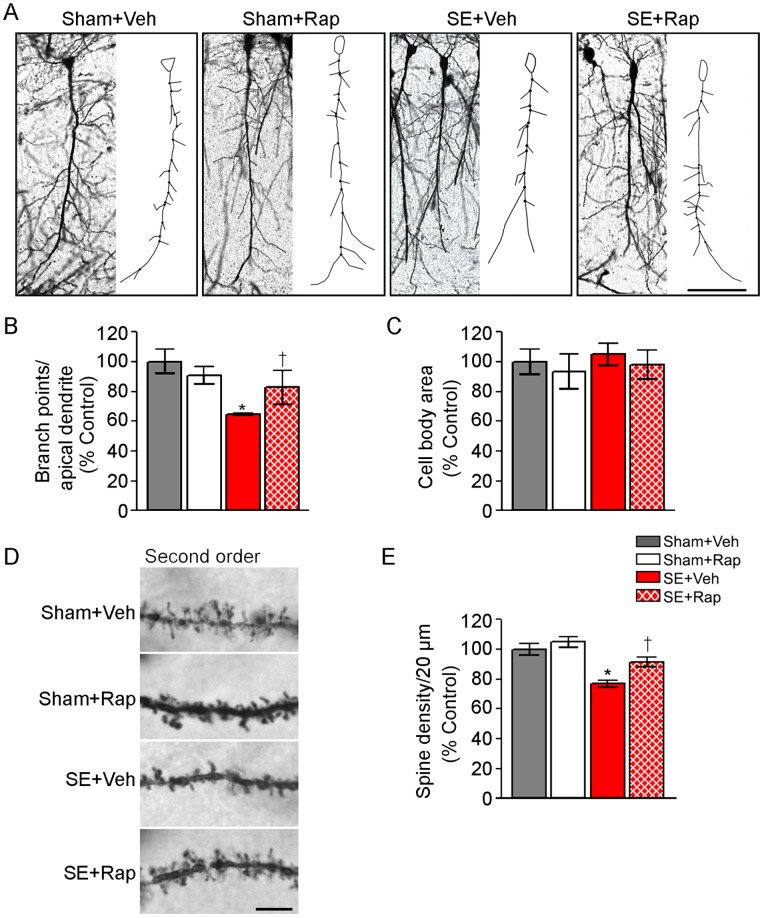
Figure 8 Rapamycin improved CA1 dendritic arborization and spine density in hippocampi from rats subjected to SE. We used golgi staining followed by neurolucida reconstructions to determine dendritic branching and spine density in CA1 cells from SE and sham rats after treatment with rapamycin (Rap) or vehicle (Veh) following the behavioral tests. (A) Representative images of golgi-stained CA1 neurons and their respective reconstructions showing the branch points from the apical dendrites. (B) Branch point analysis normalized to percent of Sham+Veh (% control) shows a significant decrease in the apical dendrite branch points in the SE+Veh compared to the Sham+Veh group that is reversed in the SE+Rap group; n = 4−6 brains/group from which 4–17 cells/brain were analyzed. (C) Analysis of cell body area shows no differences between the groups. (D) Representative images of 20 µm sections of second order dendritic branches and spines; n = 59−80 branches/group. (E) Quantitative analysis of spine density in secondary dendritic branch structures shows a significant decrease in spine density from the SE+Veh compared to the Sham+Veh group that is reversed in the SE+Rap group. Scale bar = A: 100µm; D: 5µm. * compared to Sham+Veh, P<0.05; † compared to SE+Veh, P<0.05, ANOVA with Tukey’s post hoc test. Error bars = SEM.
Figure 8 Rapamycin improved CA1 dendritic arborization and spine density in hippocampi from rats subjected to SE. We used golgi staining followed by neurolucida reconstructions to determine dendritic branching and spine density in CA1 cells from SE and sham rats after treatment with rapamycin (Rap) or vehicle (Veh) following the behavioral tests. (A) Representative images of golgi-stained CA1 neurons and their respective reconstructions showing the branch points from the apical dendrites. (B) Branch point analysis normalized to percent of Sham+Veh (% control) shows a significant decrease in the apical dendrite branch points in the SE+Veh compared to the Sham+Veh group that is reversed in the SE+Rap group; n = 4−6 brains/group from which 4–17 cells/brain were analyzed. (C) Analysis of cell body area shows no differences between the groups. (D) Representative images of 20 µm sections of second order dendritic branches and spines; n = 59−80 branches/group. (E) Quantitative analysis of spine density in secondary dendritic branch structures shows a significant decrease in spine density from the SE+Veh compared to the Sham+Veh group that is reversed in the SE+Rap group. Scale bar = A: 100µm; D: 5µm. * compared to Sham+Veh, P<0.05; † compared to SE+Veh, P<0.05, ANOVA with Tukey’s post hoc test. Error bars = SEM.CC BY · PubMed Central
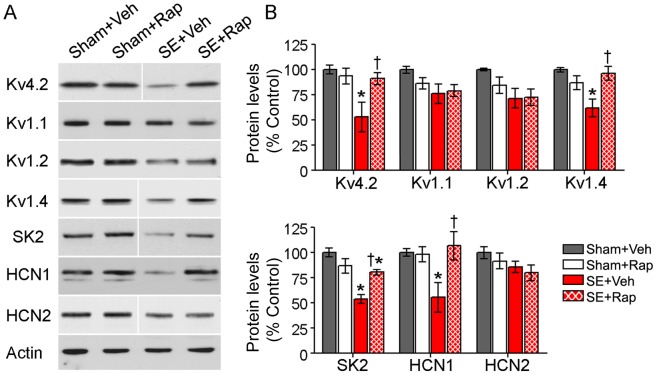
Figure 9 Rapamycin restored protein levels of dendritic ion channels in hippocampi from rats subjected to SE. (A–B) We used western blotting to measure the protein levels of several ion channels in hippocampi from SE and sham rats after treatment with rapamycin (Rap) or vehicle (Veh) following the behavioral tests. (A) Representative western blots probed with the antibodies against Kv4.2, Kv1.1, Kv1.2, Kv1.4, SK2, HCN1, HCN2 channels and actin are shown. (B) Analysis of immunoreactive bands revealed significantly lower levels of Kv4.2, Kv1.4, SK2, and HCN1 in the SE+Veh compared with the Sham+Veh group. In the SE+Rap group, rapamycin rescued basal levels of Kv4.2, Kv1.4, and HCN1 channels with a partial rescue of SK2. Levels of Kv1.1, Kv1.2 or HCN2 were not changed in the SE group and rapamycin treatment had no effect on these channels. Note that blots for Kv4.2, Kv1.4, SK2 and HCN2 were run in the same gel but were noncontiguous. * compared to Sham+Veh, P<0.05; † compared to SE+Veh, P<0.05, ANOVA with Tukey’s post hoc test; n = 5−8; SK2: n = 3−4. Error bars = SEM.
Figure 9 Rapamycin restored protein levels of dendritic ion channels in hippocampi from rats subjected to SE. (A–B) We used western blotting to measure the protein levels of several ion channels in hippocampi from SE and sham rats after treatment with rapamycin (Rap) or vehicle (Veh) following the behavioral tests. (A) Representative western blots probed with the antibodies against Kv4.2, Kv1.1, Kv1.2, Kv1.4, SK2, HCN1, HCN2 channels and actin are shown. (B) Analysis of immunoreactive bands revealed significantly lower levels of Kv4.2, Kv1.4, SK2, and HCN1 in the SE+Veh compared with the Sham+Veh group. In the SE+Rap group, rapamycin rescued basal levels of Kv4.2, Kv1.4, and HCN1 channels with a partial rescue of SK2. Levels of Kv1.1, Kv1.2 or HCN2 were not changed in the SE group and rapamycin treatment had no effect on these channels. Note that blots for Kv4.2, Kv1.4, SK2 and HCN2 were run in the same gel but were noncontiguous. * compared to Sham+Veh, P<0.05; † compared to SE+Veh, P<0.05, ANOVA with Tukey’s post hoc test; n = 5−8; SK2: n = 3−4. Error bars = SEM.CC BY · PubMed Central

Verification

Claims the paper makes

The claims and statistics of this paper haven’t been checked yet.

Run the check — free, no account needed. It reads the open-access text and checks the sources it cites.

A few free checks a day · papers already verified open instantly · results are public

Claims other papers make about this one

Each is checked against this paper’s own text: does it say what the citing paper says it does?

Self-check

Percentages, sums and reported differences re-computed from the paper’s own numbers.

The self-check needs the paper’s full text.

Citations

Cites

Show all 71 references

Cited by

Sorted by citations

See all 113

Metadata

Authors
Brewster, A. L., Lugo, J. N., Patil, V. V., Lee, W. L., Qian, Y., Vanegas, F., & Anderson, A. E.
Affiliations
Baylor College of Medicine (US)
Corresponding author
Anderson, Anne E.
Venue
PLoS ONE
Published
2013-03-11
Volume
8
Issue
3
Pages
e57808
ISSN
1932-6203 (ISSN-L)
OpenAlex
W2014962014
Cited by
112
References
71
Citations by year
2026: 6 · 2025: 3 · 2024: 7 · 2023: 6 · 2022: 5 · 2021: 13 · 2020: 11 · 2019: 5 · 2018: 10 · 2017: 14 · 2016: 14 · 2015: 11 · 2014: 5 · 2013: 2
FWCI
7.58
Type
journal article
Language
en
Open access
Locations
  • PLoS ONE (publishedVersion, cc-by)
  • Europe PMC (PubMed Central) (publishedVersion, cc-by)
  • PubMed Central (publishedVersion, cc-by)
  • PubMed (publishedVersion)
  • DOAJ (DOAJ: Directory of Open Access Journals) (submittedVersion, cc-by-sa)
  • Figshare (submittedVersion, cc-by)
Funders
  • National Institutes of Health (T32 NS, R01 NS, 43124)
  • National Institute of Neurological Disorders and Stroke (T32 NS 43124, F32NS056664, R01 NS 39943, T32NS043124, F32 NS 56664, R01 NS49427, R01NS039943, R01NS049427)
Topics
  • Health Sciences › Medicine › Clinical Neurology › Epilepsy research and treatment
  • Life Sciences › Neuroscience › Cognitive Neuroscience › Memory and Neural Mechanisms
  • Life Sciences › Neuroscience › Cellular and Molecular Neuroscience › Neuroscience and Neuropharmacology Research
Keywords
status epilepticus, rapamycin, mTORC1 signaling, cognitive impairment, spatial memory impairment, hippocampus, CA1, microglial activation, pilocarpine-induced seizures, dendritic spine density, MAP2, ion channels, neuroprotection
MeSH terms
Mechanistic Target of Rapamycin Complex 1, Animals, Dendrites, Disease Models, Animal, Electroencephalography, Gliosis, Hippocampus, Ion Channels, Male, Memory Disorders, Neurons, Phosphorylation, Pilocarpine, Status Epilepticus, Microglia, Maze Learning, Ribosomal Protein S6 Kinases, Sirolimus, Multiprotein Complexes, Dendritic Spines, Rats, TOR Serine-Threonine Kinases

About these checks

Registry, retraction, Cites and statistics results are computed, not judged, with one exception: a printed reference that no index lists is read once by a model before it counts as a citation error. Claims are extracted by a model and kept only when their quote appears verbatim in the text; each cited source is then checked, with a model’s help, for whether it says what the claim relies on. Those verdicts can be wrong — read the claim’s quote and the cited source before relying on one.

Statistics and arithmetic are recomputed, not judged.

Confidence bands are shown only for fields calibrated on our annotated test set. None is calibrated yet, so no band is shown.

What counts as a claim ›How we measure confidence ›How we check this ›

Are you an author, or do you see a problem with this page? Request a review