Cited by 173Metabolism, Diabetes, and CancerMitochondrial Function and PathologyPeroxisome Proliferator-Activated Receptors

The DOI matches its Crossref record; 30 of the 30 references it cites were found in a registry or an index.

Identification of a Mitochondrial Target of Thiazolidinedione Insulin Sensitizers (mTOT)—Relationship to Newly Identified Mitochondrial Pyruvate Carrier Proteins

Open access

Abstract

Thiazolidinedione (TZD) insulin sensitizers have the potential to effectively treat a number of human diseases, however the currently available agents have dose-limiting side effects that are mediated via activation of the transcription factor PPARγ. We have recently shown PPARγ-independent actions of TZD insulin sensitizers, but the molecular target of these molecules remained to be identified. Here we use a photo-catalyzable drug analog probe and mass spectrometry-based proteomics to identify a previously uncharacterized mitochondrial complex that specifically recognizes TZDs. These studies identify two well-conserved proteins previously known as brain protein 44 (BRP44) and BRP44 Like (BRP44L), which recently have been renamed Mpc2 and Mpc1 to signify their function as a mitochondrial pyruvate carrier complex. Knockdown of Mpc1 or Mpc2 in Drosophila melanogaster or pre-incubation with UK5099, an inhibitor of pyruvate transport, blocks the crosslinking of mitochondrial membranes by the TZD probe. Knockdown of these proteins in Drosophila also led to increased hemolymph glucose and blocked drug action. In isolated brown adipose tissue (BAT) cells, MSDC-0602, a PPARγ-sparing TZD, altered the incorporation of (13)C-labeled carbon from glucose into acetyl CoA. These results identify Mpc1 and Mpc2 as components of the mitochondrial target of TZDs (mTOT) and suggest that understanding the modulation of this complex, which appears to regulate pyruvate entry into the mitochondria, may provide a viable target for insulin sensitizing pharmacology.

Overview

The claims and statistics of this paper haven’t been checked yet.

Run the check — free, no account needed. It reads the open-access text and checks the sources it cites.

A few free checks a day · papers already verified open instantly · results are public

Integrity signals

Registry

Crossref · 10.1371/journal.pone.0061551

Cites

30 of 30 references verified0 citation errors · 0 not checkable

Statistics

Figures

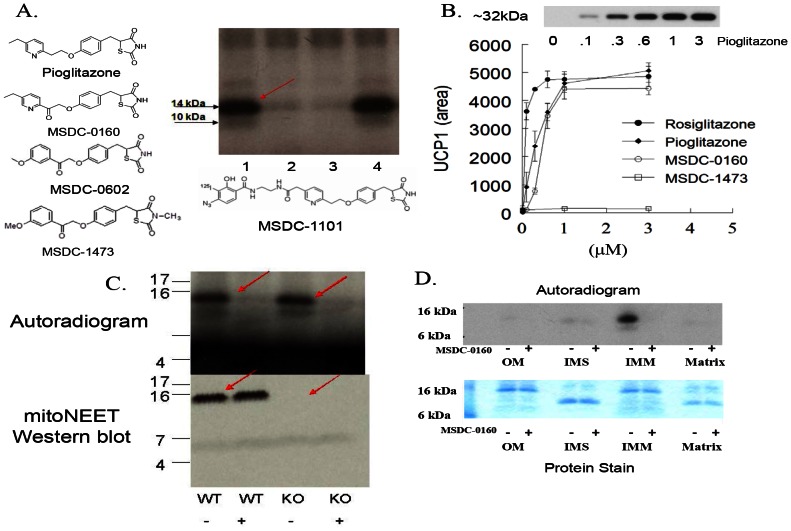
Figure 1 Selective crosslinking with photo affinity probe. (A) Mitochondrial membranes (20 µg) from rat liver were incubated with the iodinated (125I) photo-probe (MSDC-1101) in the absence of any competing compound (lane 1); in the presence of 25 µM MSDC-0160 (lane 2); in the presence of 25 µM MSDC-0602 (lane 3); or in the presence of 25 µM MSDC-1473 (lane 4). Following exposure to UV light, samples were separated on one dimensional SDS-PAGE and the dried gel was exposed to X-ray film. (B) Active TZDs, but not MSDC-1473, produce a dose-dependent increase in UCP1 as detected on Western blots from mouse BAT progenitor cells. The abscissa shows drug concentration (µM). The inset on the top of this figure shows a representative Western blot of the increase in UCP1 protein in cells treated with an active TZD (pioglitazone). The data below the blot show the dose dependent increases observed in a representative experiment from a scan of the Western blots (arbitrary units, Mean and SE; N = 3). (C) Liver mitochondrial fractions from wild type or mitoNEET null mice [11] were crosslinked as in A without (−) or with (+) 25 µM MSDC-0160. The top figure is the resulting autoradiogram and the bottom is the Western blot for mitoNEET. (D) Mouse liver mitochondria were fractionated to generate fractions for outer membrane (OM), inter membrane space (IMS), inner membrane (IMM), and matrix. Total protein (10 µg) from each fraction was crosslinked as in A. The autoradiogram is shown at the top and a stain for total protein for the same 4 mitochondrial subfractions is shown below.
Figure 1 Selective crosslinking with photo affinity probe. (A) Mitochondrial membranes (20 µg) from rat liver were incubated with the iodinated (125I) photo-probe (MSDC-1101) in the absence of any competing compound (lane 1); in the presence of 25 µM MSDC-0160 (lane 2); in the presence of 25 µM MSDC-0602 (lane 3); or in the presence of 25 µM MSDC-1473 (lane 4). Following exposure to UV light, samples were separated on one dimensional SDS-PAGE and the dried gel was exposed to X-ray film. (B) Active TZDs, but not MSDC-1473, produce a dose-dependent increase in UCP1 as detected on Western blots from mouse BAT progenitor cells. The abscissa shows drug concentration (µM). The inset on the top of this figure shows a representative Western blot of the increase in UCP1 protein in cells treated with an active TZD (pioglitazone). The data below the blot show the dose dependent increases observed in a representative experiment from a scan of the Western blots (arbitrary units, Mean and SE; N = 3). (C) Liver mitochondrial fractions from wild type or mitoNEET null mice [11] were crosslinked as in A without (−) or with (+) 25 µM MSDC-0160. The top figure is the resulting autoradiogram and the bottom is the Western blot for mitoNEET. (D) Mouse liver mitochondria were fractionated to generate fractions for outer membrane (OM), inter membrane space (IMS), inner membrane (IMM), and matrix. Total protein (10 µg) from each fraction was crosslinked as in A. The autoradiogram is shown at the top and a stain for total protein for the same 4 mitochondrial subfractions is shown below.CC BY · PubMed Central
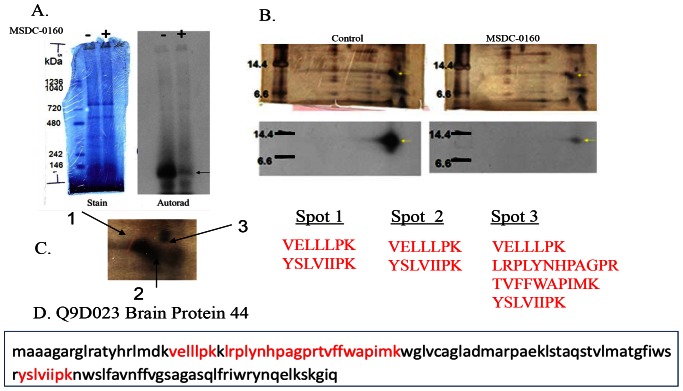
Figure 2 Crosslinked protein is BRP44. (A) Blue Native electrophoresis of crosslinked proteins showing the stain pattern (left) and the corresponding autoradiogram image for the specifically crosslinked protein (without, “−”on the left and with MSDC-0160 competition, “+”, on the right). The <150 kDa band is marked by the arrow. (B) Second dimension SDS separation of Blue Native gel without (left) and with (right) MSDC-0160 competition. Upper figures are silver stained images of the gels and lower figures are corresponding autoradiograms. Areas of interest are marked by the yellow arrows. (C) Expanded view of silver-stained images showing the three areas submitted for MS/MS analysis followed by the respective trypsin peptide sequences. These peptides (shown also in red, bottom frame D) identify BRP44 (Q9D023).
Figure 2 Crosslinked protein is BRP44. (A) Blue Native electrophoresis of crosslinked proteins showing the stain pattern (left) and the corresponding autoradiogram image for the specifically crosslinked protein (without, “−”on the left and with MSDC-0160 competition, “+”, on the right). The <150 kDa band is marked by the arrow. (B) Second dimension SDS separation of Blue Native gel without (left) and with (right) MSDC-0160 competition. Upper figures are silver stained images of the gels and lower figures are corresponding autoradiograms. Areas of interest are marked by the yellow arrows. (C) Expanded view of silver-stained images showing the three areas submitted for MS/MS analysis followed by the respective trypsin peptide sequences. These peptides (shown also in red, bottom frame D) identify BRP44 (Q9D023).CC BY · PubMed Central
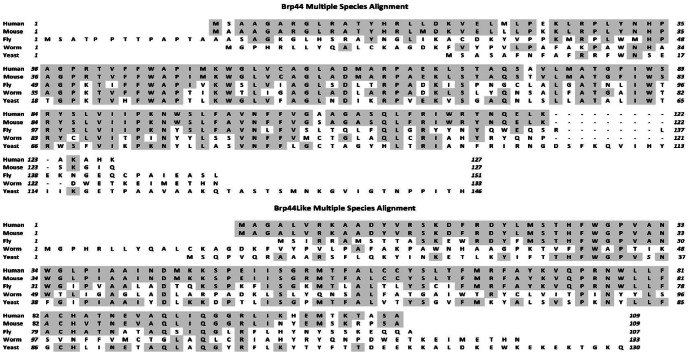
Figure 3 BRP44 family. Upper panel (A) is the multiple species sequence alignment of BRP44 and lower panel (B) shows the multiple species alignments for the family member protein BRP44L. Shaded amino acids show identical amino acids as compared to the human sequences.
Figure 3 BRP44 family. Upper panel (A) is the multiple species sequence alignment of BRP44 and lower panel (B) shows the multiple species alignments for the family member protein BRP44L. Shaded amino acids show identical amino acids as compared to the human sequences.CC BY · PubMed Central
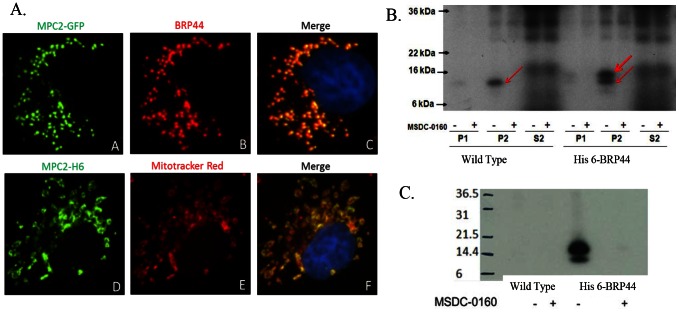
Figure 4 Expressed BRP44 goes to mitochondrion and is crosslinked selectively by the TZD probe. (A) Upper frame: C-terminally-tagged GFP BRP44 (green) in Cos7 cells is co-localized with endogenous BRP44 (red). Lower frame: C-terminally tagged 6×His BRP44 (green) is co-localized with Mitotracker Red confirming the mitochondrial localization. (B) A sequence encoding BRP44 C-terminally tagged with six histidine residues was transiently expressed in HEK293 cells. Subcellular fractions were prepared (P1, crude nuclear fraction; P2, crude mitochondrial fraction; S2, post mitochondrial fraction) and incubated with the radiolabeled photo-probe in the presence or absence of 25 µM MSDC-0160 as indicated. Samples were subjected to one dimensional SDS-PAGE and the dried gel was exposed to X-ray film. The red arrows point to the image of the selectively crosslinked native and C-terminal extension proteins. (C) Crosslinked BRP44 6×His is selectively immunoprecipitated by antibodies to 6×His. Membranes from HEK293 cells stably transfected with BRP44 6×His (right lanes, 6 His) or non transfected cells (left lanes, control) were crosslinked with or without competition with MSDC-0160 as in B. The membranes, all of which contained the specifically crosslinked band as shown in B, were then solubilized and immunoprecipitation was carried out with anti-His agarose beads. The resulting pellets were solubilized and submitted to SDS-PAGE. The corresponding autoradiogram is shown demonstrating that the radioactive band is only precipitated by anti-His tag in the tissue from the cells expressing His-6 BRP44.
Figure 4 Expressed BRP44 goes to mitochondrion and is crosslinked selectively by the TZD probe. (A) Upper frame: C-terminally-tagged GFP BRP44 (green) in Cos7 cells is co-localized with endogenous BRP44 (red). Lower frame: C-terminally tagged 6×His BRP44 (green) is co-localized with Mitotracker Red confirming the mitochondrial localization. (B) A sequence encoding BRP44 C-terminally tagged with six histidine residues was transiently expressed in HEK293 cells. Subcellular fractions were prepared (P1, crude nuclear fraction; P2, crude mitochondrial fraction; S2, post mitochondrial fraction) and incubated with the radiolabeled photo-probe in the presence or absence of 25 µM MSDC-0160 as indicated. Samples were subjected to one dimensional SDS-PAGE and the dried gel was exposed to X-ray film. The red arrows point to the image of the selectively crosslinked native and C-terminal extension proteins. (C) Crosslinked BRP44 6×His is selectively immunoprecipitated by antibodies to 6×His. Membranes from HEK293 cells stably transfected with BRP44 6×His (right lanes, 6 His) or non transfected cells (left lanes, control) were crosslinked with or without competition with MSDC-0160 as in B. The membranes, all of which contained the specifically crosslinked band as shown in B, were then solubilized and immunoprecipitation was carried out with anti-His agarose beads. The resulting pellets were solubilized and submitted to SDS-PAGE. The corresponding autoradiogram is shown demonstrating that the radioactive band is only precipitated by anti-His tag in the tissue from the cells expressing His-6 BRP44.CC BY · PubMed Central
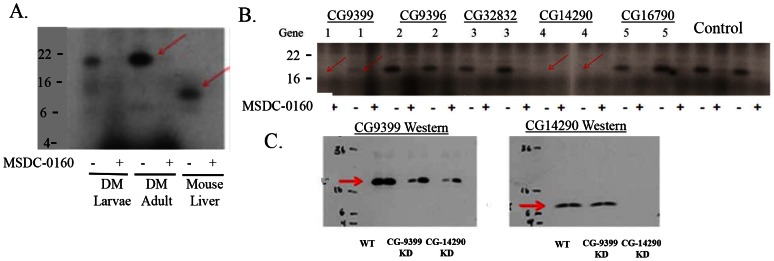
Figure 5 Crosslinking of the Drosophila ortholog in wild type and knockdown lines. (A) Wild-type larvae and adult flies were homogenized and mitochondrial pellets were crosslinked with and without the addition of MSDC-0160 as in figure 1. The autoradiograms of the resulting image of the specifically crosslinked proteins are shown for the flies on the left side compared to mouse liver in the lane on the right. (B) Fly stocks carrying RNAi constructs were crossed to Act-GAL4 driver and progeny tissues were processed and crosslinked as described in the text. Lanes marked “1” were from knockdowns of CG9399, lanes marked “4” were from knockdowns of CG14290, the other lanes were either unrelated genes or control strains. Two separate knockdown lines are represented. The complete list of the strains is shown in the text. Red arrows indicate reduced crosslinking of the specific CG9399 protein (BRP44 ortholog). (C) Membrane samples from CG9399 and CG14290 KD as in B were subjected to Western blot analysis for either the CG9399 (left) or CG14290 protein (right).
Figure 5 Crosslinking of the Drosophila ortholog in wild type and knockdown lines. (A) Wild-type larvae and adult flies were homogenized and mitochondrial pellets were crosslinked with and without the addition of MSDC-0160 as in figure 1. The autoradiograms of the resulting image of the specifically crosslinked proteins are shown for the flies on the left side compared to mouse liver in the lane on the right. (B) Fly stocks carrying RNAi constructs were crossed to Act-GAL4 driver and progeny tissues were processed and crosslinked as described in the text. Lanes marked “1” were from knockdowns of CG9399, lanes marked “4” were from knockdowns of CG14290, the other lanes were either unrelated genes or control strains. Two separate knockdown lines are represented. The complete list of the strains is shown in the text. Red arrows indicate reduced crosslinking of the specific CG9399 protein (BRP44 ortholog). (C) Membrane samples from CG9399 and CG14290 KD as in B were subjected to Western blot analysis for either the CG9399 (left) or CG14290 protein (right).CC BY · PubMed Central
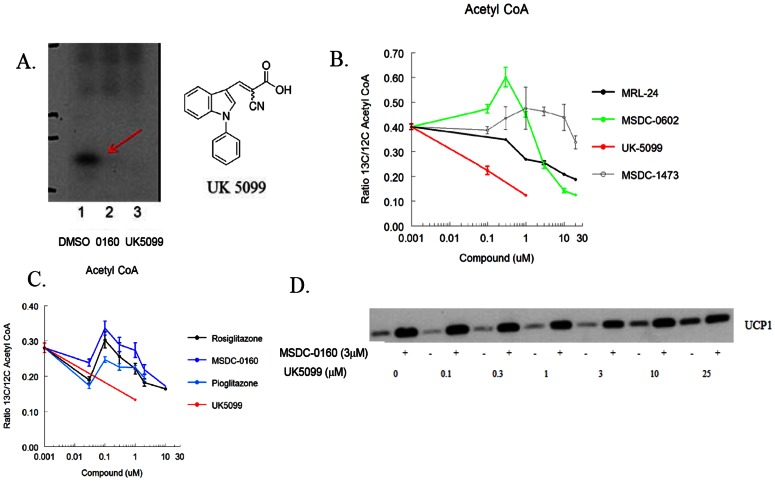
Figure 6 BPR44 and BRP44L are involved in pyruvate transport. (A) UK5099 structure and effect of adding either 25 µM MSDC-0160 (lane 2) or UK5099 (lane 3) on crosslinking of BRP44 (Mpc2). Lane 1 is the DMSO control. (B) Incubation of mouse BAT cells with UK5099 effectively limits carbon flow from U-13C glucose into acetyl CoA (red line) while MSDC-0602 has a biphasic dose response. The non TZD insulin sensitizer MRL-24 also modulated flow of carbon into acetyl CoA under these conditions. Data are the ratio of Acetyl CoA (13C/12C) derived from U-13C glucose following a 2 hour pre-incubation and a 15 minute flux at 37C (n = 3; mean and SE; representative of 3 experiments) as described in the Methods. (C) A separate experiment similar to that shown in B with other TZDs. (D) BAT progenitor cells were incubated with the indicated concentrations of UK5099 with (+) or without (−) 3 µM MSDC-0160 for 5 days. Cells were lysed and Western blots were conducted for UCP1 as in Figure 1B.
Figure 6 BPR44 and BRP44L are involved in pyruvate transport. (A) UK5099 structure and effect of adding either 25 µM MSDC-0160 (lane 2) or UK5099 (lane 3) on crosslinking of BRP44 (Mpc2). Lane 1 is the DMSO control. (B) Incubation of mouse BAT cells with UK5099 effectively limits carbon flow from U-13C glucose into acetyl CoA (red line) while MSDC-0602 has a biphasic dose response. The non TZD insulin sensitizer MRL-24 also modulated flow of carbon into acetyl CoA under these conditions. Data are the ratio of Acetyl CoA (13C/12C) derived from U-13C glucose following a 2 hour pre-incubation and a 15 minute flux at 37C (n = 3; mean and SE; representative of 3 experiments) as described in the Methods. (C) A separate experiment similar to that shown in B with other TZDs. (D) BAT progenitor cells were incubated with the indicated concentrations of UK5099 with (+) or without (−) 3 µM MSDC-0160 for 5 days. Cells were lysed and Western blots were conducted for UCP1 as in Figure 1B.CC BY · PubMed Central
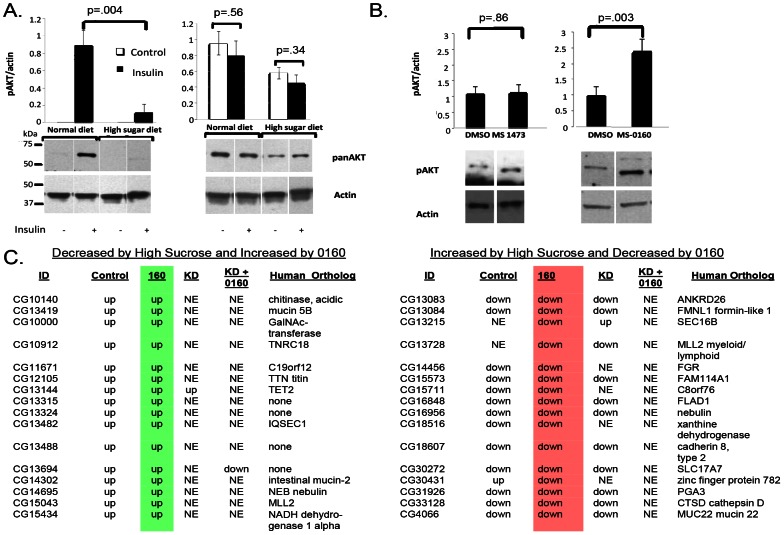
Figure 7 Insulin sensitizer effects in wild type and knockdown flies. (A) Acute insulin action was measured in inverted larvae in the absence (−) or presence (+) of 2 µM recombinant insulin. The larvae were either grown under control conditions (left) or in the presence of high sucrose (right). Representative Western blots are shown below and the calculated areas are shown above for pAKT (left side) or total AKT (right side) normalized to actin in the absence (open bars) or presence of insulin (upper bars). An unpaired, two-tailed t-test was used to derive p-values. Error bars are ± SE (N = 3). (B) Effect of incubation with DMSO, MSDC-1473 or MSDC-0160 on the amount of insulin-stimulated phosphorylation of AKT under the high sucrose conditions (detected and analyzed as in A; mean and SE, N = 3). (C) Wild-type female flies or flies with knockdown of CG14290 (as in Figure 5) were raised on a 0.75M sucrose matrix and aged for 7 days with or without MSDC-0160 added to the matrix. RNA from flies grown under these conditions was extracted and full genome expression analysis was performed using the Agilent system. Conditions in the presence of the high sugar included control flies in addition to knock down of CG14290 (line 15858). MSDC-0160 was provided to either control or line 15859 knockdown flies. The data shown reflect changes that were more than 1.5 fold different and t-test value <9E-03 relative to the high sucrose DMSO control in terms of increase (green) or decrease (red). The list of genes, along with the mammalian ortholog names, are shown on the left in the case of where the expression was decreased in the presence of high sucrose and thus increased with the treatment of MSDC-0160 and on the right for the transcripts that were increased in the presence of high sucrose and thus reduced with the treatment with MSDC-0160. All MSDC-0160-induced changes were lost in the knockdown strain.
Figure 7 Insulin sensitizer effects in wild type and knockdown flies. (A) Acute insulin action was measured in inverted larvae in the absence (−) or presence (+) of 2 µM recombinant insulin. The larvae were either grown under control conditions (left) or in the presence of high sucrose (right). Representative Western blots are shown below and the calculated areas are shown above for pAKT (left side) or total AKT (right side) normalized to actin in the absence (open bars) or presence of insulin (upper bars). An unpaired, two-tailed t-test was used to derive p-values. Error bars are ± SE (N = 3). (B) Effect of incubation with DMSO, MSDC-1473 or MSDC-0160 on the amount of insulin-stimulated phosphorylation of AKT under the high sucrose conditions (detected and analyzed as in A; mean and SE, N = 3). (C) Wild-type female flies or flies with knockdown of CG14290 (as in Figure 5) were raised on a 0.75M sucrose matrix and aged for 7 days with or without MSDC-0160 added to the matrix. RNA from flies grown under these conditions was extracted and full genome expression analysis was performed using the Agilent system. Conditions in the presence of the high sugar included control flies in addition to knock down of CG14290 (line 15858). MSDC-0160 was provided to either control or line 15859 knockdown flies. The data shown reflect changes that were more than 1.5 fold different and t-test value <9E-03 relative to the high sucrose DMSO control in terms of increase (green) or decrease (red). The list of genes, along with the mammalian ortholog names, are shown on the left in the case of where the expression was decreased in the presence of high sucrose and thus increased with the treatment of MSDC-0160 and on the right for the transcripts that were increased in the presence of high sucrose and thus reduced with the treatment with MSDC-0160. All MSDC-0160-induced changes were lost in the knockdown strain.CC BY · PubMed Central

Verification

Claims the paper makes

The claims and statistics of this paper haven’t been checked yet.

Run the check — free, no account needed. It reads the open-access text and checks the sources it cites.

A few free checks a day · papers already verified open instantly · results are public

Claims other papers make about this one

Each is checked against this paper’s own text: does it say what the citing paper says it does?

Self-check

Percentages, sums and reported differences re-computed from the paper’s own numbers.

The self-check needs the paper’s full text.

Citations

Cites

Show all 30 references

Cited by

Sorted by citations

See all 173

Metadata

Authors
Colca, J. R., McDonald, W. G., Cavey, G. S., Cole, S. L., Holewa, D. D., Brightwell-Conrad, A. S., Wolfe, C. L., Wheeler, J. S., Coulter, K. R., Kilkuskie, P. M., Gracheva, E., Korshunova, Y., Trusgnich, M., Karr, R., Wiley, S. E., Divakaruni, A. S., Murphy, A. N., Vigueira, P. A., Finck, B. N., & Kletzien, R. F.
Affiliations
  • Metabolic Solutions Development Company (United States) (US)
  • University of California San Diego (US)
  • Washington University in St. Louis (US)
Corresponding author
Colca, Jerry R.
Venue
PLoS ONE
Published
2013-05-15
Volume
8
Issue
5
Pages
e61551
ISSN
1932-6203 (ISSN-L)
OpenAlex
W2165311378
Cited by
171
References
30
Citations by year
2026: 6 · 2025: 4 · 2024: 9 · 2023: 12 · 2022: 14 · 2021: 12 · 2020: 14 · 2019: 13 · 2018: 15 · 2017: 20 · 2016: 17 · 2015: 8 · 2014: 17 · 2013: 9
FWCI
7.61
Type
journal article
Language
en
Open access
Locations
  • PLoS ONE (publishedVersion, cc-by)
  • Europe PMC (PubMed Central) (publishedVersion, cc-by)
  • PubMed Central (publishedVersion, cc-by)
  • PubMed (publishedVersion)
  • Digital Commons@Becker (Washington University School of Medicine) (submittedVersion)
  • DOAJ (DOAJ: Directory of Open Access Journals) (submittedVersion, cc-by-sa)
  • eScholarship (California Digital Library) (submittedVersion)
  • eScholarship (California Digital Library) (submittedVersion, cc-by)
Funders
  • Michigan Economic Development Corporation
  • National Institutes of Health
  • National Institute on Alcohol Abuse and Alcoholism (AA21228, R42AA021228)
  • National Institute of Diabetes and Digestive and Kidney Diseases (R41DK084596, DK081298, DK84596, R42DK081298)
Topics
  • Life Sciences › Biochemistry, Genetics and Molecular Biology › Molecular Biology › Metabolism, Diabetes, and Cancer
  • Life Sciences › Biochemistry, Genetics and Molecular Biology › Molecular Biology › Mitochondrial Function and Pathology
  • Life Sciences › Biochemistry, Genetics and Molecular Biology › Molecular Biology › Peroxisome Proliferator-Activated Receptors
Keywords
thiazolidinediones, insulin sensitizers, mitochondrial pyruvate carrier, MPC1, MPC2, pyruvate transport, acetyl-CoA biosynthesis, brown adipose tissue, hemolymph glucose, Drosophila melanogaster, drug target identification
MeSH terms
Insulin Secretion, Amino Acid Sequence, Animals, Adipose Tissue, Brown, Drosophila melanogaster, Humans, Hypoglycemic Agents, Insulin, Mitochondria, Molecular Sequence Data, Sequence Homology, Amino Acid, Membrane Transport Proteins, Monocarboxylic Acid Transporters, Mitochondrial Membrane Transport Proteins, Thiazolidinediones, Gene Knockdown Techniques, HEK293 Cells

About these checks

Registry, retraction, Cites and statistics results are computed, not judged, with one exception: a printed reference that no index lists is read once by a model before it counts as a citation error. Claims are extracted by a model and kept only when their quote appears verbatim in the text; each cited source is then checked, with a model’s help, for whether it says what the claim relies on. Those verdicts can be wrong — read the claim’s quote and the cited source before relying on one.

Statistics and arithmetic are recomputed, not judged.

Confidence bands are shown only for fields calibrated on our annotated test set. None is calibrated yet, so no band is shown.

What counts as a claim ›How we measure confidence ›How we check this ›

Are you an author, or do you see a problem with this page? Request a review