

The DOI matches its Crossref record; 71 of the 71 references it cites were found in a registry or an index.
Relaxation Response Induces Temporal Transcriptome Changes in Energy Metabolism, Insulin Secretion and Inflammatory Pathways
Open accessAbstract
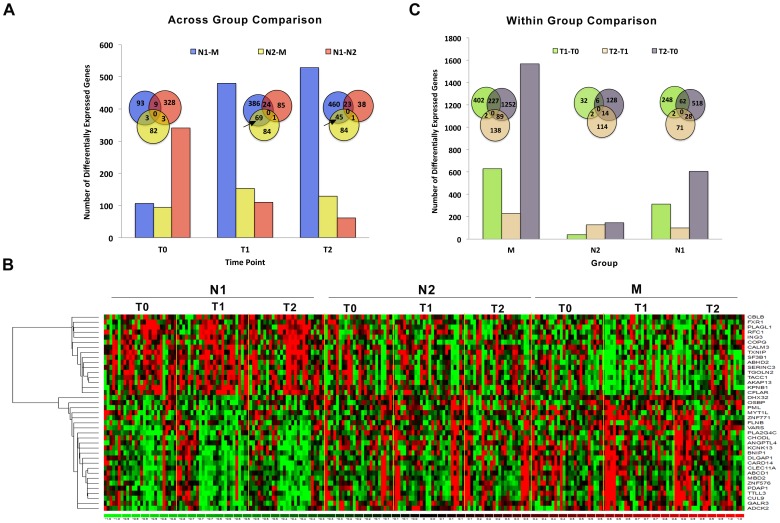
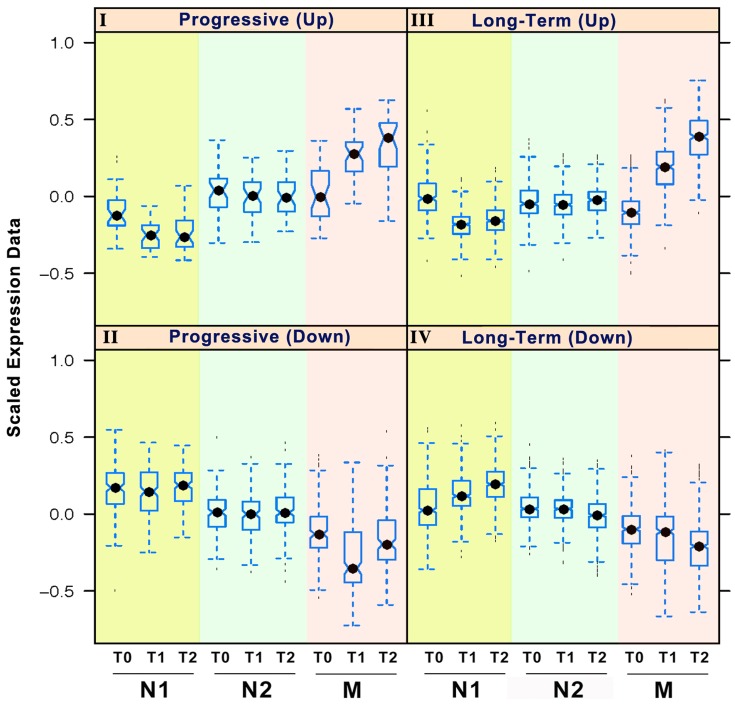
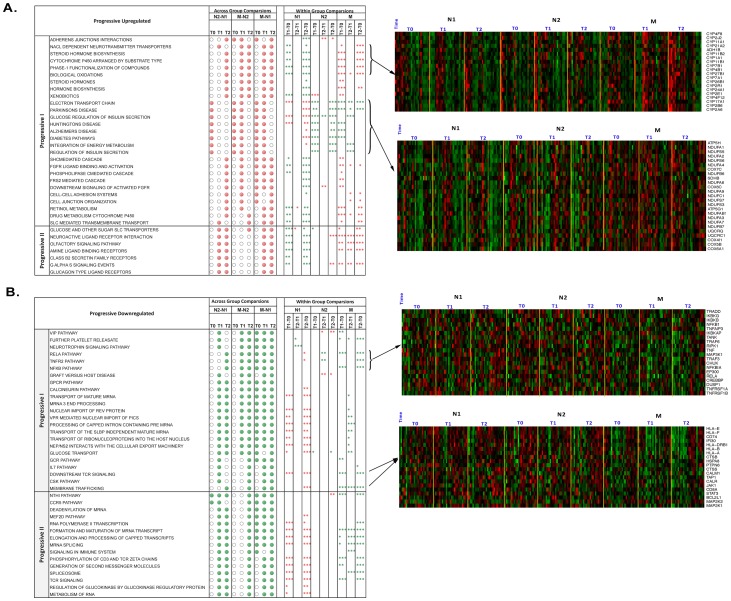
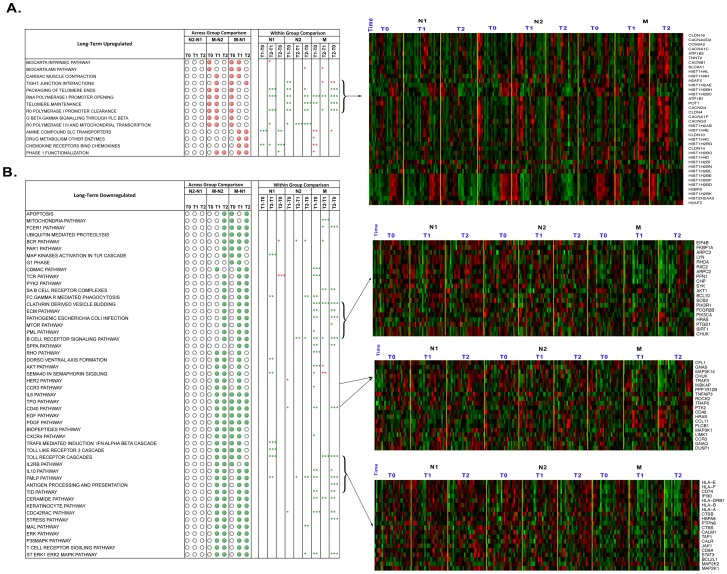
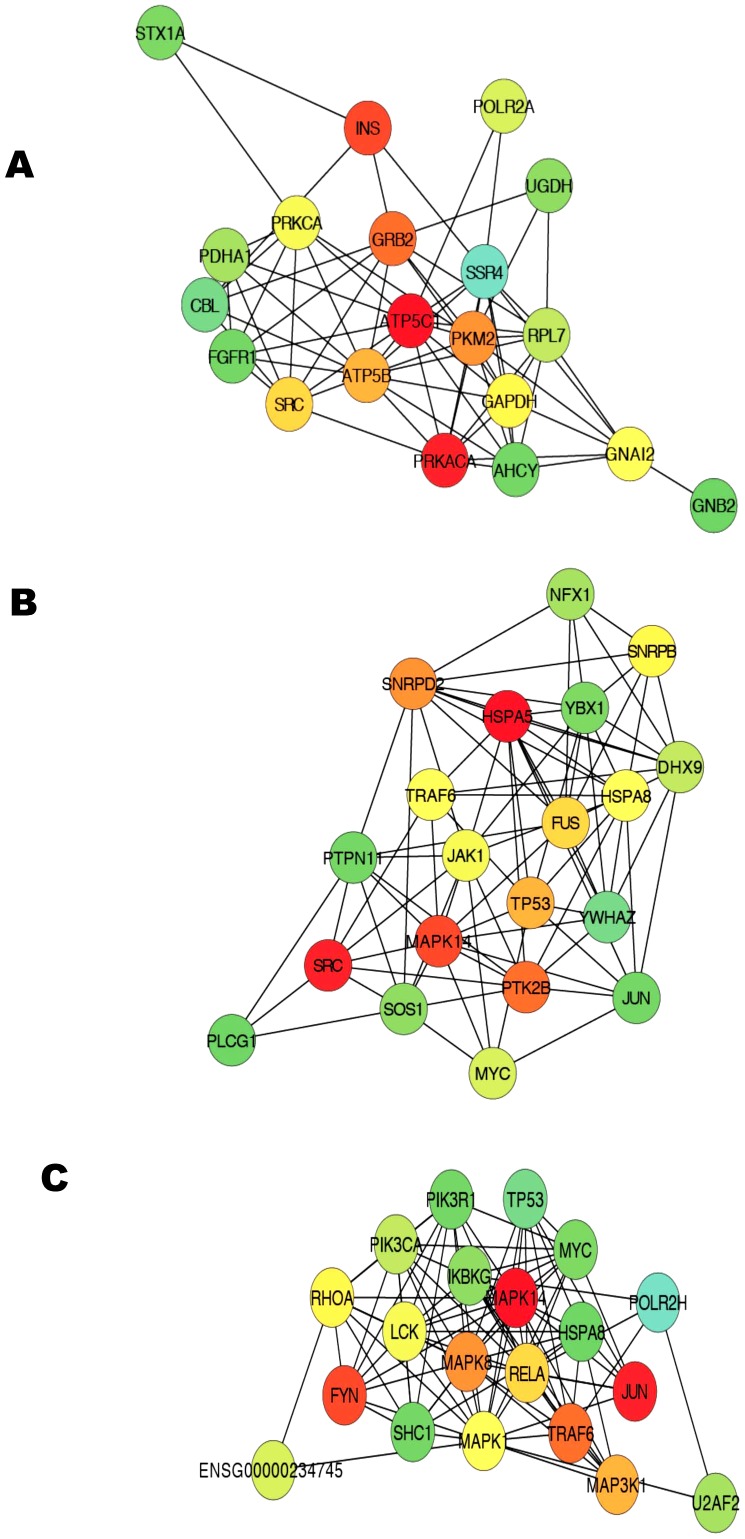
The relaxation response (RR) is the counterpart of the stress response. Millennia-old practices evoking the RR include meditation, yoga and repetitive prayer. Although RR elicitation is an effective therapeutic intervention that counteracts the adverse clinical effects of stress in disorders including hypertension, anxiety, insomnia and aging, the underlying molecular mechanisms that explain these clinical benefits remain undetermined. To assess rapid time-dependent (temporal) genomic changes during one session of RR practice among healthy practitioners with years of RR practice and also in novices before and after 8 weeks of RR training, we measured the transcriptome in peripheral blood prior to, immediately after, and 15 minutes after listening to an RR-eliciting or a health education CD. Both short-term and long-term practitioners evoked significant temporal gene expression changes with greater significance in the latter as compared to novices. RR practice enhanced expression of genes associated with energy metabolism, mitochondrial function, insulin secretion and telomere maintenance, and reduced expression of genes linked to inflammatory response and stress-related pathways. Interactive network analyses of RR-affected pathways identified mitochondrial ATP synthase and insulin (INS) as top upregulated critical molecules (focus hubs) and NF-κB pathway genes as top downregulated focus hubs. Our results for the first time indicate that RR elicitation, particularly after long-term practice, may evoke its downstream health benefits by improving mitochondrial energy production and utilization and thus promoting mitochondrial resiliency through upregulation of ATPase and insulin function. Mitochondrial resiliency might also be promoted by RR-induced downregulation of NF-κB-associated upstream and downstream targets that mitigates stress.
Overview
The claims and statistics of this paper haven’t been checked yet.
Run the check — free, no account needed. It reads the open-access text and checks the sources it cites.
Integrity signals
Registry
Cites
Statistics
Figures
Verification
Claims the paper makes
The claims and statistics of this paper haven’t been checked yet.
Run the check — free, no account needed. It reads the open-access text and checks the sources it cites.
Claims other papers make about this one
Each is checked against this paper’s own text: does it say what the citing paper says it does?
The cited source says what the claim attributes to it.
In the citing paper
“practices eliciting relaxation responses as the counterpart of the stress response have been demonstrated to evoke expression rate changes in genes associated with pro-inflammatory responses, stress-related cellular signaling, energy metabolism, mitochondrial functioning, insulin secretion and telomere maintenance (Bhasin et al., 2013).”
From The applied implications of epigenetics in anxiety, affective and stress-related disorders - A review and synthesis on psychosocial stress, psychotherapy and prevention (2020) · cites this paper as Bhasin et al., 2013
In the citing paper
“RR enhances genes associated with energy metabolism, mitochondrial function, insulin secretion, and telomere maintenance, while reducing those linked to inflammation and stress [40,60,61].”
From Comprehensive review of chronic stress pathways and the efficacy of behavioral stress reduction programs (BSRPs) in managing diseases. (2024) · cites this paper as [60]
In the citing paper
“Research indicates that both novice and long-term practitioners of RR experience significant gene expression changes, with long-term practitioners showing greater effects.”
From Comprehensive review of chronic stress pathways and the efficacy of behavioral stress reduction programs (BSRPs) in managing diseases. (2024) · cites this paper as [60]
Self-check
Percentages, sums and reported differences re-computed from the paper’s own numbers.
The self-check needs the paper’s full text.
Citations
Cites
Subramanian, A., Tamayo, P., Mootha, V. K., Mukherjee, S., Ebert, B. L., Gillette, M. A., Paulovich, A., Pomeroy, S. L., Golub, T. R., Lander, E. S., et al. (2005) · Proceedings of the National Academy of Sciences · doi:10.1073/pnas.0506580102 · Cited by 53,625
Cytoscape: A software Environment for integrated models of biomolecular interaction networks
Shannon, P., Markiel, A., Ozier, O., Baliga, N. S., Wang, J. T., Ramage, D., Amin, N., Schwikowski, B., & Ideker, T. (2003) · Genome Research · doi:10.1101/gr.1239303 · Cited by 51,888
Endothelium-derived relaxing factor produced and released from artery and vein is nitric oxide.
Ignarro, L. J., Buga, G. M., Wood, K. S., Byrns, R. E., & Chaudhuri, G. (1987) · Proceedings of the National Academy of Sciences · doi:10.1073/pnas.84.24.9265 · Cited by 5,074
Human Protein Reference Database--2009 update
Prasad, T. S. K., Goel, R., Kandasamy, K., Keerthikumar, S., Kumar, S., Mathivanan, S., Telikicherla, D., Raju, R., Shafreen, R. B., Venugopal, A., et al. (2008) · Nucleic Acids Research · doi:10.1093/nar/gkn892 · Cited by 3,252
(2005) · American Journal of Respiratory and Critical Care Medicine · doi:10.1164/rccm.200406-710st · Cited by 3,203
Psychological Stress and Disease
Cohen, S., Janicki-Deverts, D., & Miller, G. E. (2007) · JAMA · doi:10.1001/jama.298.14.1685 · Cited by 3,168
Model-based analysis of oligonucleotide arrays: Expression index computation and outlier detection.
Li, C., & Wong, W. H. (2001) · Proceedings of the National Academy of Sciences · doi:10.1073/pnas.98.1.31 · Cited by 3,133
On the Interpretation of χ 2 from Contingency Tables, and the Calculation of P
Fisher, R. A. (1922) · Journal Of The Royal Statistical Society · doi:10.2307/2340521 · Cited by 2,975
Tamayo, P., Slonim, D. K., Mesirov, J. P., Zhu, Q., Kitareewan, S., Dmitrovsky, E., Lander, E. S., & Golub, T. R. (1999) · Proceedings of the National Academy of Sciences · doi:10.1073/pnas.96.6.2907 · Cited by 2,924
Benson, H., Beary, J. F., & Carol, M. P. (1974) · Psychiatry · doi:10.1080/00332747.1974.11023785 · Cited by 2,467
Self-citation
Research works printed but not linked: 1
- HB Benson, 1974, The relaxation response, Psychiatry: Journal for the Study of Interpersonal Processes, 37, 37, 10.1080/00332747.1974.11023785 · DOI
Cited by
Sorted by citations
Oxidative stress and male infertility
Bisht, S., Faiq, M. A., Tolahunase, M., & Dada, R. (2017) · Nature Reviews Urology · doi:10.1038/nrurol.2017.69 · Cited by 918
Kuo, M. (2015) · Frontiers in Psychology · doi:10.3389/fpsyg.2015.01093 · Cited by 900
Cole, S. W. (2014) · PLoS Genetics · doi:10.1371/journal.pgen.1004601 · Cited by 415
Mind–body therapies and control of inflammatory biology: A descriptive review
Bower, J. E., & Irwin, M. R. (2016) · Brain, Behavior, and Immunity · doi:10.1016/j.bbi.2015.06.012 · Cited by 388
“However, there are corroborating data from another group that found decreased NF-jB activity following acute induction of the relaxation response (Bhasin et al., 2013).”
BackgroundLevine, G. N., Lange, R. A., Bairey‐Merz, C. N., Davidson, R. J., Jamerson, K., Mehta, P. K., Michos, E. D., Norris, K., Ray, I. B., Saban, K. L., et al. (2017) · Journal of the American Heart Association · doi:10.1161/jaha.117.002218 · Cited by 330
Disentangling the Links Between Psychosocial Stress and Cardiovascular Disease
Osborne, M. T., Shin, L. M., Mehta, N. N., Pitman, R. K., Fayad, Z. A., & Tawakol, A. A. (2020) · Circulation Cardiovascular Imaging · doi:10.1161/circimaging.120.010931 · Cited by 339
Rapid changes in histone deacetylases and inflammatory gene expression in expert meditators
Kaliman, P., Álvarez-López, M. J., Cosín-Tomás, M., Rosenkranz, M. A., Lutz, A., & Davidson, R. J. (2014) · Psychoneuroendocrinology · doi:10.1016/j.psyneuen.2013.11.004 · Cited by 300
Group mindfulness-based therapy significantly improves sexual desire in women
Brotto, L. A., & Basson, R. (2014) · Behaviour Research and Therapy · doi:10.1016/j.brat.2014.04.001 · Cited by 248
Burić, I., Farias, M., Jong, J., Mee, C., & Brazil, I. A. (2017) · Frontiers in Immunology · doi:10.3389/fimmu.2017.00670 · Cited by 240
Qigong and Tai-Chi for Mood Regulation
Yeung, A., Chan, J. S. M., Cheung, J. C., & Zou, L. (2018) · Focus · doi:10.1176/appi.focus.20170042 · Cited by 176
Amihai, I., & Kozhevnikov, M. (2014) · PLoS ONE · doi:10.1371/journal.pone.0102990 · Cited by 173
Cardiac ageing: extrinsic and intrinsic factors in cellular renewal and senescence
Gude, N. A., Broughton, K. M., Firouzi, F., & Sussman, M. A. (2018) · Nature Reviews Cardiology · doi:10.1038/s41569-018-0061-5 · Cited by 172
Kéri, S., Szabó, C., & Kelemen, O. (2014) · Brain, Behavior, and Immunity · doi:10.1016/j.bbi.2014.03.020 · Cited by 165
Schiele, M. A., Gottschalk, M. G., & Domschke, K. (2020) · Clinical Psychology Review · doi:10.1016/j.cpr.2020.101830 · Cited by 156
Veling, W., Lestestuiver, B., Jongma, M., Hoenders, R. H. J., & van Driel, C. M. G. (2021) · Journal of Medical Internet Research · doi:10.2196/17233 · Cited by 165
Stress, Meditation, and Alzheimer’s Disease Prevention: Where The Evidence Stands
Khalsa, D. S. (2015) · Journal of Alzheimer s Disease · doi:10.3233/jad-142766 · Cited by 150
Stefanaki, C., Bacopoulou, F., Livadas, S., Kandaraki, A., Karachalios, A., Chrousos, G. P., & Diamanti‐Kandarakis, E. (2014) · Stress · doi:10.3109/10253890.2014.974030 · Cited by 128
Lifestyle Effects on Hematopoiesis and Atherosclerosis
Nahrendorf, M., & Świrski, F. K. (2015) · Circulation Research · doi:10.1161/circresaha.116.303550 · Cited by 124
Meditation and vacation effects have an impact on disease-associated molecular phenotypes
Epel, E. S., Puterman, E., Lin, J., Blackburn, E. H., Lum, P. Y., Beckmann, N. D., Zhu, J., Lee, E., Gilbert, A., Rissman, R. A., et al. (2016) · Translational Psychiatry · doi:10.1038/tp.2016.164 · Cited by 105
Bushell, W. C., Castle, R. D., Williams, M. A., Brouwer, K., Tanzi, R., Chopra, D., & Mills, P. (2020) · Journal of Alternative and Complementary Medicine · doi:10.1089/acm.2020.0177 · Cited by 78
Larouche, E., Hudon, C., & Goulet, S. (2015) · Behavioural Brain Research · doi:10.1016/j.bbr.2014.05.058 · Cited by 93
Mind–body therapy via videoconferencing in patients with neurofibromatosis: An RCT
Vranceanu, A.-M., Riklin, E., Merker, V. L., Macklin, E. A., Park, E. R., & Plotkin, S. R. (2016) · Neurology · doi:10.1212/wnl.0000000000003005 · Cited by 85
Yoga and Mindfulness as Therapeutic Interventions for Stroke Rehabilitation: A Systematic Review
Lazaridou, A., Philbrook, P., & Tzika, A. A. (2013) · Evidence-based Complementary and Alternative Medicine · doi:10.1155/2013/357108 · Cited by 100
Our (Mother’s) Mitochondria and Our Mind
Krämer, P., & Bressan, P. (2017) · Perspectives on Psychological Science · doi:10.1177/1745691617718356 · Cited by 94
Gautam, S., Tolahunase, M., Kumar, U., & Dada, R. (2019) · Restorative Neurology and Neuroscience · doi:10.3233/rnn-180875 · Cited by 87
Zen meditation, Length of Telomeres, and the Role of Experiential Avoidance and Compassion
Alda, M., Puebla‐Guedea, M., Rodero, B., Demarzo, M., Montero‐Marín, J., Roca, M., & García‐Campayo, J. (2016) · Mindfulness · doi:10.1007/s12671-016-0500-5 · Cited by 93
Anti-S1P Antibody as a Novel Therapeutic Strategy for VEGFR TKI-Resistant Renal Cancer
Liang, Z., Wang, X., Bullock, A. J., Callea, M., Shah, H., Song, J., Moreno, K. M., Visentin, B., Deutschman, D. H., Alsop, D. C., et al. (2015) · Clinical Cancer Research · doi:10.1158/1078-0432.ccr-14-2031 · Cited by 85
Self-citationKuo, B., Bhasin, M., Jacquart, J., Scult, M. A., Slipp, L. E., Riklin, E. I. K., Lepoutre, V., Comosa, N., Norton, B.-A., Dassatti, A., et al. (2015) · PLoS ONE · doi:10.1371/journal.pone.0123861 · Cited by 85
Self-citationKaliman, P. (2018) · Current Opinion in Psychology · doi:10.1016/j.copsyc.2018.11.010 · Cited by 91
Pretty, J., & Barton, J. (2020) · International Journal of Environmental Research and Public Health · doi:10.3390/ijerph17217769 · Cited by 88
Vambheim, S. M., Kyllo, T. M., Hegland, S., & Bystad, M. K. (2021) · Heliyon · doi:10.1016/j.heliyon.2021.e07837 · Cited by 98
Molecules of Silence: Effects of Meditation on Gene Expression and Epigenetics
Venditti, S., Verdone, L., Reale, A., Vetriani, V., Caserta, M., & Zampieri, M. (2020) · Frontiers in Psychology · doi:10.3389/fpsyg.2020.01767 · Cited by 84
Gautam, S., Kumar, M., Kumar, U., & Dada, R. (2020) · Frontiers in Psychology · doi:10.3389/fpsyg.2020.02259 · Cited by 74
Shchaslyvyi, A. Y., Antonenko, S. V., & Telegeev, G. D. (2024) · International Journal of Environmental Research and Public Health · doi:10.3390/ijerph21081077 · Cited by 73
New research directions on disparities in obesity and type 2 diabetes
Thornton, P. L., Kumanyika, S., Gregg, E. W., Araneta, M. R. G., Baskin, M. L., Chin, M. H., Crespo, C. J., de Groot, M., Garcia, D. O., Haire-Joshu, D. L., et al. (2019) · Annals of the New York Academy of Sciences · doi:10.1111/nyas.14270 · Cited by 79
Building Resiliency in a Palliative Care Team: A Pilot Study
Mehta, D. H., Perez, G. K., Traeger, L. N., Park, E. R., Goldman, R. E., Haime, V., Chittenden, E., Denninger, J. W., & Jackson, V. A. (2015) · Journal of Pain and Symptom Management · doi:10.1016/j.jpainsymman.2015.10.013 · Cited by 79
Self-citationMeditation, stress processes, and telomere biology
Conklin, Q. A., Crosswell, A. D., Saron, C. D., & Epel, E. S. (2019) · Current Opinion in Psychology · doi:10.1016/j.copsyc.2018.11.009 · Cited by 69
Marciniak, R., Šumec, R., Vyhnálek, M., Bendíčková, K., Lázničková, P., Forte, G., Jeleník, A., Římalová, V., Frič, J., Hort, J., et al. (2020) · Clinical Interventions in Aging · doi:10.2147/cia.s249196 · Cited by 72
Sevinc, G., Hölzel, B. K., Hashmi, J., Greenberg, J., McCallister, A., Treadway, M., Schneider, M. L., Dusek, J. A., Carmody, J., & Lazar, S. W. (2018) · Psychosomatic Medicine · doi:10.1097/psy.0000000000000590 · Cited by 67
Self-citationConklin, Q. A., King, B. G., Zanesco, A. P., Lin, J., Hamidi, A. B., Pokorny, J. J., Álvarez-López, M. J., Cosín-Tomás, M., Huang, C., Kaliman, P., et al. (2018) · Brain, Behavior, and Immunity · doi:10.1016/j.bbi.2018.03.003 · Cited by 66
Complementary or alternative medicine in cancer care—myths and realities
Deng, G. E., & Cassileth, B. R. (2013) · Nature Reviews Clinical Oncology · doi:10.1038/nrclinonc.2013.125 · Cited by 64
Migraine, Brain Glucose Metabolism and the “Neuroenergetic” Hypothesis: A Scoping Review
Moro, L. D., Rota, E., Pirovano, E., & Rainero, I. (2022) · Journal of Pain · doi:10.1016/j.jpain.2022.02.006 · Cited by 66
Twal, W. O., Wahlquist, A. E., & Balasubramanian, S. (2016) · BMC Complementary and Alternative Medicine · doi:10.1186/s12906-016-1286-7 · Cited by 63
Cohen, M. M., Elliott, F., Oates, L., Schembri, A. J., & Mantri, N. L. (2017) · The Journal of Alternative and Complementary Medicine · doi:10.1089/acm.2016.0268 · Cited by 59
Psycho-neuro-endocrine-immune mechanisms of action of yoga in type II diabetes
Singh, V. P., Khandelwal, B., & Sherpa, N. T. (2015) · Ancient Science of Life · doi:10.4103/0257-7941.165623 · Cited by 58
The Effects of Stress and Meditation on the Immune System, Human Microbiota, and Epigenetics.
Househam, A. M., Peterson, C. T., Mills, P. J., & Chopra, D. (2017) · PubMed · Cited by 57
Blödt, S., Pach, D., Roll, S., & Witt, C. M. (2014) · Trials · doi:10.1186/1745-6215-15-490 · Cited by 54
Positive Psychological Functioning and the Biology of Health
Kubzansky, L. D., Boehm, J. K., & Segerstrom, S. C. (2015) · Social and Personality Psychology Compass · doi:10.1111/spc3.12224 · Cited by 56
A healthy aging program for older adults: effects on self-efficacy and morale.
Scult, M. A., Haime, V., Jacquart, J., Takahashi, J., Moscowitz, B., Webster, A., Denninger, J. W., & Mehta, D. H. (2015) · PubMed · Cited by 53
Self-citationHou, J., Yun, Y. J., Xue, J., Jeon, B.-M., & Kim, S. (2020) · Phytotherapy Research · doi:10.1002/ptr.6636 · Cited by 53
Kinser, P. A., & Lyon, D. (2014) · Brain and Behavior · doi:10.1002/brb3.249 · Cited by 53
Surya, M., Jaff, D., Stilwell, B., & Schubert, J. (2017) · Global Health Science and Practice · doi:10.9745/ghsp-d-17-00017 · Cited by 57
The impact of insomnia on frailty and the hallmarks of aging
Carvalhas-Almeida, C., Cavadas, C., & Álvaro, A. R. (2022) · Aging Clinical and Experimental Research · doi:10.1007/s40520-022-02310-w · Cited by 51
Gill, J., Lee, H., Barr, T. L., Baxter, T., Heinzelmann, M. M., Rak, H., & Mysliwiec, V. (2014) · Psychiatry Research · doi:10.1016/j.psychres.2014.01.046 · Cited by 54
Epigenetic Mechanisms of Integrative Medicine
Kanherkar, R. R., Stair, S. E., Bhatia‐Dey, N., Mills, P. J., Chopra, D., & Csoka, A. B. (2017) · Evidence-based Complementary and Alternative Medicine · doi:10.1155/2017/4365429 · Cited by 50
Buddhist Activities related to Sedentary behavior and Hypertension in Tibetan monks
Liu, K., Xu, Y., Wang, S., Shi, R., Gong, S., Li, X., Yang, Y., & Chen, X. (2018) · Journal of Human Hypertension · doi:10.1038/s41371-018-0136-0 · Cited by 47
Mezuk, B. R., Chen, Y., Yu, C., Guo, Y., Bian, Z., Collins, R., Chen, J., Pang, Z., Wang, H., Peto, R., et al. (2013) · Journal of Psychosomatic Research · doi:10.1016/j.jpsychores.2013.09.008 · Cited by 47
Resilience Against Traumatic Stress: Current Developments and Future Directions
Snijders, C., Pries, L.-K., Sgammeglia, N., Jowf, G. I. A., Youssef, N. A., de Nijs, L., Gülöksüz, S., & Rutten, B. P. F. (2018) · Frontiers in Psychiatry · doi:10.3389/fpsyt.2018.00676 · Cited by 49
Adversity in preschool-aged children: Effects on salivary interleukin-1β
Tyrka, A. R., Parade, S. H., Valentine, T. R., Eslinger, N. M., & Seifer, R. (2015) · Development and Psychopathology · doi:10.1017/s0954579415000164 · Cited by 48
Gaertner, R. J., Kossmann, K. E., Benz, A., Bentele, U. U., Meier, M., Denk, B., Klink, E. S. C., Dimitroff, S. J., & Pruessner, J. C. (2023) · Journal of Environmental Psychology · doi:10.1016/j.jenvp.2023.102035 · Cited by 48
Brief quiet ego contemplation reduces oxidative stress and mind-wandering
Wayment, H. A., Collier, A. F., Birkett, M., Traustadóttir, T., & Till, R. E. (2015) · Frontiers in Psychology · doi:10.3389/fpsyg.2015.01481 · Cited by 45
Rajamani, D., Singh, P. K., Rottmann, B. G., Singh, N., Bhasin, M., & Kumar, A. (2016) · Scientific Reports · doi:10.1038/srep21502 · Cited by 43
Self-citationQigong in Cancer Care: Theory, Evidence-Base, and Practice
Klein, P. J. (2017) · Medicines · doi:10.3390/medicines4010002 · Cited by 41
Integrative medicine considerations for convalescence from mild-to-moderate COVID-19 disease
Alschuler, L. N., Chiasson, A. M., Horwitz, R., STERNBERG, E. M., Crocker, R. L., Weil, A., & Maizes, V. (2020) · EXPLORE · doi:10.1016/j.explore.2020.12.005 · Cited by 39
Crosswell, A. D., Mayer, S. E., Whitehurst, L. N., Picard, M. A., Zebarjadian, S., & Epel, E. S. (2023) · Psychological Review · doi:10.1037/rev0000453 · Cited by 50
Chang, P., Knobf, M. T., Oh, B., & Funk, M. (2017) · Geriatric Nursing · doi:10.1016/j.gerinurse.2017.07.004 · Cited by 37
Araújo, W. S. D., Romero, W. G., Zandonade, E., & Amorim, M. H. C. (2016) · Revista Latino-Americana de Enfermagem · doi:10.1590/1518-8345.1249.2806 · Cited by 35
Grazzi, L., Raggi, A., D’Amico, D., Sansone, E., Leonardi, M., Andrasik, F., Gucciardi, A., Guido, D., & D’Andrea, G. (2018) · Cephalalgia · doi:10.1177/0333102418801584 · Cited by 34
Measuring a Journey without Goal: Meditation, Spirituality, and Physiology
Buttle, H. (2015) · BioMed Research International · doi:10.1155/2015/891671 · Cited by 40
Tyagi, A., Cohen, M. M., Reece, J., & Telles, S. (2014) · BMC Complementary and Alternative Medicine · doi:10.1186/1472-6882-14-445 · Cited by 34
Chromosomal Processes in Mind-Body Medicine: Chronic Stress, Cell Aging, and Telomere Length
Esch, T., Kream, R. M., & Stefano, G. B. (2018) · Medical science monitor basic research/Medical science monitor. Basic research · doi:10.12659/msmbr.911786 · Cited by 37
Mood, stress and longevity: convergence on ANK3
Rangaraju, S., Levey, D. F., Nho, K. T., Jain, N., Andrews, K. D., Le-Niculescu, H., Salomon, D. R., Saykin, A. J., Petrascheck, M., & Niculescu, A. B. (2016) · Molecular Psychiatry · doi:10.1038/mp.2016.65 · Cited by 33
Modulation of Gene Expression Regulated by the Transcription Factor NF-κB/RelA
Li, X., Zhao, Y., Tian, B., Jamaluddin, M., Mitra, A., Yang, J., Rowicka, M., Brasier, A. R., & Kudlicki, A. S. (2014) · Journal of Biological Chemistry · doi:10.1074/jbc.m113.539965 · Cited by 32
Vranceanu, A., Gonzalez, A., Niles, H. F., Fricchione, G. L., Baim, M. A., Yeung, A., Denninger, J. W., & Park, E. R. (2014) · Psychosomatics · doi:10.1016/j.psym.2014.01.005 · Cited by 32
Self-citationSelf-health monitoring and wearable neurotechnologies
Cannard, C., Brandmeyer, T., Wahbeh, H., & Arnaud Delorme, A. (2020) · Handbook of clinical neurology · doi:10.1016/b978-0-444-63934-9.00016-0 · Cited by 35
Kurth, F., Cherbuin, N., & Eileen Luders, A. (2017) · Frontiers in Psychology · doi:10.3389/fpsyg.2017.00860 · Cited by 33
Nature-Based Relaxation Videos and Their Effect on Heart Rate Variability
Benz, A., Gaertner, R. J., Meier, M., Unternäehrer, E., Scharndke, S., Jupe, C., Wenzel, M., Bentele, U. U., Dimitroff, S. J., Denk, B., et al. (2022) · Frontiers in Psychology · doi:10.3389/fpsyg.2022.866682 · Cited by 38
A scientific approach to silent consciousness
Baars, B. (2013) · Frontiers in Psychology · doi:10.3389/fpsyg.2013.00678 · Cited by 19
Metabolic Enhancement of the Soldier Brain
Friedl, K. E., & Grate, S. J. (2019) · Oxford University Press eBooks · doi:10.1093/oso/9780190455132.003.0002 · Cited by 29
A Call to Use the Multicomponent Exercise Tai Chi to Improve Recovery From COVID-19 and Long COVID
Castro, J. P., Kierkegaard, M., & Zeitelhofer, M. (2022) · Frontiers in Public Health · doi:10.3389/fpubh.2022.827645 · Cited by 29
Cytokine Levels in Panic Disorder: Evidence for a Dose-Response Relationship
da Silva, C. T. B., Costa, M. D. A., Bortoluzzi, A., Pfaffenseller, B., Vedana, F. M., Kapczinski, F. P., & Manfro, G. G. (2016) · Psychosomatic Medicine · doi:10.1097/psy.0000000000000384 · Cited by 32
Lin, C. D., Marinova, M., Rubino, G., Gola, E., Brocca, A., Pantano, G., Brugnolo, L., Sarais, C., Cucchini, U., Volpe, B., et al. (2017) · Journal of Traditional and Complementary Medicine · doi:10.1016/j.jtcme.2017.04.011 · Cited by 28
A nonpharmacological approach to improve sleep quality in older adults
Rawtaer, I., Mahendran, R., Chan, H. Y., Lei, F., & Kua, E. H. (2017) · Asia-Pacific Psychiatry · doi:10.1111/appy.12301 · Cited by 28
Implementation of an Integrative Coping and Resiliency Program for Nurses
Deible, S., Fioravanti, M. A., Tarantino, B., & Cohen, S. M. (2015) · Global Advances in Health and Medicine · doi:10.7453/gahmj.2014.057 · Cited by 29
Telomeres and telomere dynamics: relevance to cancers of the GI tract
Basu, N., Skinner, H. G., Litzelman, K., Vanderboom, R. J., Baichoo, E., & Boardman, L. A. (2013) · Expert Review of Gastroenterology & Hepatology · doi:10.1586/17474124.2013.848790 · Cited by 29
Sabti, M., Sasaki, K., Gadhi, C., & Isoda, H. (2019) · International Journal of Molecular Sciences · doi:10.3390/ijms20143556 · Cited by 30
More Than Meets the Eye: Toward a Post-Materialist Model of Consciousness
Brabant, O. (2016) · EXPLORE · doi:10.1016/j.explore.2016.06.006 · Cited by 28
Mind–body group treatment for women coping with infertility: a pilot study
Psaros, C., Kagan, L., Shifren, J. L., Willett, J., Jacquart, J., Alert, M. D., Macklin, E. A., Styer, A. K., Denninger, J. W., LaRoche, K. L., et al. (2014) · Journal of Psychosomatic Obstetrics & Gynecology · doi:10.3109/0167482x.2014.989983 · Cited by 28
Self-citationBreath work: mediating health through breathing apps and wearable technologies
Kressbach, M. (2018) · New Review of Film and Television Studies · doi:10.1080/17400309.2018.1444459 · Cited by 26
Hall, C. R., & Knuth, M. J. (2019) · Journal of Environmental Horticulture · doi:10.24266/0738-2898-37.2.63 · Cited by 26
Assessing Vocal Chanting as an Online Psychosocial Intervention
Simpson, F. M., Perry, G., & Thompson, W. F. (2021) · Frontiers in Psychology · doi:10.3389/fpsyg.2021.647632 · Cited by 30
Bhasin, M., Denninger, J. W., Huffman, J. C., Joseph, M. G., Niles, H. F., Chad‐Friedman, E., Goldman, R. E., Buczynski, B., Mahoney, B. A., Fricchione, G. L., et al. (2018) · The Journal of Alternative and Complementary Medicine · doi:10.1089/acm.2017.0053 · Cited by 26
Self-citationEditorial: What can Neuroscience Learn from Contemplative Practices?
Josipovic, Z., & Baars, B. J. (2015) · Frontiers in Psychology · doi:10.3389/fpsyg.2015.01731 · Cited by 30
Osborne, M. T., Abohashem, S., Zureigat, H., Abbasi, T. A., & Tawakol, A. A. (2020) · Journal of Nuclear Cardiology · doi:10.1007/s12350-020-02424-6 · Cited by 22
Yoga and Qigong for Health: Two Sides of the Same Coin?
Boaventura, P., Jaconiano, S., & Ribeiro, F. M. (2022) · Behavioral Sciences · doi:10.3390/bs12070222 · Cited by 26
Functional genomics in the study of mind-body therapies.
Niles, H. F., Mehta, D. H., Corrigan, A. A., Bhasin, M., & Denninger, J. W. (2014) · PubMed Central · Cited by 23
Self-citationAsk, T. F., Lugo, R. G., & Sütterlin, S. (2018) · Frontiers in Neuroscience · doi:10.3389/fnins.2018.00726 · Cited by 23
Yang, J., Du, Y. N., Shen, H., Shujie, R., Liu, Z., Zheng, D., Shi, Q., Li, Y., & Wei, G. (2022) · International Journal of Environmental Research and Public Health · doi:10.3390/ijerph191610284 · Cited by 27
Pilot study on epigenetic response to a mind-body treatment
Cozzolino, M., Guarino, F., Castiglione, S., Cicatelli, A., & Celia, G. (2017) · Europe PMC (PubMed Central) · doi:10.14273/unisa-2690 · Cited by 22
Meditation: A Polypill for Comprehensive Management of Glaucoma Patients
Dada, T., Ramesh, P., & Shakrawal, J. (2019) · Journal of Glaucoma · doi:10.1097/ijg.0000000000001406 · Cited by 22
Metadata
- Authors
- Bhasin, M. K., Dusek, J. A., Chang, B.-H., Joseph, M. G., Denninger, J. W., Fricchione, G. L., Benson, H., & Libermann, T. A.
- Affiliations
- Beth Israel Deaconess Medical Center (US)
- Abbott Northwestern Hospital (US)
- Boston University (US)
- Harvard University (US)
- Corresponding author
- Libermann, Towia A.
- ORCID
- Venue
- PLoS ONE
- Publisher
- Public Library of Science (PLoS)
- Published
- 2013-05-01
- Volume
- 8
- Issue
- 5
- Pages
- e62817
- ISSN
- 1932-6203 (ISSN-L)
- PMC
- PMC3641112
- OpenAlex
- W2163249197
- Cited by
- 304
- References
- 71
- Citations by year
- 2026: 8 · 2025: 15 · 2024: 13 · 2023: 38 · 2022: 34 · 2021: 14 · 2020: 24 · 2019: 16 · 2018: 33 · 2017: 25 · 2016: 20 · 2015: 26 · 2014: 26 · 2013: 11
- FWCI
- 30.78
- Type
- journal article
- Language
- en
- Update notices
- correction (2017-02-21)
- Open access
- gold
- doi.org
- Locations
- PLoS ONE (publishedVersion, cc-by)
- Europe PMC (PubMed Central) (publishedVersion, other-oa)
- PubMed Central (publishedVersion, cc-by)
- PubMed (publishedVersion)
- Digital Access to Scholarship at Harvard (DASH) (Harvard University) (submittedVersion, cc-by)
- DOAJ (DOAJ: Directory of Open Access Journals) (submittedVersion, cc-by-sa)
- eScholarship (California Digital Library) (submittedVersion, cc-by)
- Figshare (submittedVersion, cc-by)
- Funders
- Deutsches Krebsforschungszentrum
- National Institutes of Health (RR 01032)
- Centers for Disease Control and Prevention
- U.S. Public Health Service (H75/CCH 123424)
- National Center for Complementary and Alternative Medicine
- National Center for Research Resources (RR 01032, M01-RR-01032, M01RR001032)
- National Center for Chronic Disease Prevention and Health Promotion (R01DP000339)
- National Center for Complementary and Integrative Health (R01AT006464)
- Topics
- Social Sciences › Psychology › Clinical Psychology › Mindfulness and Compassion Interventions
- Health Sciences › Medicine › Complementary and alternative medicine › Biofield Effects and Biophysics
- Social Sciences › Health › Religion, Spirituality, and Psychology
- Keywords
- relaxation response, meditation, gene expression, transcriptome, energy metabolism, mitochondrial function, insulin secretion, telomere maintenance, NF-κB signaling, inflammation, stress response, mitochondrial ATP synthase, peripheral blood, stress resilience
- MeSH terms
- Insulin Secretion, Cross-Sectional Studies, Energy Metabolism, Gene Expression Regulation, Humans, Immune System, Insulin, Mitochondria, Nitric Oxide, Prospective Studies, Relaxation, Religion, Stress, Physiological, Yoga, Inflammation Mediators, Meditation, Oligonucleotide Array Sequence Analysis, Gene Regulatory Networks, Transcriptome, Telomere Homeostasis
About these checks
Registry, retraction, Cites and statistics results are computed, not judged, with one exception: a printed reference that no index lists is read once by a model before it counts as a citation error. Claims are extracted by a model and kept only when their quote appears verbatim in the text; each cited source is then checked, with a model’s help, for whether it says what the claim relies on. Those verdicts can be wrong — read the claim’s quote and the cited source before relying on one.
Statistics and arithmetic are recomputed, not judged.
Confidence bands are shown only for fields calibrated on our annotated test set. None is calibrated yet, so no band is shown.
What counts as a claim ›How we measure confidence ›How we check this ›
Are you an author, or do you see a problem with this page? Request a review
