

The DOI matches its Crossref record; 62 of the 62 references it cites were found in a registry or an index.
Intestinal Microbiota in Healthy U.S. Young Children and Adults—A High Throughput Microarray Analysis
Open accessAbstract
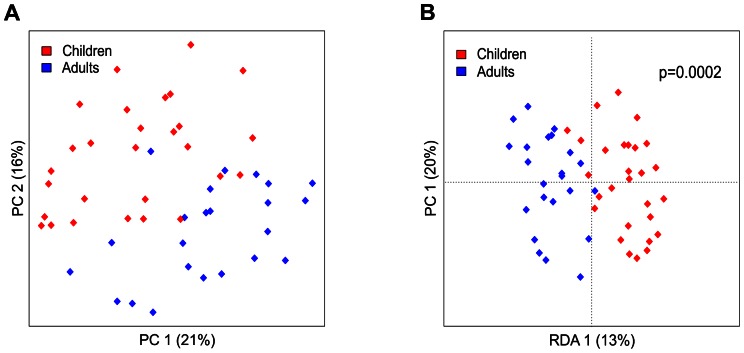
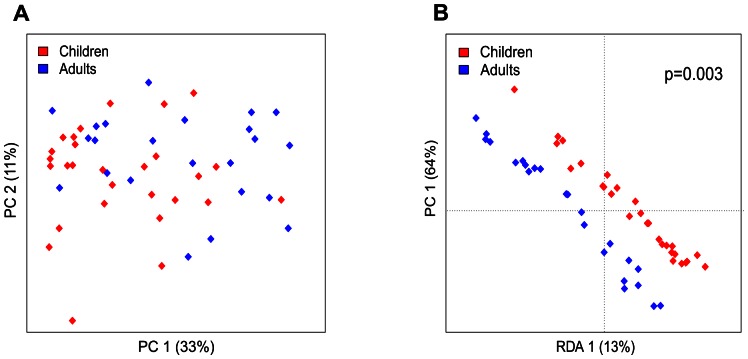
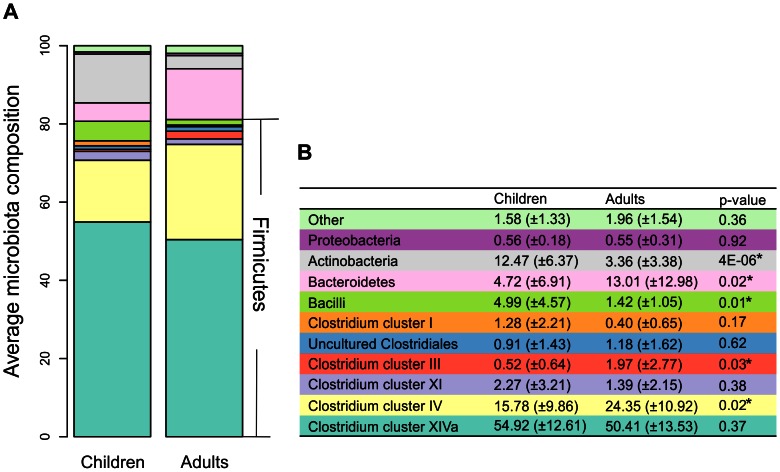
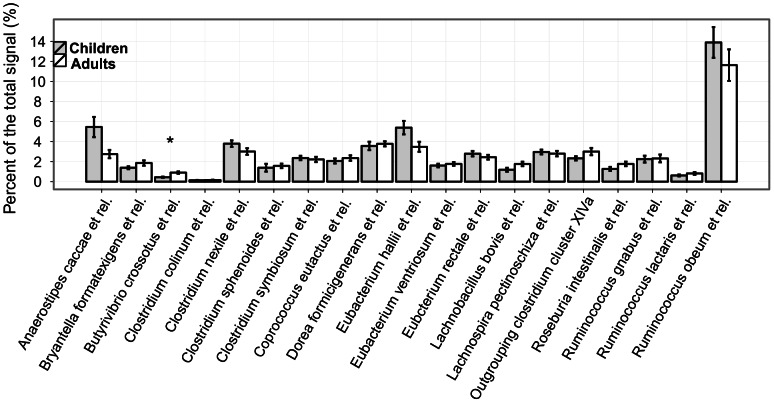
UNLABELLED: It is generally believed that the infant's microbiota is established during the first 1-2 years of life. However, there is scarce data on its characterization and its comparison to the adult-like microbiota in consecutive years. AIM: To characterize and compare the intestinal microbiota in healthy young children (1-4 years) and healthy adults from the North Carolina region in the U.S. using high-throughput bacterial phylogenetic microarray analysis. METHODS: Detailed characterization and comparison of the intestinal microbiota of healthy children aged 1-4 years old (n = 28) and healthy adults of 21-60 years (n = 23) was carried out using the Human Intestinal Tract Chip (HITChip) phylogenetic microarray targeting the V1 and V6 regions of 16S rRNA and quantitative PCR. RESULTS: The HITChip microarray data indicate that Actinobacteria, Bacilli, Clostridium cluster IV and Bacteroidetes are the predominant phylum-like groups that exhibit differences between young children and adults. The phylum-like group Clostridium cluster XIVa was equally predominant in young children and adults and is thus considered to be established at an early age. The genus-like level show significant 3.6 fold (higher or lower) differences in the abundance of 26 genera between young children and adults. Young U.S. children have a significantly 3.5-fold higher abundance of Bifidobacterium species than the adults from the same location. However, the microbiota of young children is less diverse than that of adults. CONCLUSIONS: We show that the establishment of an adult-like intestinal microbiota occurs at a later age than previously reported. Characterizing the microbiota and its development in the early years of life may help identify 'windows of opportunity' for interventional strategies that may promote health and prevent or mitigate disease processes.
Overview
The claims and statistics of this paper haven’t been checked yet.
Run the check — free, no account needed. It reads the open-access text and checks the sources it cites.
Integrity signals
Registry
Cites
Statistics
Figures
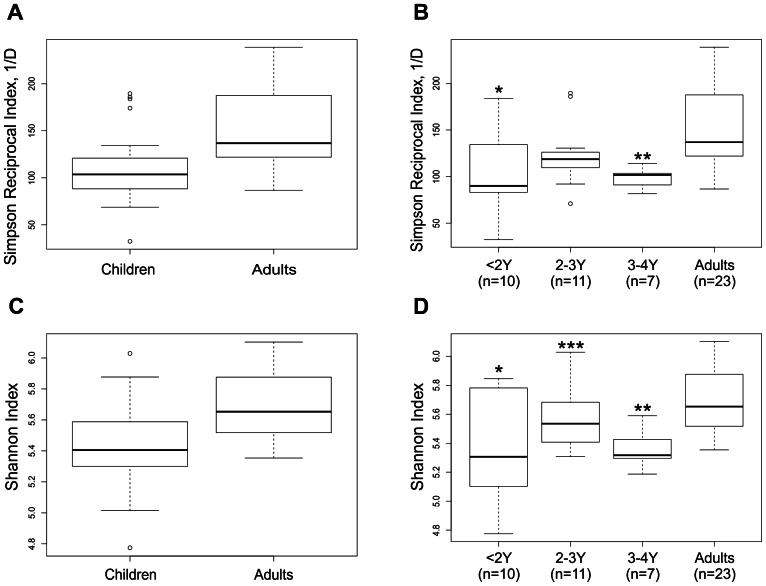
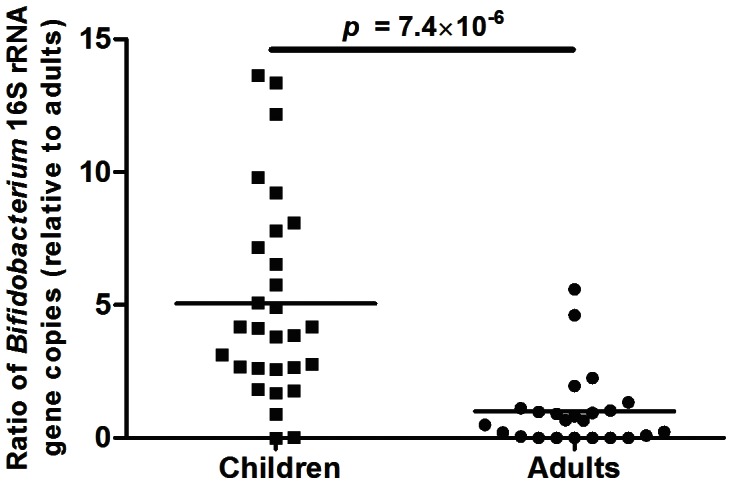
Verification
Claims the paper makes
The claims and statistics of this paper haven’t been checked yet.
Run the check — free, no account needed. It reads the open-access text and checks the sources it cites.
Claims other papers make about this one
Each is checked against this paper’s own text: does it say what the citing paper says it does?
In the citing paper
“The gut microbiota, however, may undergo a more prolonged development than previously suspected, with other evidence to indicate that it continues to develop past early childhood [82,83].”
From Effect of Diet on the Gut Microbiota: Rethinking Intervention Duration (2019) · cites this paper as [82]
Self-check
Percentages, sums and reported differences re-computed from the paper’s own numbers.
The self-check needs the paper’s full text.
Citations
Cites
R: A Language and Environment for Statistical Computing
R Core Team (2000) · doi:10.32614/r.manuals · Cited by 355,893
Data mining: concepts and techniques
Sharma, R., Shah, K., Shirahatti, Y., Patel, S., Sharma, R., Shah, K., Patel, S., Sharma, R., & Han, J. (2012) · Choice Reviews Online · doi:10.5860/choice.49-3305 · Cited by 28,665
Modern Applied Statistics with S
Venables, W. N., & Ripley, B. D. (2002) · Statisctics and computing/Statistics and computing · doi:10.1007/978-0-387-21706-2 · Cited by 25,941
An obesity-associated gut microbiome with increased capacity for energy harvest
Turnbaugh, P. J., Ley, R. E., Mahowald, M. A., Magrini, V., Mardis, E. R., & Gordon, J. I. (2006) · Nature · doi:10.1038/nature05414 · Cited by 12,444
Human gut microbes associated with obesity
Ley, R. E., Turnbaugh, P. J., Klein, S., & Gordon, J. I. (2006) · Nature · doi:10.1038/4441022a · Cited by 8,785
Bolstad, B. M., Irizarry, R. A., Åstrand, M., & Speed, T. P. (2003) · Bioinformatics · doi:10.1093/bioinformatics/19.2.185 · Cited by 8,328
Diversity of the Human Intestinal Microbial Flora
Eckburg, P. B., Bik, E. M., Bernstein, C. N., Purdom, E., Dethlefsen, L., Sargent, M., Gill, S. R., Nelson, K. E., & Relman, D. A. (2005) · Science · doi:10.1126/science.1110591 · Cited by 7,913
Human gut microbiome viewed across age and geography
Yatsunenko, T., Rey, F. E., Manary, M. J., Trehan, I., Dominguez-Bello, M. G., Contreras, M., Magris, M., Hidalgo, G., Baldassano, R. N., Anokhin, A. P., et al. (2012) · Nature · doi:10.1038/nature11053 · Cited by 7,815
Diversity and Evenness: A Unifying Notation and Its Consequences
Hill, M. (1973) · Ecology · doi:10.2307/1934352 · Cited by 6,486
Host-Bacterial Mutualism in the Human Intestine
Bäckhed, F., Ley, R. E., Sonnenburg, J. L., Peterson, D. A., & Gordon, J. I. (2005) · Science · doi:10.1126/science.1104816 · Cited by 5,277
Research works printed but not linked: 1
- Legendre PL, Legendre L (1998) Numerical ecology: Elsevier.
Cited by
Sorted by citations
Role of the normal gut microbiota
Jandhyala, S. M. (2015) · World Journal of Gastroenterology · doi:10.3748/wjg.v21.i29.8787 · Cited by 3,001
Gut Bacteroides species in health and disease
Zafar, H., & Saier, M. H. (2021) · Gut Microbes · doi:10.1080/19490976.2020.1848158 · Cited by 1,303
The first 1000 cultured species of the human gastrointestinal microbiota
Rajilić-Stojanović, M., & de Vos, W. M. (2014) · FEMS Microbiology Reviews · doi:10.1111/1574-6976.12075 · Cited by 1,182
Microbiota and neurodevelopmental windows: implications for brain disorders
Borre, Y. E., O’Keeffe, G. W., Clarke, G., Stanton, C., Dinan, T. G., & Cryan, J. F. (2014) · Trends in Molecular Medicine · doi:10.1016/j.molmed.2014.05.002 · Cited by 1,089
Effect of Diet on the Gut Microbiota: Rethinking Intervention Duration
Leeming, E. R., Johnson, A. J., Spector, T. D., & Le Roy, C. I. (2019) · Nutrients · doi:10.3390/nu11122862 · Cited by 817
Our gut microbiome: The evolving inner self
Kundu, P., Blacher, E., Elinav, E., & Pettersson, S. (2017) · Cell · doi:10.1016/j.cell.2017.11.024 · Cited by 633
The Gut Microbiota in the First Decade of Life
Derrien, M., Alvarez, A., & de Vos, W. M. (2019) · Trends in Microbiology · doi:10.1016/j.tim.2019.08.001 · Cited by 682
Hollister, E. B., Gao, C., & Versalovic, J. A. (2014) · Gastroenterology · doi:10.1053/j.gastro.2014.01.052 · Cited by 561
Zimmermann, P., & Curtis, N. C. (2020) · Archives of Disease in Childhood · doi:10.1136/archdischild-2020-320338 · Cited by 513
Application of multivariate statistical techniques in microbial ecology
Paliy, O., & Shankar, V. (2016) · Molecular Ecology · doi:10.1111/mec.13536 · Cited by 490
Riva, A., Borgo, F., Lassandro, C., Verduci, E., Morace, G., Borghi, E., & Berry, D. (2016) · Environmental Microbiology · doi:10.1111/1462-2920.13463 · Cited by 456
Activation of HIF-1α and LL-37 by commensal bacteria inhibits Candida albicans colonization
Fan, D., Coughlin, L. A., Neubauer, M. M., Kim, J., Kim, M. S., Zhan, X., Simms-Waldrip, T. R., Xie, Y., Hooper, L. V., & Koh, A. Y. (2015) · Nature Medicine · doi:10.1038/nm.3871 · Cited by 426
Structure and function of the healthy pre-adolescent pediatric gut microbiome
Hollister, E. B., Riehle, K., Luna, R. A., Weidler, E. M., Rubio-Gonzales, M., Mistretta, T.-A., Raza, S., Doddapaneni, H. V., Metcalf, G. A., Muzny, D. M., et al. (2015) · Microbiome · doi:10.1186/s40168-015-0101-x · Cited by 406
Gut Microbiota Elicits a Protective Immune Response against Malaria Transmission
Yılmaz, B., Portugal, S., Tran, T. M., Gozzelino, R., Ramos, S., Gomes, J., Regalado, A. P., Cowan, P. J., d’Apice, A. J. F., Chong, A. S., et al. (2014) · Cell · doi:10.1016/j.cell.2014.10.053 · Cited by 359
Krumbeck, J. A., Rasmussen, H. E., Hutkins, R. W., Clarke, J., Shawron, K., Keshavarzian, A., & Walter, J. (2018) · Microbiome · doi:10.1186/s40168-018-0494-4 · Cited by 342
De Filippo, C., Di Paola, M., Ramazzotti, M., Albanese, D., Pieraccini, G., Banci, E., Miglietta, F., Cavalieri, D., & Lionetti, P. (2017) · Frontiers in Microbiology · doi:10.3389/fmicb.2017.01979 · Cited by 270
The role of gut microbiota in the development of type 1, type 2 diabetes mellitus and obesity
Tai, N., Wong, F. S., & Li, W. (2015) · Reviews in Endocrine and Metabolic Disorders · doi:10.1007/s11154-015-9309-0 · Cited by 260
Zhong, H., Penders, J., Shi, Z., Ren, H., Cai, K., Fang, C., Ding, Q., Thijs, C. T., Blaak, E. E., Stehouwer, C. D. A., et al. (2019) · Microbiome · doi:10.1186/s40168-018-0608-z · Cited by 235
Xia, Y. (2020) · Progress in molecular biology and translational science · doi:10.1016/bs.pmbts.2020.04.003 · Cited by 239
Early life colonization of the human gut: microbes matter everywhere
Korpela, K., & de Vos, W. M. (2018) · Current Opinion in Microbiology · doi:10.1016/j.mib.2018.06.003 · Cited by 211
Development of the Pediatric Gut Microbiome: Impact on Health and Disease
Ihekweazu, F. D., & Versalovic, J. A. (2018) · The American Journal of the Medical Sciences · doi:10.1016/j.amjms.2018.08.005 · Cited by 205
Maternal exposures and the infant gut microbiome: a systematic review with meta-analysis
Grech, A. M., Collins, C. E., Holmes, A. J., Lal, R., Duncanson, K., Taylor, R., & Gordon, A. (2021) · Gut Microbes · doi:10.1080/19490976.2021.1897210 · Cited by 198
Polyphenols in Health and Disease: Gut Microbiota, Bioaccessibility, and Bioavailability
Bié, J., Sepodes, B. M. N., Fernandes, P. C. D. B., & Ribeiro, M. H. L. (2023) · Compounds · doi:10.3390/compounds3010005 · Cited by 208
Bojović, K., Ignjatović, Đ., Bajić, S. S., Milutinović, D. V., Tomić, M., Golić, N., & Tolinački, M. (2020) · Frontiers in Cellular and Infection Microbiology · doi:10.3389/fcimb.2020.00223 · Cited by 172
Malnutrition and Gut Microbiota in Children
Iddrisu, I., Monteagudo-Mera, A., Poveda, C. G., Pyle, S., Shahzad, M. A., Andrews, S. C., & Walton, G. (2021) · Nutrients · doi:10.3390/nu13082727 · Cited by 186
Cheng, J., Ringel‐Kulka, T., Jong, I. H., Ringel, Y., Carroll, I. M., de Vos, W. M., Salojärvi, J., & Satokari, R. M. (2015) · The ISME Journal · doi:10.1038/ismej.2015.177 · Cited by 167
Self-citationDysbiosis in gastrointestinal disorders
Chang, C., & Lin, H. C. (2016) · Best Practice & Research Clinical Gastroenterology · doi:10.1016/j.bpg.2016.02.001 · Cited by 163
Early‐Life Gut Microbiome—The Importance of Maternal and Infant Factors in Its Establishment
Kapourchali, F. R., & Cresci, G. (2020) · Nutrition in Clinical Practice · doi:10.1002/ncp.10490 · Cited by 137
Zhai, Q., Cen, S., Jiang, J., Zhao, J., Zhang, H., & Chen, W. (2019) · Environmental Research · doi:10.1016/j.envres.2019.01.060 · Cited by 135
Early life events influence whole-of-life metabolic health via gut microflora and gut permeability
Kerr, C. A., Grice, D. M., Tran, C. D., Bauer, D. C., Li, D., Hendry, P. L., & Hannan, G. N. (2014) · Critical Reviews in Microbiology · doi:10.3109/1040841x.2013.837863 · Cited by 129
Luk, B., Engevik, M. A., Ganesh, B. P., Lackey, E. P., Lin, T., Balderas, M. A., Major, A. M., Runge, J. K., Luna, R. A., Sillitoe, R. V., et al. (2020) · Scientific Reports · doi:10.1038/s41598-020-64173-3 · Cited by 128
Davis, E. C., Dinsmoor, A. M., Wang, M., & Donovan, S. M. (2020) · Digestive Diseases and Sciences · doi:10.1007/s10620-020-06092-x · Cited by 128
Evolution of the Gut Microbiome in Early Childhood: A Cross-Sectional Study of Chinese Children
Niu, J., Xu, L., Qian, Y., Sun, Z., Yu, D., Huang, J., Zhou, X., Wang, Y., Zhang, T., Ren, R., et al. (2020) · Frontiers in Microbiology · doi:10.3389/fmicb.2020.00439 · Cited by 114
Paediatric specific dosage forms: Patient and formulation considerations
Khan, D., Kirby, D. J., Bryson, S., Shah, M., & Mohammed, A. R. (2022) · International Journal of Pharmaceutics · doi:10.1016/j.ijpharm.2022.121501 · Cited by 120
Tokuhara, D. (2021) · Frontiers in Nutrition · doi:10.3389/fnut.2021.700058 · Cited by 106
Gut microbiota develop towards an adult profile in a sex-specific manner during puberty
Korpela, K., Kallio, S., Salonen, A., Hero, M. T., Kukkonen, A. K., Miettinen, P. J., Savilahti, E., Kohva, E., Kariola, L., Suutela, M., et al. (2021) · Scientific Reports · doi:10.1038/s41598-021-02375-z · Cited by 101
Age-mediated changes in the gastrointestinal tract
Merchant, H. A., Liu, F., Orlu, M., & Basit, A. W. (2016) · International Journal of Pharmaceutics · doi:10.1016/j.ijpharm.2016.04.024 · Cited by 99
Implications of gastrointestinal manifestations of COVID-19
Yang, L., & Tu, L. (2020) · The Lancet. Gastroenterology & hepatology · doi:10.1016/s2468-1253(20)30132-1 · Cited by 93
Gut microbiota: effect of pubertal status
Yuan, X., Chen, R., Zhang, Y., Lin, X., & Yang, X. (2020) · BMC Microbiology · doi:10.1186/s12866-020-02021-0 · Cited by 95
Use of probiotics and prebiotics in infant feeding
Bertelsen, R. J., Jensen, E. T., & Ringel‐Kulka, T. (2016) · Best Practice & Research Clinical Gastroenterology · doi:10.1016/j.bpg.2016.01.001 · Cited by 93
Self-citationMika, A., Day, H. E. W., Martinez, A. S., Rumian, N. L., Greenwood, B. N., Chichlowski, M., Berg, B. M., & Fleshner, M. (2016) · European Journal of Neuroscience · doi:10.1111/ejn.13444 · Cited by 91
Gut Microbiota in Obesity and Metabolic Abnormalities: A Matter of Composition or Functionality?
Morán‐Ramos, S., López-Contreras, B. E., & Canizales‐Quinteros, S. (2017) · Archives of Medical Research · doi:10.1016/j.arcmed.2017.11.003 · Cited by 91
Zou, Y., Lin, X., Xue, W., Tuo, L., Chen, M.-S., Chen, X.-H., Sun, C., Li, F.-N., Liu, S., Dai, Y., et al. (2021) · Scientific Reports · doi:10.1038/s41598-021-90786-3 · Cited by 86
The Fecal Microbiome in Pediatric Patients With Short Bowel Syndrome
Davidovics, Z. H., Carter, B. A., Luna, R. A., Hollister, E. B., Shulman, R. J., & Versalovic, J. A. (2015) · Journal of Parenteral and Enteral Nutrition · doi:10.1177/0148607115591216 · Cited by 81
Escherichia coli Shiga Toxins and Gut Microbiota Interactions
Lee, K., Jeong, Y., & Lee, M. (2021) · Toxins · doi:10.3390/toxins13060416 · Cited by 82
Liu, M., Yang, Z.-Y., Dai, W., Huang, J., Li, Y., Zhang, J., Qiu, C., Chun, W., Zhou, Q., Sun, X., et al. (2017) · World Journal of Gastroenterology · doi:10.3748/wjg.v23.i12.2149 · Cited by 74
Precocious puberty and microbiota: The role of the sex hormone–gut microbiome axis
Calcaterra, V., Rossi, V., Massini, G., Regalbuto, C., Hruby, C., Panelli, S., Bandi, C., & Zuccotti, G. (2022) · Frontiers in Endocrinology · doi:10.3389/fendo.2022.1000919 · Cited by 83
Dysbiotic gut microbiome: A key element of Crohn's disease
Øyri, S. F., Műzes, G., & Sípos, F. (2015) · Comparative Immunology Microbiology and Infectious Diseases · doi:10.1016/j.cimid.2015.10.005 · Cited by 78
Effects of Perinatal Antibiotic Exposure and Neonatal Gut Microbiota
Morreale, C., Giaroni, C., Baj, A., Folgori, L., Barcellini, L., Dhami, A., Agosti, M. A., & Bresesti, I. (2023) · Antibiotics · doi:10.3390/antibiotics12020258 · Cited by 82
Kurakawa, T., Ogata, K., Matsuda, K., Tsuji, H., Kubota, H., Takada, T., Kado, Y., Asahara, T., Takahashi, T., & Nomoto, K. (2015) · PLoS ONE · doi:10.1371/journal.pone.0126226 · Cited by 74
The Gut Microbiota and Oxidative Stress in Autism Spectrum Disorders (ASD)
Hu, T., Dong, Y., He, C., Zhao, M., & He, Q. (2020) · Oxidative Medicine and Cellular Longevity · doi:10.1155/2020/8396708 · Cited by 72
Grayson, M. H., Camarda, L. E., Hussain, S.-R. A., Zemple, S. J., Hayward, M., Lam, V., Hunter, D., Santoro, J. L., Rohlfing, M. M., Cheung, D. S., et al. (2018) · Frontiers in Immunology · doi:10.3389/fimmu.2018.01587 · Cited by 71
The human microbiome and metabolomics: Current concepts and applications
Daliri, E. B., Wei, S., Oh, D., & Lee, B. H. (2016) · Critical Reviews in Food Science and Nutrition · doi:10.1080/10408398.2016.1220913 · Cited by 66
Sánchez-Calvo, J. M., Rodríguez‐Iglesias, M., Molinillo, J. M. G., & Macías, F. A. (2013) · Phytochemistry Reviews · doi:10.1007/s11101-013-9329-x · Cited by 63
Polyphenols and their anti-obesity role mediated by the gut microbiota: a comprehensive review
Duarte-Silva, L., Gasaly, N., Poblete-Aro, C., Uribe, D., Echeverría, F., Gotteland, M., & García‐Díaz, D. F. (2021) · Reviews in Endocrine and Metabolic Disorders · doi:10.1007/s11154-020-09622-0 · Cited by 67
Tavoukjian, V. (2019) · Journal of Hospital Infection · doi:10.1016/j.jhin.2019.03.010 · Cited by 65
West, K., Yin, X., Rutherford, E. M., Wee, B., Choi, J., Chrisman, B., Dunlap, K., Hannibal, R. L., Hartono, W., Lin, M., et al. (2022) · Scientific Reports · doi:10.1038/s41598-022-21327-9 · Cited by 67
Intestinal microbiota during early life – impact on health and disease
Nylund, L., Satokari, R. M., Salminen, S., & de Vos, W. M. (2014) · Proceedings of The Nutrition Society · doi:10.1017/s0029665114000627 · Cited by 60
Self-citationLong Term Development of Gut Microbiota Composition in Atopic Children: Impact of Probiotics
Rutten, N. B. M. M., Gorissen, D. M. W., Eck, A., Niers, L. E. M., Vlieger, A. M., der Vaart, I. B.-V., Budding, A. E., Savelkoul, P. H. M., van der Ent, C. K., & Rijkers, G. T. (2015) · PLoS ONE · doi:10.1371/journal.pone.0137681 · Cited by 58
What’s bugging your teen?—The microbiota and adolescent mental health
McVey Neufeld, K.-A., Luczynski, P., Seira Oriach, C., Dinan, T. G., & Cryan, J. F. (2016) · Neuroscience & Biobehavioral Reviews · doi:10.1016/j.neubiorev.2016.06.005 · Cited by 56
Characterizing the Composition of the Pediatric Gut Microbiome: A Systematic Review
Deering, K., Devine, A., O’Sullivan, T. A., Lo, J., Boyce, M. C., & Christophersen, C. T. (2019) · Nutrients · doi:10.3390/nu12010016 · Cited by 59
Sleep and the gut microbiota in preschool-aged children
Wang, Y., van de Wouw, M., Drogos, L. L., Vaghef‐Mehrabany, E., Reimer, R. A., Tomfohr‐Madsen, L. M., & Giesbrecht, G. F. (2022) · SLEEP · doi:10.1093/sleep/zsac020 · Cited by 59
Fetal exposures and perinatal influences on the stool microbiota of premature infants
Chernikova, D. A., Koestler, D. C., Hoen, A. G., Housman, M. L., Hibberd, P. L., Moore, J. H., Morrison, H. G., Sogin, M. L., Zain-Ul-Abideen, M., & Madan, J. C. (2014) · The Journal of Maternal-Fetal & Neonatal Medicine · doi:10.3109/14767058.2014.987748 · Cited by 57
Early‐life exercise may promote lasting brain and metabolic health through gut bacterial metabolites
Mika, A., & Fleshner, M. (2015) · Immunology and Cell Biology · doi:10.1038/icb.2015.113 · Cited by 58
Reframing the Teenage Wasteland: Adolescent Microbiota-Gut-Brain Axis
Neufeld, K. M., Luczynski, P., Dinan, T. G., & Cryan, J. F. (2016) · The Canadian Journal of Psychiatry · doi:10.1177/0706743716635536 · Cited by 60
Ou, Y., Belzer, C., Smidt, H., & de Weerth, C. (2022) · Gut Microbes · doi:10.1080/19490976.2022.2038853 · Cited by 54
Gut microbiota in children and altered profiles in juvenile idiopathic arthritis
Filippo, C. D., Paola, M. D., Giani, T., Tirelli, F., & Cimaz, R. (2019) · Journal of Autoimmunity · doi:10.1016/j.jaut.2019.01.001 · Cited by 58
Intestinal microbiota composition after antibiotic treatment in early life: the INCA study
Rutten, N. B. M. M., Rijkers, G. T., Meijssen, C. B., Crijns, C. E., Oudshoorn, J. H., van der Ent, C. K., & Vlieger, A. M. (2015) · BMC Pediatrics · doi:10.1186/s12887-015-0519-0 · Cited by 51
Dietary Habits of 2- to 9-Year-Old American Children Are Associated with Gut Microbiome Composition
Herman, D. R., Rhoades, N., Mercado, J., Argueta, P., Lopez, U., & Flores, G. E. (2020) · Journal of the Academy of Nutrition and Dietetics · doi:10.1016/j.jand.2019.07.024 · Cited by 50
Wang, R., Cai, Y., Lu, W., Zhang, R., Shao, R., Yau, S., Stubbs, B., McIntyre, R. S., Su, K., Xu, G., et al. (2022) · Psychiatry Research · doi:10.1016/j.psychres.2022.115005 · Cited by 51
Ling, Z., Cheng, Y., Chen, F., Yan, X., Liu, X., Shao, L., Jin, G., Zhou, D., Jiang, G., Li, H., et al. (2022) · Frontiers in Immunology · doi:10.3389/fimmu.2022.964910 · Cited by 52
Sex, puberty, and the gut microbiome
Sisk-Hackworth, L., Kelley, S. T., & Thackray, V. G. (2022) · Reproduction · doi:10.1530/rep-22-0303 · Cited by 52
Preterm gut microbiota and metabolome following discharge from intensive care
Stewart, C. J., Skeath, T., Nelson, A., Fernstad, S. J., Marrs, E. C. L., Perry, J. D., Cummings, S. P., Berrington, J. E., & Embleton, N. D. (2015) · Scientific Reports · doi:10.1038/srep17141 · Cited by 48
Gut–Lung Axis: Microbial Crosstalk in Pediatric Respiratory Tract Infections
Zhu, W., Wu, Y., Liu, H., Jiang, C., & Huo, L. (2021) · Frontiers in Immunology · doi:10.3389/fimmu.2021.741233 · Cited by 49
Swartwout, B. K., & Luo, X. (2018) · Frontiers in Immunology · doi:10.3389/fimmu.2018.02840 · Cited by 48
Wang, G., Hu, Y., He, M.-Y., Xie, Y., Su, W. Y., Long, D., Zhao, R., Wang, J., Dai, C., Li, H., et al. (2021) · American Journal Of Pathology · doi:10.1016/j.ajpath.2021.02.019 · Cited by 44
Intraspecies Genomic Diversity and Long-Term Persistence of Bifidobacterium longum
Chaplin, A. V., Efimov, B. A., Smeianov, V. V., Kafarskaia, L. I., Pikina, A. P., & Shkoporov, A. N. (2015) · PLoS ONE · doi:10.1371/journal.pone.0135658 · Cited by 43
Princisval, L., Rebelo, F. M., Williams, B. L., Coimbra, A. C., Crovesy, L., Ferreira, A. L. L., & Kac, G. (2021) · Nutrition Reviews · doi:10.1093/nutrit/nuab008 · Cited by 47
Andrés, J. D., Manzano, S., García, C. I. M., Rodríguez, J. M., Espinosa‐Martos, I., & Jiménez, E. (2018) · Beneficial Microbes · doi:10.3920/bm2017.0132 · Cited by 40
Roles of Gut Microbiome in Bone Homeostasis and Its Relationship with Bone-Related Diseases
Zemanová, N., Omelka, R., Mondočková, V., Kováčová, V., & Martiniaková, M. (2022) · Biology · doi:10.3390/biology11101402 · Cited by 41
Matsuyama, M., Harb, T., David, M., Davies, P. S. W., & Hill, R. J. (2016) · Public Health Nutrition · doi:10.1017/s1368980016003189 · Cited by 40
Enteral Nutrition in Pediatric Short‐Bowel Syndrome
Channabasappa, N., Girouard, S., Nguyen, V., & Piper, H. G. (2020) · Nutrition in Clinical Practice · doi:10.1002/ncp.10565 · Cited by 39
Satokari, R. M. (2014) · Scandinavian Journal of Gastroenterology · doi:10.3109/00365521.2014.966320 · Cited by 39
Self-citationKosuwon, P., Lao‐Araya, M., Uthaisangsook, S., Lay, C., BINDELS, J. G., Knol, J., & Chatchatee, P. (2018) · Beneficial Microbes · doi:10.3920/bm2017.0110 · Cited by 38
Paediatric Inflammatory Bowel Disease and its Relationship with the Microbiome
Fitzgerald, R. S., Sanderson, I. R., & Claesson, M. J. (2021) · Microbial Ecology · doi:10.1007/s00248-021-01697-9 · Cited by 39
Embracing Complexity beyond Systems Medicine: A New Approach to Chronic Immune Disorders
Velde, A. A. T., Bezema, T., van Kampen, A. H. C., Kraneveld, A. D., Hart, B. A. ‘., van Middendorp, H., Hack, E., van Montfrans, J. M., Belzer, C., Jans-Beken, L., et al. (2016) · Frontiers in Immunology · doi:10.3389/fimmu.2016.00587 · Cited by 37
Zearalenone Changes the Diversity and Composition of Caecum Microbiota in Weaned Rabbit
Li, P., Yang, S., Zhang, X., Huang, S., Wang, N., Wang, M., Long, M., & He, J. (2018) · BioMed Research International · doi:10.1155/2018/3623274 · Cited by 38
Watanabe, H., Nagano, N., Tsuji, Y., Noto, N., Ayusawa, M., & Morioka, I. (2023) · European Journal of Clinical Pharmacology · doi:10.1007/s00228-023-03598-x · Cited by 44
The Development of Early Life Microbiota in Human Health and Disease
Lv, H., Zhang, L., Han, Y., Wu, L. M., & Wang, B. (2021) · Engineering · doi:10.1016/j.eng.2020.12.014 · Cited by 40
Healey, G. R., Celiberto, L. S., Lee, S. M., & Jacobson, K. (2020) · Nutrients · doi:10.3390/nu12103204 · Cited by 38
Gut Microbiota and Human Body Interactions; Its Impact on Health: A Review
Hajiagha, M. N., Taghizadeh, S., Asgharzadeh, M., Dao, S., Ganbarov, K., Köse, Ş., & Kafil, H. S. (2021) · Current Pharmaceutical Biotechnology · doi:10.2174/1389201022666210104115836 · Cited by 36
Olteanu, G., Pană, M.-A., Busnatu, Ș., Lupuliasa, D., Neacșu, S. M., Mititelu, M., Musuc, A. M., Ioniță-Mîndrican, C.-B., & Boroghină, S. C. (2024) · International Journal of Molecular Sciences · doi:10.3390/ijms25105561 · Cited by 36
Jimenez, J., Drees, M. L., Loveridge‐Lenza, B., Eppes, S. C., & del Rosario, J. F. (2015) · Journal of Pediatric Gastroenterology and Nutrition · doi:10.1097/mpg.0000000000000790 · Cited by 34
Zhernakova, A., Yassour, M., Hall, L. J., & Collado, M. C. (2025) · Cell Host & Microbe · doi:10.1016/j.chom.2025.05.014 · Cited by 40
Biomarkers of deoxynivalenol (DON) and its modified form DON-3-glucoside (DON-3G) in humans
Deng, Y., You, L., Nepovimová, E., Wang, X., Musílek, K., Wu, Q., Wu, W., & Kuča, K. (2021) · Trends in Food Science & Technology · doi:10.1016/j.tifs.2021.02.038 · Cited by 31
Eindor‐Abarbanel, A., Healey, G. R., & Jacobson, K. (2021) · International Journal of Molecular Sciences · doi:10.3390/ijms222212506 · Cited by 35
Microbial Therapeutics Designed for Infant Health
Watkins, C., Stanton, C., Ryan, C. A., & Ross, R. P. (2017) · Frontiers in Nutrition · doi:10.3389/fnut.2017.00048 · Cited by 30
Intestinal microbiota in short bowel syndrome
Piper, H. G. (2018) · Seminars in Pediatric Surgery · doi:10.1053/j.sempedsurg.2018.07.007 · Cited by 29
Kim, J. H., Doo, E., Jeong, M., Kim, S., Lee, Y.-Y., Yang, J., Lee, J. S., Kim, J. H., Lee, K. W., Huh, C., et al. (2019) · Nutrients · doi:10.3390/nu11071481 · Cited by 29
Żebrowska-Różańska, P., Łaczmańska, I., & Łaczmański, Ł. (2021) · Frontiers in Cellular and Infection Microbiology · doi:10.3389/fcimb.2021.630052 · Cited by 32
Metadata
- Authors
- Ringel-Kulka, T., Cheng, J., Ringel, Y., Salojärvi, J., Carroll, I., Palva, A., de Vos, W. M., & Satokari, R.
- Affiliations
- University of Helsinki (FI)
- University of North Carolina at Chapel Hill (US)
- Venue
- PLoS ONE
- Publisher
- Public Library of Science (PLoS)
- Published
- 2013-05-23
- Volume
- 8
- Issue
- 5
- Pages
- e64315
- ISSN
- 1932-6203 (ISSN-L)
- PMC
- PMC3662718
- OpenAlex
- W1987296519
- Cited by
- 230
- References
- 62
- Citations by year
- 2026: 4 · 2025: 15 · 2024: 13 · 2023: 18 · 2022: 23 · 2021: 25 · 2020: 50 · 2019: 15 · 2018: 14 · 2017: 8 · 2016: 13 · 2015: 18 · 2014: 12 · 2013: 2
- FWCI
- 6.71
- Type
- journal article
- Language
- en
- Open access
- gold
- doi.org
- Locations
- PLoS ONE (publishedVersion, cc-by)
- Europe PMC (PubMed Central) (publishedVersion, other-oa)
- PubMed Central (publishedVersion, cc-by)
- PubMed (publishedVersion)
- Socio-Environmental Systems Modeling (acceptedVersion)
- RePEc: Research Papers in Economics (submittedVersion)
- DOAJ (DOAJ: Directory of Open Access Journals) (submittedVersion, cc-by-sa)
- Figshare (submittedVersion, cc-by)
- Työväentutkimus Vuosikirja (submittedVersion)
- Data Archiving and Networked Services (DANS) (submittedVersion, other-oa)
- Funders
- Academy of Finland
- National Institutes of Health
- National Institute of Diabetes and Digestive and Kidney Diseases (DK075621, K23DK075621)
- Topics
- Life Sciences › Biochemistry, Genetics and Molecular Biology › Molecular Biology › Gut microbiota and health
- Health Sciences › Nursing › Nutrition and Dietetics › Infant Nutrition and Health
- Health Sciences › Dentistry › Periodontics › Oral microbiology and periodontitis research
- Keywords
- gut microbiota, gut microbiota development, children versus adults, Bifidobacterium, Clostridium cluster XIVa, Clostridium cluster IV, Bacteroidetes, actinobacteria, bacilli, microbial diversity, 16S rRNA, healthy adults
- MeSH terms
- Adult, Bifidobacterium, Child, Preschool, Clostridium, Feces, Female, Genes, Bacterial, Health, Humans, Infant, Intestines, Male, Middle Aged, Phylogeny, RNA, Ribosomal, 16S, Oligonucleotide Array Sequence Analysis, Principal Component Analysis, Actinobacteria, Bacteroidetes, Young Adult, Molecular Typing, Microbiota
About these checks
Registry, retraction, Cites and statistics results are computed, not judged, with one exception: a printed reference that no index lists is read once by a model before it counts as a citation error. Claims are extracted by a model and kept only when their quote appears verbatim in the text; each cited source is then checked, with a model’s help, for whether it says what the claim relies on. Those verdicts can be wrong — read the claim’s quote and the cited source before relying on one.
Statistics and arithmetic are recomputed, not judged.
Confidence bands are shown only for fields calibrated on our annotated test set. None is calibrated yet, so no band is shown.
What counts as a claim ›How we measure confidence ›How we check this ›
Are you an author, or do you see a problem with this page? Request a review
