

The DOI matches its Crossref record; 64 of the 64 references it cites were found in a registry or an index.
Passing Messages between Biological Networks to Refine Predicted Interactions
Open accessAbstract
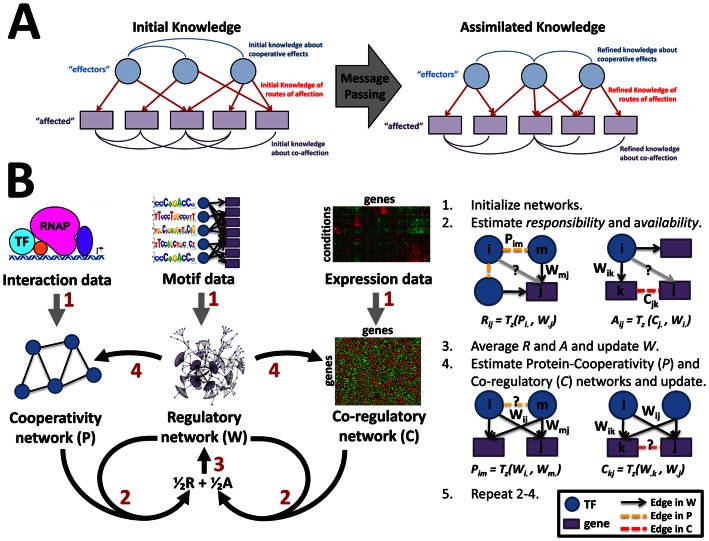
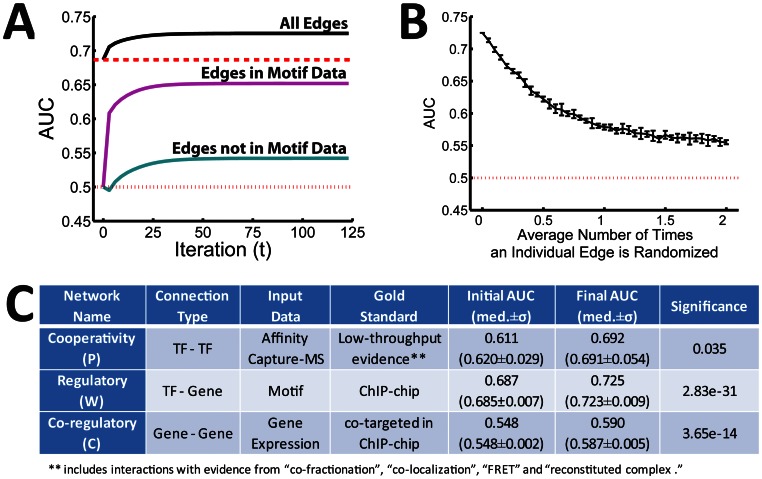
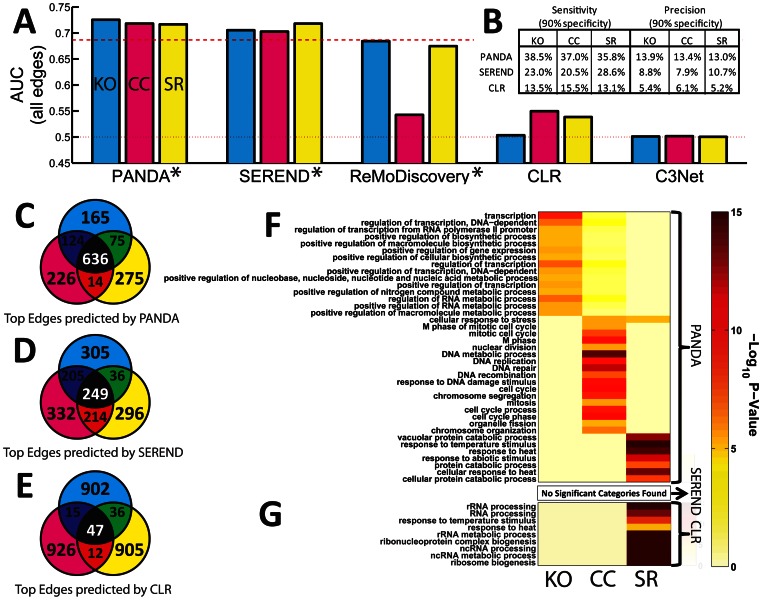
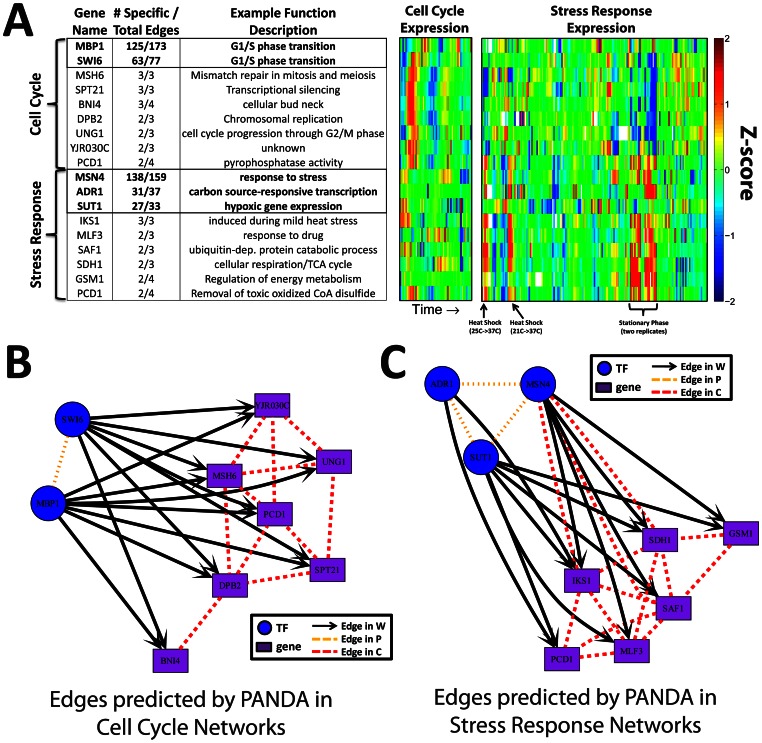
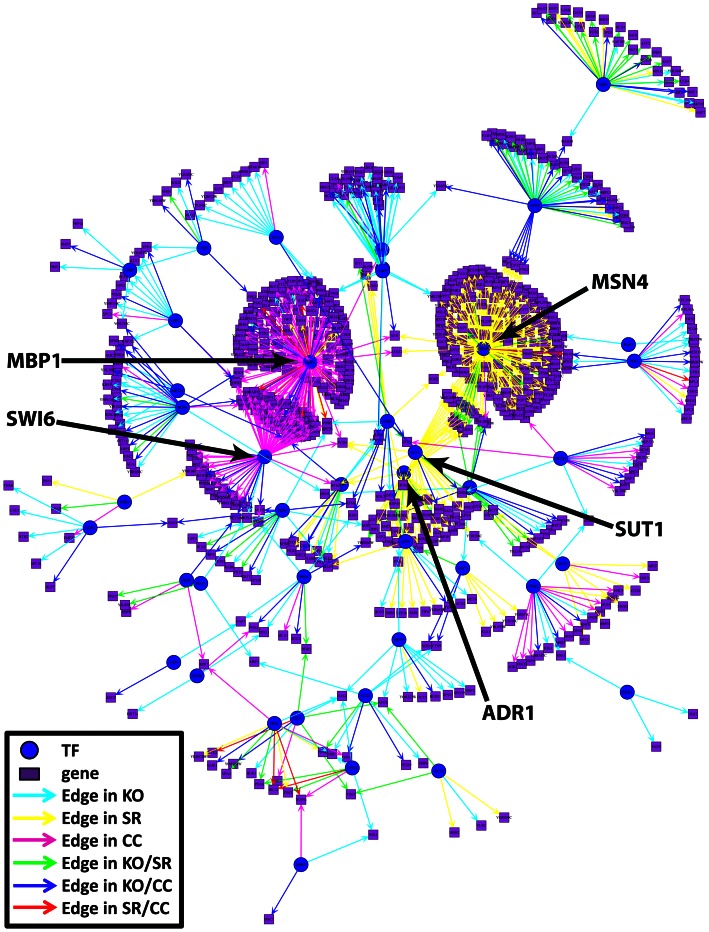
Regulatory network reconstruction is a fundamental problem in computational biology. There are significant limitations to such reconstruction using individual datasets, and increasingly people attempt to construct networks using multiple, independent datasets obtained from complementary sources, but methods for this integration are lacking. We developed PANDA (Passing Attributes between Networks for Data Assimilation), a message-passing model using multiple sources of information to predict regulatory relationships, and used it to integrate protein-protein interaction, gene expression, and sequence motif data to reconstruct genome-wide, condition-specific regulatory networks in yeast as a model. The resulting networks were not only more accurate than those produced using individual data sets and other existing methods, but they also captured information regarding specific biological mechanisms and pathways that were missed using other methodologies. PANDA is scalable to higher eukaryotes, applicable to specific tissue or cell type data and conceptually generalizable to include a variety of regulatory, interaction, expression, and other genome-scale data. An implementation of the PANDA algorithm is available at www.sourceforge.net/projects/panda-net.
Overview
The claims and statistics of this paper haven’t been checked yet.
Run the check — free, no account needed. It reads the open-access text and checks the sources it cites.
Integrity signals
Registry
Cites
Statistics
Figures
Verification
Claims the paper makes
The claims and statistics of this paper haven’t been checked yet.
Run the check — free, no account needed. It reads the open-access text and checks the sources it cites.
Claims other papers make about this one
Each is checked against this paper’s own text: does it say what the citing paper says it does?
The cited source says what the claim attributes to it.
In the citing paper
“However, a focus on TFs is rarely sufficient, and integration of multiple data types is often required to increase the accuracy and usefulness of the resulting networks [13, 147].”
From Gene co-expression analysis for functional classification and gene–disease predictions (2017) · cites this paper as [13]
The cited source says what the claim attributes to it.
In the citing paper
“Overall, integration of multiple data types increases the accuracy of the resulting predictions [13, 147].”
From Gene co-expression analysis for functional classification and gene–disease predictions (2017) · cites this paper as [13]
Self-check
Percentages, sums and reported differences re-computed from the paper’s own numbers.
The self-check needs the paper’s full text.
Citations
Cites
Systematic and integrative analysis of large gene lists using DAVID bioinformatics resources
Huang, D. W., Sherman, B. T., & Lempicki, R. A. (2009) · Nature Protocols · doi:10.1038/nprot.2008.211 · Cited by 35,890
Clustering by Passing Messages Between Data Points
Frey, B. J., & Dueck, D. (2007) · Science · doi:10.1126/science.1136800 · Cited by 6,855
Genomic Expression Programs in the Response of Yeast Cells to Environmental Changes
Gasch, A. P., Spellman, P. T., Kao, C. M., Carmel-Harel, O., Eisen, M. B., Storz, G., Botstein, D., & Brown, P. O. (2000) · Molecular Biology of the Cell · doi:10.1091/mbc.11.12.4241 · Cited by 4,815
BioGRID: a general repository for interaction datasets
Stark, C. (2006) · Nucleic Acids Research · doi:10.1093/nar/gkj109 · Cited by 3,960
Margolin, A. A., Nemenman, I., Basso, K., Wiggins, C., Stolovitzky, G., Favera, R. D., & Califano, A. (2006) · BMC Bioinformatics · doi:10.1186/1471-2105-7-s1-s7 · Cited by 2,420
Margolin, A. A., Nemenman, I. M., Basso, K., Wiggins, C. H., Stolovitzky, G. A., Favera, R. D., & Califano, A. (2006) · BMC Bioinformatics · doi:10.7916/d8g15zbp · Cited by 2,260
Transcriptional regulatory code of a eukaryotic genome
Harbison, C. T., Gordon, D. B., Lee, T. I., Rinaldi, N. J., MacIsaac, K. D., Danford, T., Hannett, N. M., Tagne, J., Reynolds, D. B., Yoo, J. Y., et al. (2004) · Nature · doi:10.1038/nature02800 · Cited by 2,135
Segal, E., Shapira, M., Regev, A., Pe’er, D., Botstein, D., Koller, D., & Friedman, N. (2003) · Nature Genetics · doi:10.1038/ng1165 · Cited by 1,678
Wisdom of crowds for robust gene network inference
The DREAM5 Consortium, Marbach, D., Costello, J. C., Küffner, R., Vega, N. M., Prill, R. J., Camacho, D. M., Allison, K. R., Kellis, M., Collins, J. J., et al. (2012) · Nature Methods · doi:10.1038/nmeth.2016 · Cited by 1,667
Faith, J. J., Hayete, B., Thaden, J. T., Mogno, I., Wierzbowski, J., Cottarel, G., Kasif, S., Collins, J. J., & Gardner, T. S. (2007) · PLoS Biology · doi:10.1371/journal.pbio.0050008 · Cited by 1,563
Architecture of the human regulatory network derived from ENCODE data
Gerstein, M., Kundaje, A. B., Hariharan, M., Landt, S. G., Yan, K., Cheng, C., Mu, X. J., Khurana, E., Rozowsky, J. S., Alexander, R. P., et al. (2012) · Nature · doi:10.1038/nature11245 · Cited by 1,451
Transcription regulation and animal diversity
Levine, M., & Tjian, R. (2003) · Nature · doi:10.1038/nature01763 · Cited by 1,309
The BioGRID interaction database: 2013 update
Chatr‐aryamontri, A., Breitkreutz, B., Heinicke, S., Boucher, L., Winter, A. G., Stark, C., Nixon, J., Ramage, L., Kolas, N. K., O’Donnell, L., et al. (2012) · Nucleic Acids Research · doi:10.1093/nar/gks1158 · Cited by 1,021
Butte, A. J., & Kohane, I. S. (1999) · Pacific Symposium on Biocomputing (PSB) · doi:10.1142/9789814447331_0040 · Cited by 956
Genetic network inference: from co-expression clustering to reverse engineering
D’haeseleer, P., Liang, S., & Somogyi, R. (2000) · Bioinformatics · doi:10.1093/bioinformatics/16.8.707 · Cited by 943
A Computer Program for Classifying Plants
Rogers, D. J., & Tanimoto, T. T. (1960) · Science · doi:10.1126/science.132.3434.1115 · Cited by 874
The BioGRID Interaction Database: 2011 update
Stark, C., Breitkreutz, B., Chatr‐aryamontri, A., Boucher, L., Oughtred, R., Livstone, M. S., Nixon, J., Auken, K. M. V., Wang, X., Shi, X., et al. (2010) · Nucleic Acids Research · doi:10.1093/nar/gkq1116 · Cited by 862
Gene regulatory network inference: Data integration in dynamic models—A review
Hecker, M., Lambeck, S., Toepfer, S., van Someren, E., & Guthke, R. (2009) · Biosystems · doi:10.1016/j.biosystems.2008.12.004 · Cited by 755
Revealing strengths and weaknesses of methods for gene network inference
Marbach, D., Prill, R. J., Schaffter, T., Mattiussi, C., Floreano, D., & Stolovitzky, G. A. (2010) · Proceedings of the National Academy of Sciences · doi:10.1073/pnas.0913357107 · Cited by 755
Computational discovery of gene modules and regulatory networks
Bar‐Joseph, Z., Gerber, G. K., Lee, T. I., Rinaldi, N. J., Yoo, J. Y., Robert, F., Gordon, D. B., Fraenkel, E., Jaakkola, T., Young, R. A., et al. (2003) · Nature Biotechnology · doi:10.1038/nbt890 · Cited by 605
Zhu, J., Zhang, B., Smith, E. N., Drees, B., Brem, R. B., Kruglyak, L., Bumgarner, R. E., & Schadt, E. E. (2008) · Nature Genetics · doi:10.1038/ng.167 · Cited by 553
Discovery of meaningful associations in genomic data using partial correlation coefficients
de la Fuente, A., Bing, N., Hoeschele, I., & Mendes, P. (2004) · Bioinformatics · doi:10.1093/bioinformatics/bth445 · Cited by 552
Advantages and limitations of current network inference methods
Smet, R. D., & Marchal, K. (2010) · Nature Reviews Microbiology · doi:10.1038/nrmicro2419 · Cited by 530
Pique-Regi, R., Degner, J. F., Pai, A. A., Gaffney, D. J., Gilad, Y., & Pritchard, J. K. (2011) · Genome Research · doi:10.1101/gr.112623.110 · Cited by 521
Schmitt, A. P., & McEntee, K. (1996) · Proceedings of the National Academy of Sciences · doi:10.1073/pnas.93.12.5777 · Cited by 472
A Role for the Transcription Factors Mbp1 and Swi4 in Progression from G1 to S Phase
Koch, C., Moll, T., Neuberg, M., Ahorn, H., & Nasmyth, K. (1993) · Science · doi:10.1126/science.8372350 · Cited by 382
Integrating regulatory motif discovery and genome-wide expression analysis
Conlon, E. M., Liu, X. S., Lieb, J. D., & Liu, J. S. (2003) · Proceedings of the National Academy of Sciences · doi:10.1073/pnas.0630591100 · Cited by 343
Chuang, H., Hofree, M., & Ideker, T. (2010) · Annual Review of Cell and Developmental Biology · doi:10.1146/annurev-cellbio-100109-104122 · Cited by 327
Tata, P., Wu, W., Miles, S., Noble, W. S., & Breeden, L. L. (2006) · Genes & Development · doi:10.1101/gad.1450606 · Cited by 282
Cell cycle regulted transcription in yeast
Koch, C., & Nasmyth, K. (1994) · Current Opinion in Cell Biology · doi:10.1016/0955-0674(94)90039-6 · Cited by 273
COMBINING LOCATION AND EXPRESSION DATA FOR PRINCIPLED DISCOVERY OF GENETIC REGULATORY NETWORK MODELS
Hartemink, A. J., Gifford, D. K., Jaakkola, T., & Young, R. A. (2001) · Pacific Symposium on Biocomputing (PSB) · doi:10.1142/9789812799623_0041 · Cited by 267
Zhu, J., Wiener, M. C., Zhang, C., Fridman, A., Minch, E., Lum, P. Y., Sachs, J. R., & Schadt, E. E. (2007) · PLoS Computational Biology · doi:10.1371/journal.pcbi.0030069 · Cited by 211
Identifying transcription factor functions and targets by phenotypic activation
Chua, G., Morris, Q., Sopko, R., Robinson, M. D., Ryan, O. W., Chan, E. T., Frey, B. J., Andrews, B., Boone, C. M., & Hughes, T. R. (2006) · Proceedings of the National Academy of Sciences · doi:10.1073/pnas.0605140103 · Cited by 183
Tata, P., Miles, S., GuhaThakurta, D., Jemiolo, D., & Breeden, L. L. (2002) · Genes & Development · doi:10.1101/gad.1034302 · Cited by 173
Yeang, C., Ideker, T., & Jaakkola, T. (2004) · Journal of Computational Biology · doi:10.1089/1066527041410382 · Cited by 164
Learning by Message Passing in Networks of Discrete Synapses
Braunstein, A., & Zecchina, R. (2006) · Physical Review Letters · doi:10.1103/physrevlett.96.030201 · Cited by 149
de Bruin, R. A. M., Kalashnikova, T. I., Chahwan, C., McDonald, W. H., Wohlschlegel, J. A., Yates, J. R., Russell, P. R., & Wittenberg, C. (2006) · Molecular Cell · doi:10.1016/j.molcel.2006.06.025 · Cited by 147
Reverse engineering gene regulatory networks
Hartemink, A. J. (2005) · Nature Biotechnology · doi:10.1038/nbt0505-554 · Cited by 144
Guthke, R., Moller, U., Hoffmann, M., Thiès, F., & Topfer, S. (2004) · Computer applications in the biosciences · doi:10.1093/bioinformatics/bti226 · Cited by 131
Marbach, D., Roy, S., Ay, F., Meyer, P. E., Candeias, R., Kahveci, T., Bristow, C. A., & Kellis, M. (2012) · Genome Research · doi:10.1101/gr.127191.111 · Cited by 127
Tunçbağ, N., Braunstein, A., Pagnani, A., Huang, S. C., Chayes, J., Borgs, C., Zecchina, R., & Fraenkel, E. (2013) · Journal of Computational Biology · doi:10.1089/cmb.2012.0092 · Cited by 114
Revealing differences in gene network inference algorithms on the network level by ensemble methods
Altay, G., & Emmert‐Streib, F. (2010) · Bioinformatics · doi:10.1093/bioinformatics/btq259 · Cited by 108
A Semi-Supervised Method for Predicting Transcription Factor–Gene Interactions in Escherichia coli
Ernst, J., Beg, Q. K., Kay, K. A., Balázsi, G., Oltvai, Z. N., & Bar‐Joseph, Z. (2008) · PLoS Computational Biology · doi:10.1371/journal.pcbi.1000044 · Cited by 103
BNFinder: exact and efficient method for learning Bayesian networks
Wilczyński, B., & Dojer, N. (2008) · Bioinformatics · doi:10.1093/bioinformatics/btn505 · Cited by 100
Inferring transcriptional modules from ChIP-chip, motif and microarray data
Lemmens, K., Dhollander, T., Bie, T. D., Monsieurs, P., Engelen, K., Smets, B., Winderickx, J., Moor, B. D., & Marchal, K. (2006) · Genome biology · doi:10.1186/gb-2006-7-5-r37 · Cited by 95
Integrated Assessment and Prediction of Transcription Factor Binding
Beyer, A., Workman, C. T., Hollunder, J., Radke, D., Möller, U., Wilhelm, T. E., & Ideker, T. (2005) · PLoS Computational Biology · doi:10.1371/journal.pcbi.0020070 · Cited by 90
Distinct roles for Khd1p in the localization and expression of bud-localized mRNAs in yeast
Hasegawa, Y., Irie, K., & Gerber, A. P. (2008) · RNA · doi:10.1261/rna.1016508 · Cited by 79
Selective integration of multiple biological data for supervised network inference
Kato, T., Tsuda, K., & Asai, K. (2005) · Computer applications in the biosciences · doi:10.1093/bioinformatics/bti339 · Cited by 72
Siegmund, R. F., & Nasmyth, K. (1996) · Molecular and Cellular Biology · doi:10.1128/mcb.16.6.2647 · Cited by 66
Ness, F., Bourot, S., Régnacq, M., Spagnoli, R., Bergès, T., & Karst, F. (2001) · European Journal of Biochemistry · doi:10.1046/j.1432-1327.2001.02029.x · Cited by 66
Bonnet, É., Tatari, M. N., Joshi, A., Michoel, T., Marchal, K., Berx, G., & de Peer, Y. V. (2010) · PLoS ONE · doi:10.1371/journal.pone.0010162 · Cited by 62
Mihalik, Á., & Csermely, P. (2011) · PLoS Computational Biology · doi:10.1371/journal.pcbi.1002187 · Cited by 61
Michoel, T., Smet, R. D., Joshi, A., de Peer, Y. V., & Kathleen Marchal, D. (2009) · BMC Systems Biology · doi:10.1186/1752-0509-3-49 · Cited by 60
Structural influence of gene networks on their inference: analysis of C3NET
Altay, G., & Emmert‐Streib, F. (2011) · Biology Direct · doi:10.1186/1745-6150-6-31 · Cited by 57
Modeling Gene Regulation Networks Using Ordinary Differential Equations
Cao, J., Qi, X., & Zhao, H. (2011) · Methods in molecular biology · doi:10.1007/978-1-61779-400-1_12 · Cited by 53
Bailly‐Bechet, M., Braunstein, A., Pagnani, A., Weigt, M., & Zecchina, R. (2010) · BMC Bioinformatics · doi:10.1186/1471-2105-11-355 · Cited by 40
Chang, L. W., Payton, J. E., Yuan, W., Ley, T. J., Nagarajan, R., & Stormo, G. D. (2008) · Genome biology · doi:10.1186/gb-2008-9-2-r38 · Cited by 27
Vu, T. T., & Vohradský, J. (2009) · Genomics · doi:10.1016/j.ygeno.2009.01.006 · Cited by 17
Tunçbağ, N., Braunstein, A., Pagnani, A., Huang, S. C., Chayes, J., Borgs, C., Zecchina, R., & Fraenkel, E. (2012) · Lecture notes in computer science · doi:10.1007/978-3-642-29627-7_31 · Cited by 15
Bauer, T., Eils, R., & König, R. (2011) · Bioinformatics · doi:10.1093/bioinformatics/btr366 · Cited by 15
Youn, A., Reiss, D. J., & Stuetzle, W. (2010) · Bioinformatics · doi:10.1093/bioinformatics/btq289 · Cited by 15
SARGE: a tool for creation of putative genetic networks
Shaw, O., Harwood, C. R., Steggles, L. J., & Wipat, A. (2004) · Bioinformatics · doi:10.1093/bioinformatics/bth395 · Cited by 15
DISCOVERING TRANSCRIPTIONAL MODULES FROM MOTIF, ChIP-CHIP AND MICROARRAY DATA
Bie, T. D., Monsieurs, P., Engelen, K., Moor, B. D., Cristianini, N., & Marchal, K. (2004) · Pacific Symposium on Biocomputing (PSB) · doi:10.1142/9789812702456_0046 · Cited by 13
Zhu, J. Z., Wiener, M. C., Zhang, C., Fridman, A., Minch, E., Lum, P. Y., Sachs, J. R., & Schadt, E. E. (2005) · PLoS Computational Biology · doi:10.1371/journal.pcbi.0030069.eor · Cited by 12
Cited by
Sorted by citations
Gene co-expression analysis for functional classification and gene–disease predictions
van Dam, S., Võsa, U., van der Graaf, A., Franke, L., & de Magalhães, J. P. (2017) · Briefings in Bioinformatics · doi:10.1093/bib/bbw139 · Cited by 995
DIABLO: an integrative approach for identifying key molecular drivers from multi-omics assays
Singh, A., Shannon, C. P., Gautier, B., Rohart, F., Vacher, M. A., Tebbutt, S. J., & Cao, K. L. (2019) · Bioinformatics · doi:10.1093/bioinformatics/bty1054 · Cited by 1,124
Biomarker development in the precision medicine era: lung cancer as a case study
Vargas, A. J., & Harris, C. C. (2016) · Nature reviews. Cancer · doi:10.1038/nrc.2016.56 · Cited by 562
Sex Differences in Gene Expression and Regulatory Networks across 29 Human Tissues
Lopes‐Ramos, C. M., Chen, C.-Y., Kuijjer, M. L., Paulson, J. N., Sonawane, A. R., Fagny, M., Platig, J., Glass, K., Quackenbush, J. F., & DeMeo, D. L. (2020) · Cell Reports · doi:10.1016/j.celrep.2020.107795 · Cited by 462
Self-citationUnderstanding Tissue-Specific Gene Regulation
Sonawane, A. R., Platig, J., Fagny, M., Chen, C.-Y., Paulson, J. N., Lopes‐Ramos, C. M., DeMeo, D. L., Quackenbush, J. F., Glass, K., & Kuijjer, M. L. (2017) · Cell Reports · doi:10.1016/j.celrep.2017.10.001 · Cited by 425
Self-citation
Metadata
- Authors
- Glass, K., Huttenhower, C., Quackenbush, J., & Yuan, G.-C.
- Affiliations
- Harvard University (US)
- Corresponding author
- Yuan, Guo-Cheng
- Venue
- PLoS ONE
- Publisher
- Public Library of Science (PLoS)
- Published
- 2013-05-31
- Volume
- 8
- Issue
- 5
- Pages
- e64832
- ISSN
- 1932-6203 (ISSN-L)
- PMC
- PMC3669401
- OpenAlex
- W2020672230
- Cited by
- 266
- References
- 64
- Citations by year
- 2026: 24 · 2025: 26 · 2024: 56 · 2023: 22 · 2022: 24 · 2021: 29 · 2020: 24 · 2019: 15 · 2018: 11 · 2017: 12 · 2016: 12 · 2015: 7 · 2014: 4
- FWCI
- 3.44
- Type
- journal article
- Language
- en
- Open access
- gold
- doi.org
- Locations
- PLoS ONE (publishedVersion, cc-by)
- Europe PMC (PubMed Central) (publishedVersion, other-oa)
- PubMed Central (publishedVersion, cc-by)
- PubMed (publishedVersion)
- Digital Access to Scholarship at Harvard (DASH) (Harvard University) (submittedVersion, cc-by)
- DOAJ (DOAJ: Directory of Open Access Journals) (submittedVersion, cc-by-sa)
- Figshare (submittedVersion, cc-by)
- Funders
- National Science Foundation (1053486)
- National Institutes of Health (5r01hl111759-04)
- National Heart, Lung, and Blood Institute (R01-HL111759, P01HL105339)
- Division of Biological Infrastructure (DBI-1053486)
- Topics
- Life Sciences › Biochemistry, Genetics and Molecular Biology › Molecular Biology › Gene Regulatory Network Analysis
- Life Sciences › Biochemistry, Genetics and Molecular Biology › Molecular Biology › Bioinformatics and Genomic Networks
- Life Sciences › Biochemistry, Genetics and Molecular Biology › Molecular Biology › Fungal and yeast genetics research
- Keywords
- regulatory network reconstruction, data integration, message passing, protein-protein interaction, gene expression, sequence motifs, yeast, genome-scale data, network prediction
- MeSH terms
- Algorithms, Computer Simulation, Models, Biological, Saccharomyces cerevisiae, Reproducibility of Results, Signal Transduction, Gene Regulatory Networks, Protein Interaction Maps
About these checks
Registry, retraction, Cites and statistics results are computed, not judged, with one exception: a printed reference that no index lists is read once by a model before it counts as a citation error. Claims are extracted by a model and kept only when their quote appears verbatim in the text; each cited source is then checked, with a model’s help, for whether it says what the claim relies on. Those verdicts can be wrong — read the claim’s quote and the cited source before relying on one.
Statistics and arithmetic are recomputed, not judged.
Confidence bands are shown only for fields calibrated on our annotated test set. None is calibrated yet, so no band is shown.
What counts as a claim ›How we measure confidence ›How we check this ›
Are you an author, or do you see a problem with this page? Request a review
