Student or educator? Sign up with your school email and get 6 months of Pro free.
Cited by 40

The DOI matches its Crossref record; 42 of the 42 references it cites were found in a registry or an index.

Pathological Neural Attractor Dynamics in Slowly Growing Gliomas Supports an Optimal Time Frame for White Matter Plasticity

Szalisznyo, Krisztina, Silverstein, David N., Duffau, Hugues, Smits, Anja·2013·PLoS ONE

Abstract

Neurological function in patients with slowly growing brain tumors can be preserved even after extensive tumor resection. However, the global process of cortical reshaping and cerebral redistribution cannot be understood without taking into account the white matter tracts. The aim of this study was to predict the functional consequences of tumor-induced white matter damage by computer simulation. A computational model was proposed, incorporating two cortical patches and the white matter connections of the uncinate fasciculus. Tumor-induced structural changes were modeled such that different aspects of the connectivity were altered, mimicking the biological heterogeneity of gliomas. The network performance was quantified by comparing memory pattern recall and the plastic compensatory capacity of the network was analyzed. The model predicts an optimal level of synaptic conductance boost that compensates for tumor-induced connectivity loss. Tumor density appears to change the optimal plasticity regime, but tumor size does not. Compensatory conductance values that are too high lead to performance loss in the network and eventually to epileptic activity. Tumors of different configurations show differences in memory recall performance with slightly lower plasticity values for dense tumors compared to more diffuse tumors. Simulation results also suggest an optimal noise level that is capable of increasing the recall performance in tumor-induced white matter damage. In conclusion, the model presented here is able to capture the influence of different tumor-related parameters on memory pattern recall decline and provides a new way to study the functional consequences of white matter invasion by slowly growing brain tumors.

Overview

The claims and statistics of this paper haven’t been checked yet.

Run the check — free, no account needed. It reads the open-access text and checks the sources it cites.

A few free checks a day · papers already verified open instantly · results are public

Integrity signals

Registry

Crossref · 10.1371/journal.pone.0069798

Cites

42 of 42 references verified0 citation errors · 0 not checkable

Statistics

Figures

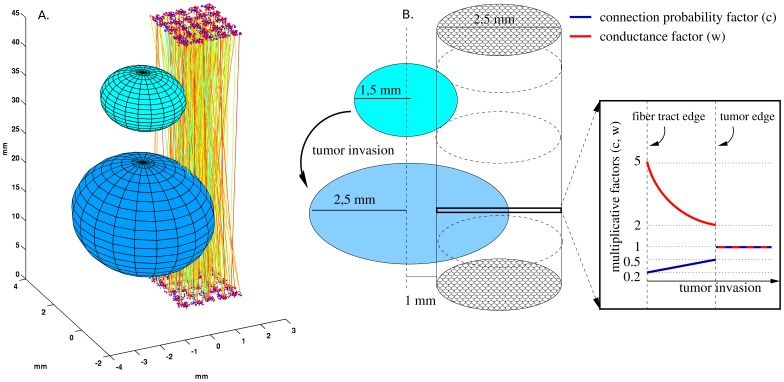
Figure 1 Schematic representation of tumor growth and the two neocortical patches with interconnecting fibers. A) The patches contain 5×5 hypercolumns and are interconnected by bidirectional fibers, which are invaded by a tumor. The tumor growth is represented by two different sizes. B) The center of the tumor was assumed to be outside of the fasciculus. The tumor invasion expands into the fiber, such that the center of the tumor remains fixed. Due to the invasion, the multiplicative connection probability factor (blue line) changes, such that the connection probability decreases closer to the tumor center and increases towards the tumor edge. With compensatory plasticity, the multiplicative conductance factor (red line) changes as well, such that closer to the tumor center, the conductance increases, and towards the tumor edge it decreases. In this example, the multiplicative value of the conductance and connection probability was conserved with a plasticity factor of 1. Outside the tumor, both the connection probability and the conductance were unaffected.
Figure 1 Schematic representation of tumor growth and the two neocortical patches with interconnecting fibers. A) The patches contain 5×5 hypercolumns and are interconnected by bidirectional fibers, which are invaded by a tumor. The tumor growth is represented by two different sizes. B) The center of the tumor was assumed to be outside of the fasciculus. The tumor invasion expands into the fiber, such that the center of the tumor remains fixed. Due to the invasion, the multiplicative connection probability factor (blue line) changes, such that the connection probability decreases closer to the tumor center and increases towards the tumor edge. With compensatory plasticity, the multiplicative conductance factor (red line) changes as well, such that closer to the tumor center, the conductance increases, and towards the tumor edge it decreases. In this example, the multiplicative value of the conductance and connection probability was conserved with a plasticity factor of 1. Outside the tumor, both the connection probability and the conductance were unaffected.CC BY · PubMed Central
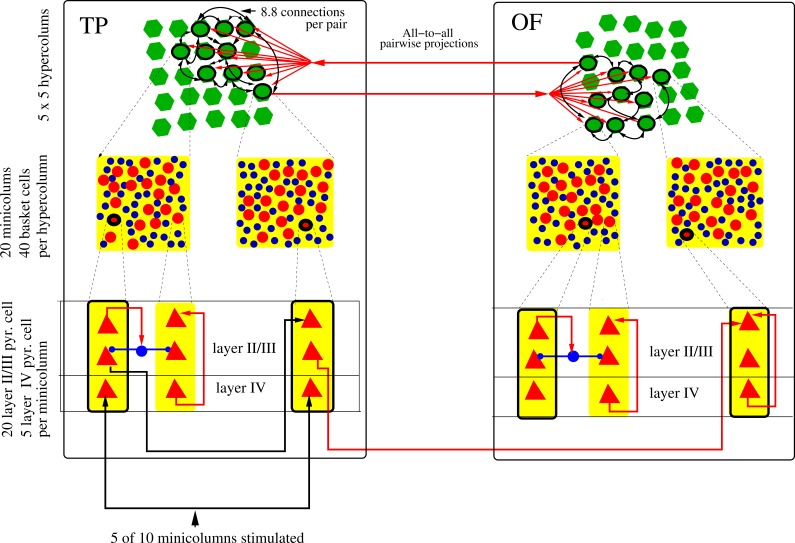
Figure 2 Schematic drawing of the neocortical minicolumns and hypercolumns used in the simulations, at three levels of abstraction. Both the temporal pole (TP) patch and the lateral orbitofrontal (OF) patch contain 5×5 hypercolumns (green). Each minicolumn contains 20 layer II/III pyramidal cells and 5 layer IV pyramidal cells (not all represented in the figure). Layer IV pyramidal cells have feed-forward excitatory projections to layer II/III pyramidal cells and layer II/III pyramidals have recurrent connections. Each hypercolumn contains 40 basket cells (blue), which provide lateral inhibition between minicolumns (blue arrows). Out of 25 hypercolumns, 10 are randomly selected, but spatially clustered for each memory pattern (black ring), and from each selected hypercolumn, a single minicolumn is randomly chosen. These 10 minicolumns have all-to-all excitatory synaptic connectivity with an expectation of 8.8 connections between any pair of minicolumns. In this figure, only some of the 90 connection pairs are shown. While synaptic connections are unidirectional, they occur in both directions for each minicolumn pair, so they are abstractly displayed as bidirectional. Each memory pattern local to one patch is connected to a corresponding one in the other patch with excitatory projections (red arrows). The pattern projections are all-to-all between the patches (in both directions) and have 1 fiber between any pair of minicolumns. For external stimulation, layer IV pyramidal cells in 5 random minicolumns out of the 10 in a selected memory pattern are stimulated in the TP patch (black arrow). This can activate a local attractor, which then propagates to the OF.
Figure 2 Schematic drawing of the neocortical minicolumns and hypercolumns used in the simulations, at three levels of abstraction. Both the temporal pole (TP) patch and the lateral orbitofrontal (OF) patch contain 5×5 hypercolumns (green). Each minicolumn contains 20 layer II/III pyramidal cells and 5 layer IV pyramidal cells (not all represented in the figure). Layer IV pyramidal cells have feed-forward excitatory projections to layer II/III pyramidal cells and layer II/III pyramidals have recurrent connections. Each hypercolumn contains 40 basket cells (blue), which provide lateral inhibition between minicolumns (blue arrows). Out of 25 hypercolumns, 10 are randomly selected, but spatially clustered for each memory pattern (black ring), and from each selected hypercolumn, a single minicolumn is randomly chosen. These 10 minicolumns have all-to-all excitatory synaptic connectivity with an expectation of 8.8 connections between any pair of minicolumns. In this figure, only some of the 90 connection pairs are shown. While synaptic connections are unidirectional, they occur in both directions for each minicolumn pair, so they are abstractly displayed as bidirectional. Each memory pattern local to one patch is connected to a corresponding one in the other patch with excitatory projections (red arrows). The pattern projections are all-to-all between the patches (in both directions) and have 1 fiber between any pair of minicolumns. For external stimulation, layer IV pyramidal cells in 5 random minicolumns out of the 10 in a selected memory pattern are stimulated in the TP patch (black arrow). This can activate a local attractor, which then propagates to the OF.CC BY · PubMed Central
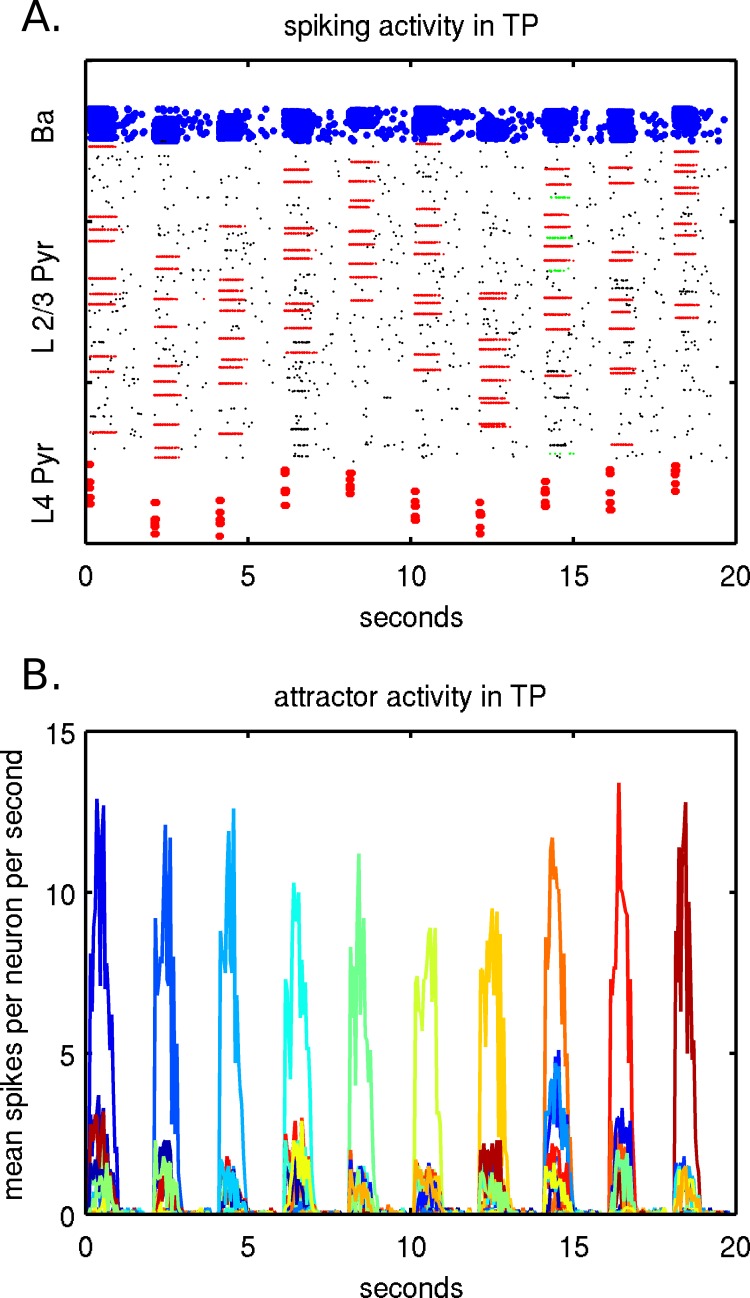
Figure 3 Example of neural activity in TP during recall of 10 memories, in 2 different representations (A,B) of the same simulation. A memory recall is performed every 2 seconds when layer IV pyramidal cells in 5 minicolumns are stimulated. A) Shows spiking activity of individual neurons in TP with stimulated layer IV pyramidal cells on the bottom, activated minicolumns in layer II/III in the middle and basket cells on the top. Five corresponding minicolumns in layer II/III initially activate and after the pattern completes, 10 minicolumns are activated, which can be seen individually as lines. B) Shows attractor activity of layer II/III pyramidal cells fromactivated memory patterns. The spiking activity within each memory pattern is averaged over a sliding 50 ms window . The 50 stored memory patterns are represented by different colors along a color spectrum. Memory patterns are tested and recalled sequentially and the corresponding attractor memory dominates, with weaker activity present due to memory pattern overlaps.
Figure 3 Example of neural activity in TP during recall of 10 memories, in 2 different representations (A,B) of the same simulation. A memory recall is performed every 2 seconds when layer IV pyramidal cells in 5 minicolumns are stimulated. A) Shows spiking activity of individual neurons in TP with stimulated layer IV pyramidal cells on the bottom, activated minicolumns in layer II/III in the middle and basket cells on the top. Five corresponding minicolumns in layer II/III initially activate and after the pattern completes, 10 minicolumns are activated, which can be seen individually as lines. B) Shows attractor activity of layer II/III pyramidal cells fromactivated memory patterns. The spiking activity within each memory pattern is averaged over a sliding 50 ms window . The 50 stored memory patterns are represented by different colors along a color spectrum. Memory patterns are tested and recalled sequentially and the corresponding attractor memory dominates, with weaker activity present due to memory pattern overlaps.CC BY · PubMed Central
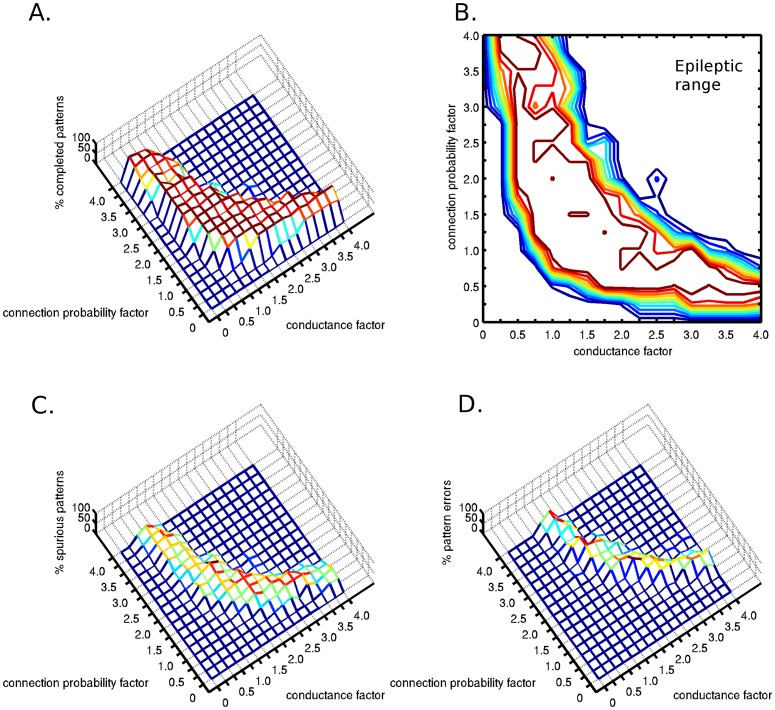
Figure 4 Two-dimensional sensitivity analysis of the attractor dynamics with respect to pattern completion. The connection probability and the synaptic conductance parameter space were examined assuming complete compensatory plasticity (plasticity factor of 1). Diffuse tumor invasion was represented by the connection probability factor <1. A) The percentage of completed patterns were plotted in two dimensional space. B) Contour plot of the completed patterns. C) Percentage of activated spurious patterns. D) Percentage of false patterns, without the activation of the stimulated correct pattern. At even higher connection probability and conductance values, epileptic neural activity was observed.
Figure 4 Two-dimensional sensitivity analysis of the attractor dynamics with respect to pattern completion. The connection probability and the synaptic conductance parameter space were examined assuming complete compensatory plasticity (plasticity factor of 1). Diffuse tumor invasion was represented by the connection probability factor <1. A) The percentage of completed patterns were plotted in two dimensional space. B) Contour plot of the completed patterns. C) Percentage of activated spurious patterns. D) Percentage of false patterns, without the activation of the stimulated correct pattern. At even higher connection probability and conductance values, epileptic neural activity was observed.CC BY · PubMed Central
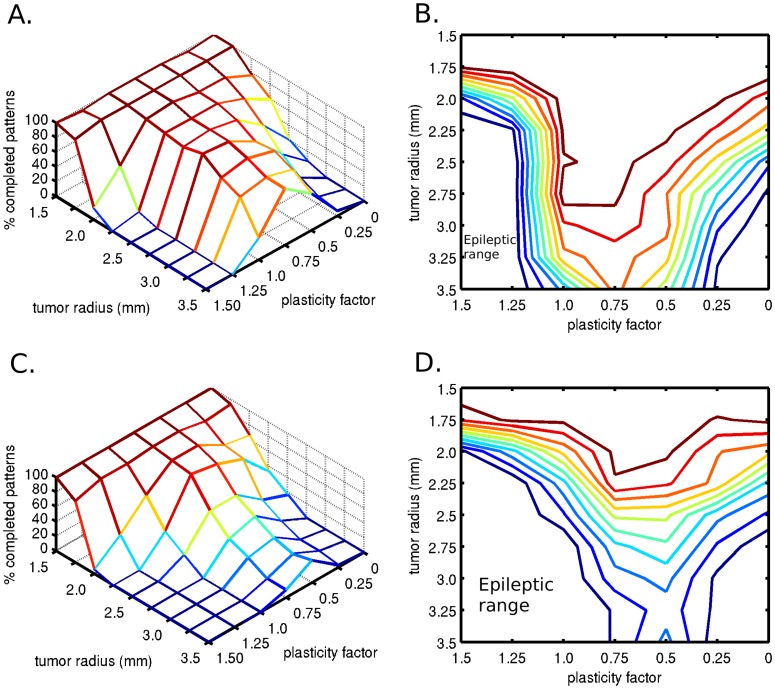
Figure 5 Effect of tumor size on attractor dynamics. A) Influence of tumor radius on the percentage of completed patterns, when connection probability loss at the tumor edge is 50%. In the presence of optimal compensatory synaptic plasticity, the memory pattern completion is better preserved than without plasticity. B) With the same connection probability loss as figure 4A, contour plot showing an optimal compensatory synaptic plasticity, which is capable of preserving the pattern completion function even with larger tumor size. C) Effect of tumor size on attractor dynamics in case of a denser tumor, when the connection probability loss at the edge of the tumor was 75%. Again, there exists an optimal compensatory synaptic plasticity, which is capable of preserving partial memory recall even with larger tumor size, but with a sharper functional decline. D) With the same connection probability loss as in Figure 4C, the contour plot demonstrates the optimal plasticity factor.
Figure 5 Effect of tumor size on attractor dynamics. A) Influence of tumor radius on the percentage of completed patterns, when connection probability loss at the tumor edge is 50%. In the presence of optimal compensatory synaptic plasticity, the memory pattern completion is better preserved than without plasticity. B) With the same connection probability loss as figure 4A, contour plot showing an optimal compensatory synaptic plasticity, which is capable of preserving the pattern completion function even with larger tumor size. C) Effect of tumor size on attractor dynamics in case of a denser tumor, when the connection probability loss at the edge of the tumor was 75%. Again, there exists an optimal compensatory synaptic plasticity, which is capable of preserving partial memory recall even with larger tumor size, but with a sharper functional decline. D) With the same connection probability loss as in Figure 4C, the contour plot demonstrates the optimal plasticity factor.CC BY · PubMed Central
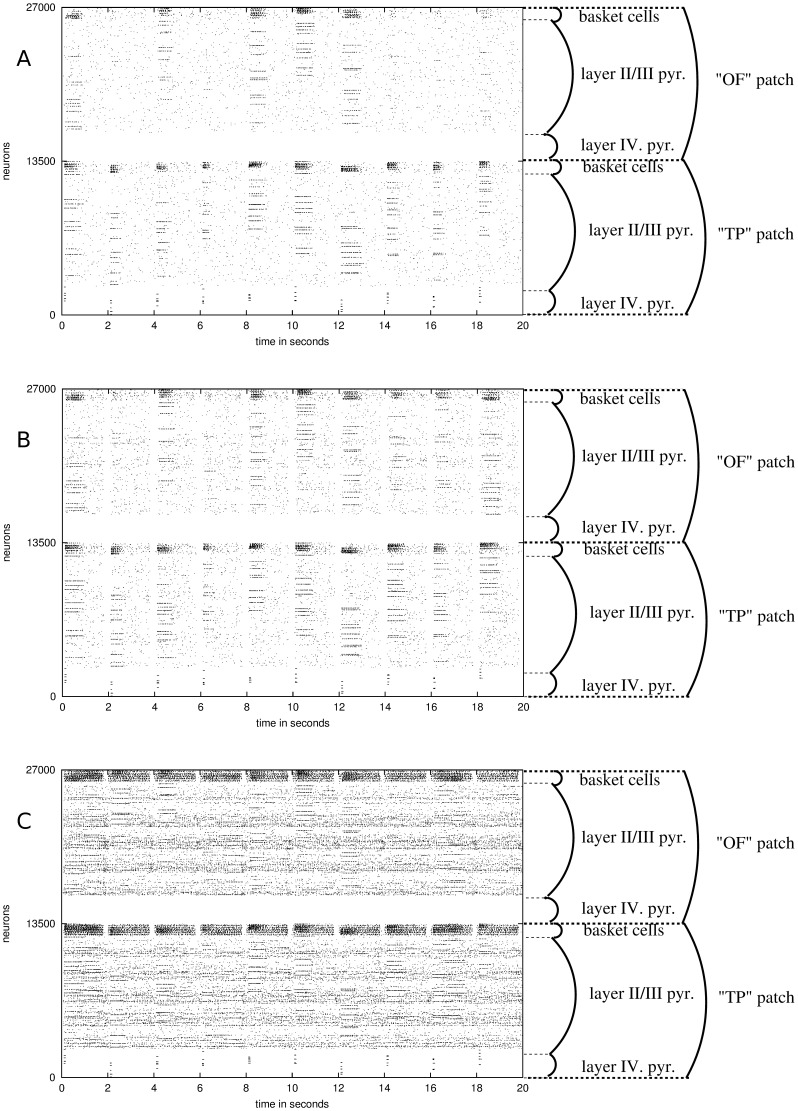
Figure 6 Effect of increased synaptic conductance noise on memory pattern transmission and recall across the UF. The synaptic conductance noise was increased from A to C with the presence of a tumor of radius 2.5 mm. This figure was based on the same data presented in Figure 7A and 7B. The noise was increased based on the fiber proximity to the tumor. A stimulated source patch represents the temporal pole (TP) while the destination patch represents the lateral orbitofrontal (OF) cortex. On each plot, each column occurring every 2 seconds represents a memory pattern recall test, with activated (from bottom) layer 4 pyramidals, layer II/III pyramidals and layer II/III basket cells. Each line within the layer II/III pyramidals shows an active minicolumn within a stored memory pattern. A) Noise at baseline. B) Noise increased up to 15% based on proximity to tumor (would be 25% at tumor center). C) Noise increased up to 45% based on proximity to tumor (would be 75% at tumor center).
Figure 6 Effect of increased synaptic conductance noise on memory pattern transmission and recall across the UF. The synaptic conductance noise was increased from A to C with the presence of a tumor of radius 2.5 mm. This figure was based on the same data presented in Figure 7A and 7B. The noise was increased based on the fiber proximity to the tumor. A stimulated source patch represents the temporal pole (TP) while the destination patch represents the lateral orbitofrontal (OF) cortex. On each plot, each column occurring every 2 seconds represents a memory pattern recall test, with activated (from bottom) layer 4 pyramidals, layer II/III pyramidals and layer II/III basket cells. Each line within the layer II/III pyramidals shows an active minicolumn within a stored memory pattern. A) Noise at baseline. B) Noise increased up to 15% based on proximity to tumor (would be 25% at tumor center). C) Noise increased up to 45% based on proximity to tumor (would be 75% at tumor center).CC BY · PubMed Central
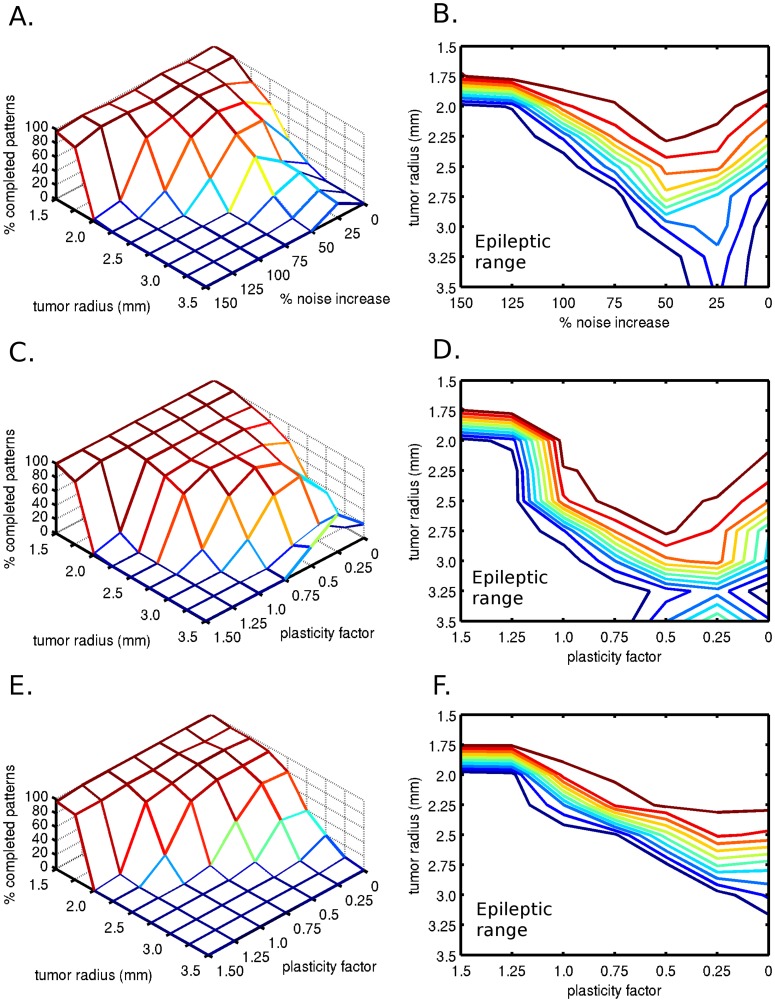
Figure 7 Effect of additional synaptic conductance noise on memory pattern completion. A) Effect of increasing noise levels and tumor growth on the percentage of completed patterns, with a connection probability loss of 50% at the tumor edge. B) Contour plot of A, showing an optimal noise level for pattern completion. C) Effects of plasticity and tumor size with up to 25% additional noise on memory pattern completion. The additional noise was linearly increased based on proximity from the tumor center, where it would be 25% higher than baseline, with a connection probability loss at the tumor edge of 50%. D) Contour plot of C, showing the percentage of completed patterns. E) Effects of plasticity and tumor size with up to 50% additional noise on memory pattern completion. The additional noise was linearly increased based on proximity from the tumor center, where it would be 50% higher than baseline, with a connection probability loss at the tumor edge of 50%. F) Contour plot of E, showing the percentage of correctly completed patterns.
Figure 7 Effect of additional synaptic conductance noise on memory pattern completion. A) Effect of increasing noise levels and tumor growth on the percentage of completed patterns, with a connection probability loss of 50% at the tumor edge. B) Contour plot of A, showing an optimal noise level for pattern completion. C) Effects of plasticity and tumor size with up to 25% additional noise on memory pattern completion. The additional noise was linearly increased based on proximity from the tumor center, where it would be 25% higher than baseline, with a connection probability loss at the tumor edge of 50%. D) Contour plot of C, showing the percentage of completed patterns. E) Effects of plasticity and tumor size with up to 50% additional noise on memory pattern completion. The additional noise was linearly increased based on proximity from the tumor center, where it would be 50% higher than baseline, with a connection probability loss at the tumor edge of 50%. F) Contour plot of E, showing the percentage of correctly completed patterns.CC BY · PubMed Central
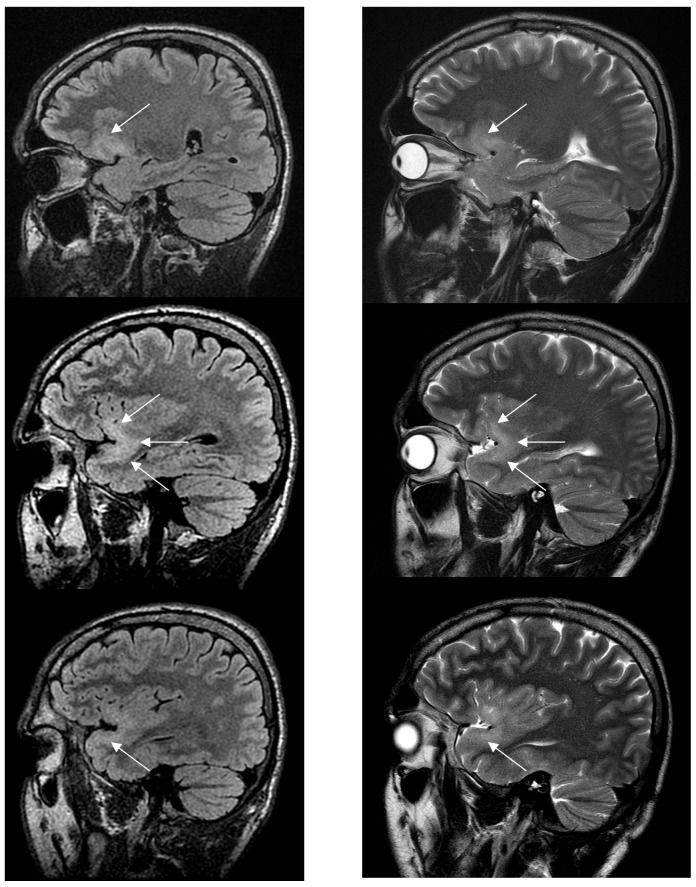
Figure 8 Sagittal FLAIR-weighted MRI (left) and sagittal T2-weighted MRI (right) performed in a 30-year-old right-handed asymptomatic patient who participated in a research protocol. This MRI shows a left WHO grade II glioma involving the uncinate fascicle (white arrows), from the orbitofrontal part (upper) to the temporopolar part (lower) through the temporal stem (middle).
Figure 8 Sagittal FLAIR-weighted MRI (left) and sagittal T2-weighted MRI (right) performed in a 30-year-old right-handed asymptomatic patient who participated in a research protocol. This MRI shows a left WHO grade II glioma involving the uncinate fascicle (white arrows), from the orbitofrontal part (upper) to the temporopolar part (lower) through the temporal stem (middle).CC BY · PubMed Central

Verification

Claims the paper makes

The claims and statistics of this paper haven’t been checked yet.

Run the check — free, no account needed. It reads the open-access text and checks the sources it cites.

A few free checks a day · papers already verified open instantly · results are public

Claims other papers make about this one

Each is checked against this paper’s own text: does it say what the citing paper says it does?

Self-check

Percentages, sums and reported differences re-computed from the paper’s own numbers.

The self-check needs the paper’s full text.

Citations

Cites

Show all 42 references

Cited by

Metadata

Authors
Szalisznyo, K., Silverstein, D. N., Duffau, H., & Smits, A.
Venue
PLoS ONE
Published
2013-07-26
Volume
8
Issue
7
Pages
e69798
ISSN
1932-6203
Cited by
40
References
42
Language
en

About these checks

Registry, retraction, Cites and statistics results are computed, not judged, with one exception: a printed reference that no index lists is read once by a model before it counts as a citation error. Claims are extracted by a model and kept only when their quote appears verbatim in the text; each cited source is then checked, with a model’s help, for whether it says what the claim relies on. Those verdicts can be wrong — read the claim’s quote and the cited source before relying on one.

Statistics and arithmetic are recomputed, not judged.

Confidence bands are shown only for fields calibrated on our annotated test set. None is calibrated yet, so no band is shown.

What counts as a claim ›How we measure confidence ›How we check this ›

Are you an author, or do you see a problem with this page? Request a review

Data sources

Bibliographic data: Semantic Scholar, OpenAlex, Crossref.

Contains information from the Semantic Scholar Academic Graph Datasets, made available under the ODC Attribution License (ODC-BY 1.0).

Semantic Scholar’s data is described in: Kinney, R., et al. (2023). The Semantic Scholar Open Data Platform. arXiv:2301.10140.