

The DOI matches its Crossref record; 111 of the 111 references it cites were found in a registry or an index.
Circadian Adaptation to Night Shift Work Influences Sleep, Performance, Mood and the Autonomic Modulation of the Heart
Open accessAbstract
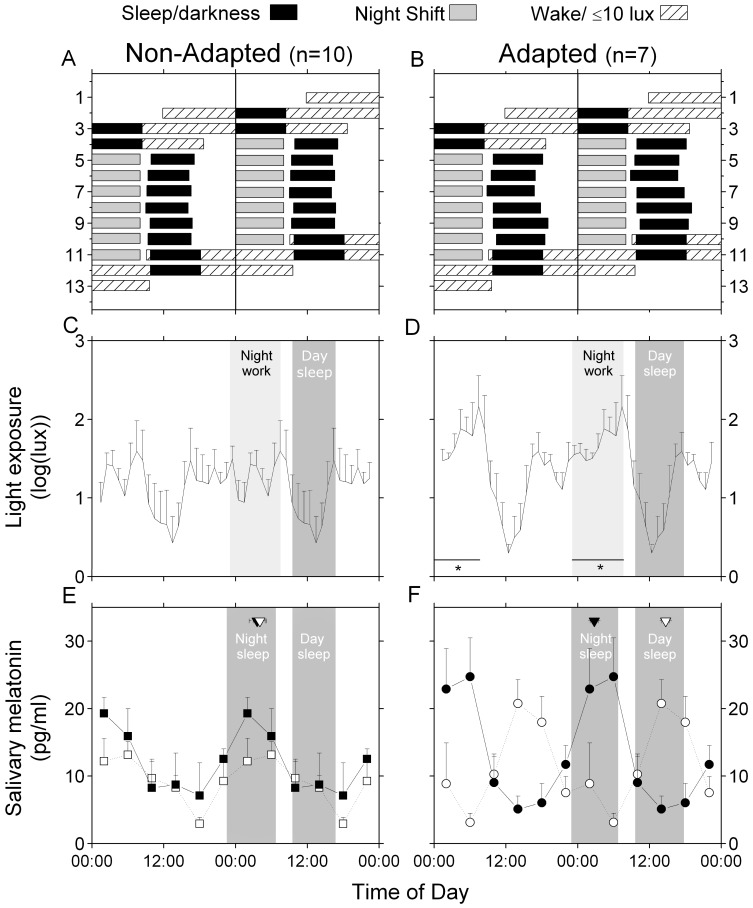
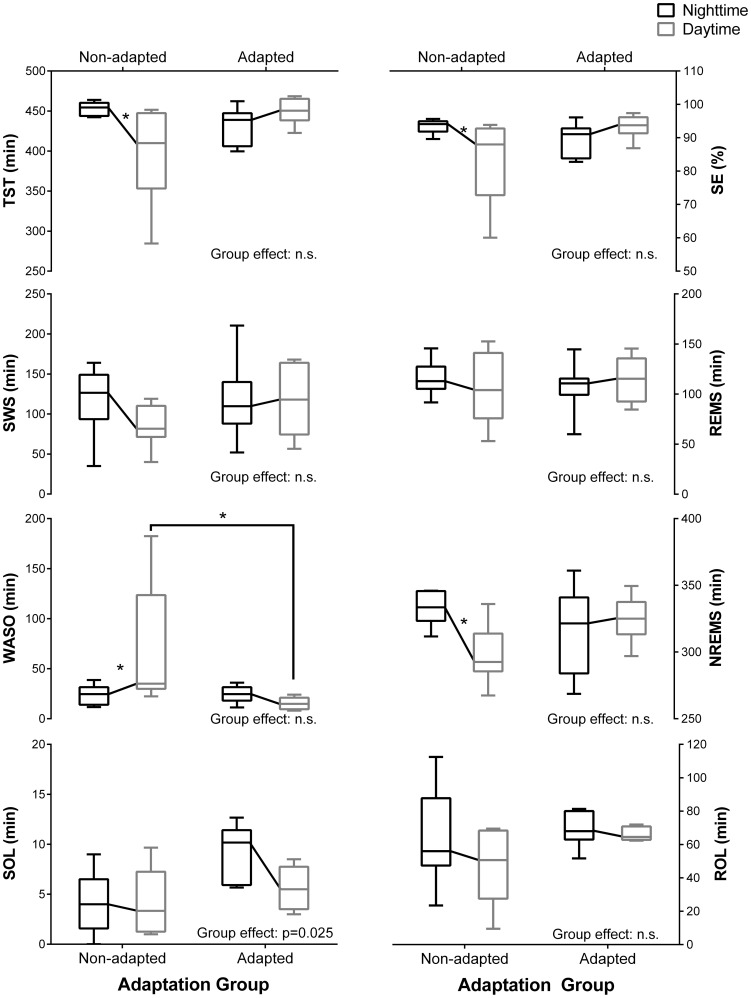
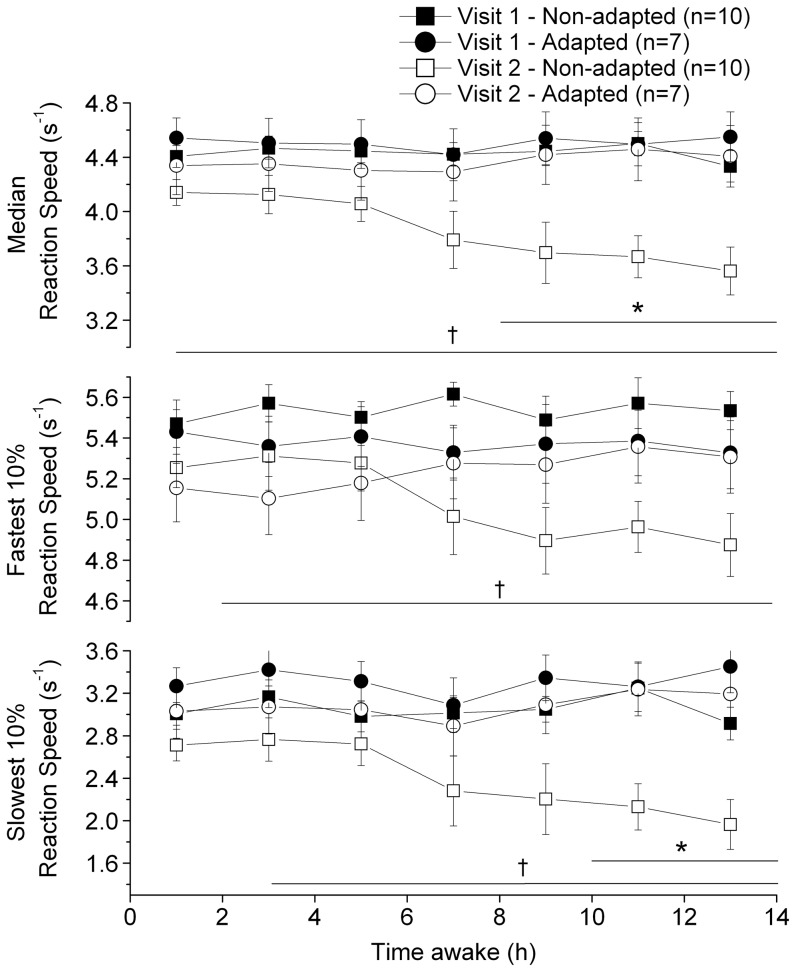
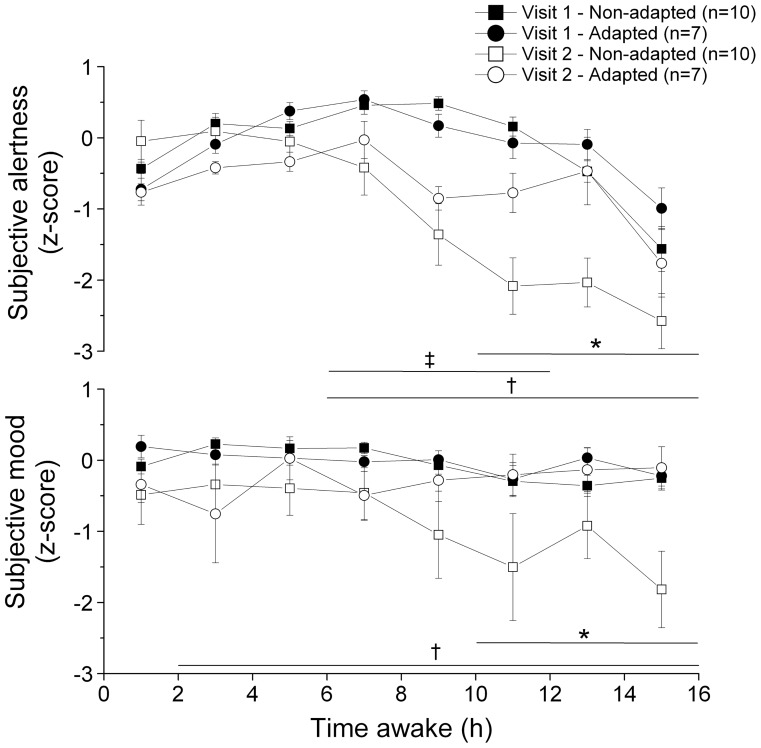
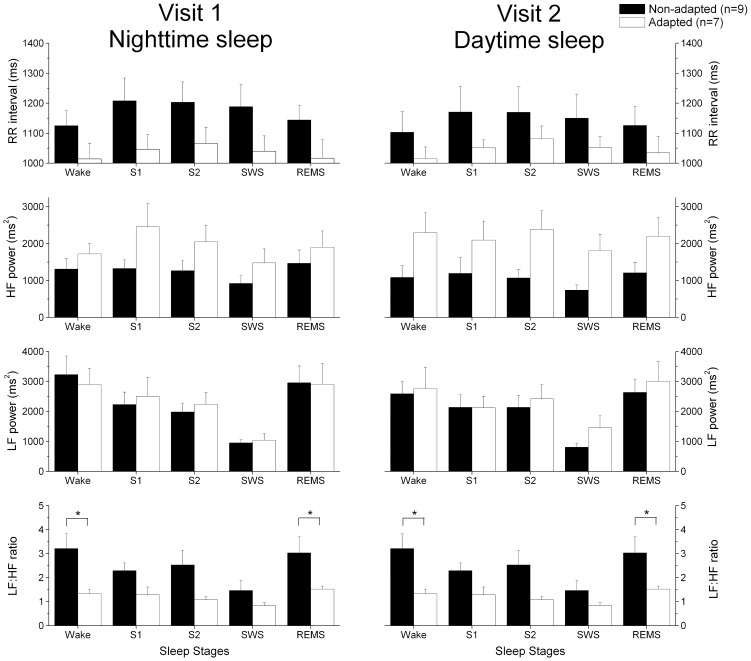
Our aim was to investigate how circadian adaptation to night shift work affects psychomotor performance, sleep, subjective alertness and mood, melatonin levels, and heart rate variability (HRV). Fifteen healthy police officers on patrol working rotating shifts participated to a bright light intervention study with 2 participants studied under two conditions. The participants entered the laboratory for 48 h before and after a series of 7 consecutive night shifts in the field. The nighttime and daytime sleep periods were scheduled during the first and second laboratory visit, respectively. The subjects were considered "adapted" to night shifts if their peak salivary melatonin occurred during their daytime sleep period during the second visit. The sleep duration and quality were comparable between laboratory visits in the adapted group, whereas they were reduced during visit 2 in the non-adapted group. Reaction speed was higher at the end of the waking period during the second laboratory visit in the adapted compared to the non-adapted group. Sleep onset latency (SOL) and subjective mood levels were significantly reduced and the LF∶HF ratio during daytime sleep was significantly increased in the non-adapted group compared to the adapted group. Circadian adaptation to night shift work led to better performance, alertness and mood levels, longer daytime sleep, and lower sympathetic dominance during daytime sleep. These results suggest that the degree of circadian adaptation to night shift work is associated to different health indices. Longitudinal studies are required to investigate long-term clinical implications of circadian misalignment to atypical work schedules.
Overview
The claims and statistics of this paper haven’t been checked yet.
Run the check — free, no account needed. It reads the open-access text and checks the sources it cites.
Integrity signals
Registry
Cites
Statistics
Figures
Verification
Claims the paper makes
The claims and statistics of this paper haven’t been checked yet.
Run the check — free, no account needed. It reads the open-access text and checks the sources it cites.
Claims other papers make about this one
Each is checked against this paper’s own text: does it say what the citing paper says it does?
In the citing paper
“Sympathovagal balance is then disrupted [72], as indicated by changes in heart rate variability that are believed to reflect increased risk of cardiovascular disease (CVD) [73].”
From Shift Work: Disrupted Circadian Rhythms and Sleep—Implications for Health and Well-being (2017) · cites this paper as [73]
In the citing paper
“Boudreau and colleagues found that circadian adaptation to night work resulted in improved sleep, improved performance, and improved heart rate variability (Boudreau et al., 2013).”
From Addressing sleep disturbances: an opportunity to prevent cardiometabolic disease? (2014) · cites this paper as Boudreau et al., 2013
Self-check
Percentages, sums and reported differences re-computed from the paper’s own numbers.
The self-check needs the paper’s full text.
Citations
Cites
Heart Rate Variability: Standards of Measurement, Physiological Interpretation, and Clinical Use
Electrophysiology, T. F. O. T. E. S. O. C. T. N. A. (1996) · Circulation · doi:10.1161/01.cir.93.5.1043 · Cited by 17,159
Heart rate variability: Standards of measurement, physiological interpretation, and clinical use
Malik, M., Bigger, J. T., Camm, A. J., Kleiger, R. E., Malliani, A., Moss, A. J., & Schwartz, P. J. (1996) · European Heart Journal · doi:10.1093/oxfordjournals.eurheartj.a014868 · Cited by 15,289
Rechtschaffen, A. (1968) · Medical Entomology and Zoology · Cited by 11,772
(2007) · Cited by 6,530
A self-assessment questionnaire to determine morningness- eveningness in human circadian rhythms
Home, J. K. (1976) · Medical Entomology and Zoology · Cited by 4,783
(1976) · PubMed · Cited by 3,979
Impact of sleep debt on metabolic and endocrine function
Spiegel, K., Leproult, R., & Van Cauter, E. (1999) · The Lancet · doi:10.1016/s0140-6736(99)01376-8 · Cited by 3,668
Van Dongen, H. P. A., Maislin, G., Mullington, J. M., & Dinges, D. F. (2003) · Sleep · doi:10.1093/sleep/26.2.117 · Cited by 3,173
Dinges, D. F., Pack, F. M., Williams, K., Gillen, K. A., Powell, J. W., Ott, G. E., Trasande, C. A., & Pack, A. I. (1997) · SLEEP · doi:10.1093/sleep/20.4.267 · Cited by 2,018 · cited 3×
“Sleep restriction can also contribute to impaired mood, as a week of sleep restriction to 4–5 hours/night can lead to increased sleepiness and reduced subjective mood levels [11].”
BackgroundResult
Research works printed but not linked: 1
- Wyszecki G, Stiles WS (2000) Color Science: Concepts and Methods, Quantitative Data and Formulae (2nd eds.): John Wiley & Sons.
Cited by
Sorted by citations
Health consequences of shift work and insufficient sleep
Kecklund, G., & Axelsson, J. (2016) · BMJ · doi:10.1136/bmj.i5210 · Cited by 1,195
Impacts of shift work on sleep and circadian rhythms
Boivin, D. B., & Boudreau, P. (2014) · Pathologie Biologie · doi:10.1016/j.patbio.2014.08.001 · Cited by 639
Self-citationShift Work: Disrupted Circadian Rhythms and Sleep—Implications for Health and Well-being
James, S. M., Honn, K. A., Gaddameedhi, S., & Van Dongen, H. P. A. (2017) · Current Sleep Medicine Reports · doi:10.1007/s40675-017-0071-6 · Cited by 517
Disturbance of the Circadian System in Shift Work and Its Health Impact
Boivin, D. B., Boudreau, P., & Kosmadopoulos, A. (2021) · Journal of Biological Rhythms · doi:10.1177/07487304211064218 · Cited by 580
“These changes result in circadian misalignment, which describes a state of desynchronization between circadian clocks and the environment (Boivin and James, 2002a; Boudreau et al., 2013a; Skene et al., 2018; Kervezee et al., 2019a).”
BackgroundSelf-citationRole of the circadian system in cardiovascular disease
Thosar, S. S., Butler, M. P., & Shea, S. A. (2018) · Journal of Clinical Investigation · doi:10.1172/jci80590 · Cited by 443
“org Volume 128 Number 6 June 2018 bright light during night shifts and reducing light exposure following the end of night shifts (148–150) helps shift the circadian pacemaker and does improve performance, mood, and reduces sympathetic activity in night-shift workers who sleep during the daytime (151).”
Police stressors and health: a state-of-the-art review
Violanti, J. M., Charles, L. E., McCanlies, E., Hartley, T. A., Baughman, P., Andrew, M. E., Fekedulegn, D., Ma, C. C., Mnatsakanova, A., & Burchfiel, C. M. (2017) · Policing: An International Journal of Police Strategies & Management · doi:10.1108/pijpsm-06-2016-0097 · Cited by 360
“Circadian adaptation to night shift work was associated with better performance, alertness, mood, and more sleep (Boudreau et al., 2013).”
BackgroundKervezee, L., Kosmadopoulos, A., & Boivin, D. B. (2018) · European Journal of Neuroscience · doi:10.1111/ejn.14216 · Cited by 232
“…whose central circadian clock was not adapted after a week of nights compared to those whose clock was adapted: namely, the sympathetic modulation of the heart was increased relative to the parasympathetic modulation in the non- adapted group compared to the adapted group (Boudreau et al., 2013).”
ResultSelf-citationKervezee, L., Cuesta, M., Cermakian, N., & Boivin, D. B. (2018) · Proceedings of the National Academy of Sciences · doi:10.1073/pnas.1720719115 · Cited by 136
“Although some of the entrainment cues that may be present in actual night shift workers, such as physical exercise and exposure to brighter light, are not mimicked by our protocol, it should be noted that in the majority of actual shift workers, the central circadian clock does not adjust to the night shift schedule (…”
BackgroundSelf-citationGlucocorticoids entrain molecular clock components in human peripheral cells
Cuesta, M., Cermakian, N., & Boivin, D. B. (2014) · The FASEB Journal · doi:10.1096/fj.14-265686 · Cited by 125
“Innight workers who adapt to their atypical schedule, this peak is shifted to the late afternoon, near the shifted wake-up time (11, 22).”
BackgroundSelf-citationBooker, L. A., Sletten, T. L., Alvaro, P. K., Barnes, M., Collins, A., Chai‐Coetzer, C. L., Naqvi, A., McMahon, M., Lockley, S. W., Rajaratnam, S. M. W., et al. (2020) · Journal of Sleep Research · doi:10.1111/jsr.12872 · Cited by 121
“…occupations, healthcare workers experience elevated stress levels in the workplace due to exposure to emotional and traumatic situations, potentially impacting on an individual's mental health (Adriaenssens, de Gucht, & Maes, 2012; Campbell, 2014; Spelten, Totterdell, Barton, & Folkard, 1995).”
BackgroundObayashi, K., Saeki, K., & Kurumatani, N. (2014) · Chronobiology International · doi:10.3109/07420528.2014.937491 · Cited by 110
“Chronic circadian misalignment between the internal and environmental rhythms, which is typically related to night-shift work and clock-gene variants, is associated with disruption of SCN function and increased risk of insomnia (Allebrandt et al., 2010; Boudreau et al., 2013; Wyatt et al., 1999).”
BackgroundFaulkner, S., Bee, P., Meyer, N., Dijk, D., & Drake, R. (2019) · Sleep Medicine Reviews · doi:10.1016/j.smrv.2019.04.012 · Cited by 111
Truong, K. K., Lam, M. T. Y., Grandner, M. A., Sassoon, C. S. H., & Malhotra, A. (2016) · Annals of the American Thoracic Society · doi:10.1513/annalsats.201602-125fr · Cited by 105
“Sleep loss affects neurocognitive performance (11, 12), behavior (13), and cardiometabolic disease risk (14).”
Ritonja, J. A., Aronson, K. J., Matthews, R. W., Boivin, D. B., & Kantermann, T. (2019) · Industrial Health · doi:10.2486/indhealth.sw-5 · Cited by 107
Self-citationCircadian misalignment increases mood vulnerability in simulated shift work
Chellappa, S. L., Morris, C. J., & Scheer, F. A. J. L. (2020) · Scientific Reports · doi:10.1038/s41598-020-75245-9 · Cited by 106
Addressing sleep disturbances: an opportunity to prevent cardiometabolic disease?
Grandner, M. A. (2014) · International Review of Psychiatry · doi:10.3109/09540261.2014.911148 · Cited by 88
“For example, Boudreau and colleagues found that circadian adaptation to night work resulted in improved sleep, improved performance, and improved heart rate variability (Boudreau et al., 2013).”
BackgroundShift Work and Sleep Quality Among Urban Police Officers
Fekedulegn, D. B., Burchfiel, C. M., Charles, L. E., Hartley, T. A., Andrew, M. E., & Violanti, J. M. (2016) · Journal of Occupational and Environmental Medicine · doi:10.1097/jom.0000000000000620 · Cited by 82
“In a laboratory study of healthy police officers, Boudreau et al 30 demonstrated that officers with circadian adaptation to night-shift work showed better performance, alertness and mood levels, and longer daytime sleep compared with officers who were “non-adapted.””
Jaradat, R., Lahlouh, A., & Mustafa, M. (2020) · Sleep Medicine · doi:10.1016/j.sleep.2019.11.1258 · Cited by 72
Stone, J., Sletten, T. L., Magee, M., Ganesan, S., Mulhall, M. D., Collins, A., Howard, M. E., Lockley, S. W., & Rajaratnam, S. M. W. (2018) · The Journal of Physiology · doi:10.1113/jp275589 · Cited by 65
“Re-aligning the circadian pacemaker with the imposed sleep–wake cycle leads to improved sleep and neurobehavioural outcomes (Baehr et al. 1999; Crowley et al. 2004; Boivin et al. 2012; Chapdelaine et al. 2012; Boudreau et al. 2013).”
BackgroundPeripheral Skin Temperature and Circadian Biological Clock in Shift Nurses after a Day off
Bracci, M., Ciarapica, V., Copertaro, A., Barbaresi, M., Manzella, N., Tomasetti, M., Gaetani, S., Monaco, F., Amati, M., Valentino, M., et al. (2016) · International Journal of Molecular Sciences · doi:10.3390/ijms17050623 · Cited by 63
“The need for continuous production in the industry sector, and continuous patient’s care in the health sector, suggest that many workers cannot adjust their sleep/wake cycle to the light/dark cycle [10–12].”
BackgroundImpact of Shift Work on the Circadian Timing System and Health in Women
Kervezee, L., Shechter, A., & Boivin, D. B. (2018) · Sleep Medicine Clinics · doi:10.1016/j.jsmc.2018.04.003 · Cited by 60
Self-citationReitz, C. J., & Martino, T. A. (2015) · Current Pharmaceutical Design · doi:10.2174/1381612821666150706105926 · Cited by 55
“Conversely, circadian adjustment to shift work by using phototherapy can improve performance and health indices [63, 72].”
BackgroundHallman, D., Sato, T. D. O., Kristiansen, J., Gupta, N., Skotte, J. H., & Holtermann, A. (2015) · International Journal of Environmental Research and Public Health · doi:10.3390/ijerph121114811 · Cited by 54
“Also, by performing a secondary analysis with exclusion of workers reporting night-shift work, we accounted (at least to some extent) for potential confounding by the occurrence of general fatigue due to irregular work hours [52,53].”
Ribeiro‐Lages, M. B., Manfredini, D., Tavares-Silva, C. M., Costa, L. S., Luiz, R. R., Paiva, S. M., Serra‐Negra, J. M., Fonseca‐Gonçalves, A., & Maia, L. C. (2018) · Chronobiology International · doi:10.1080/07420528.2018.1424176 · Cited by 50
“Additionally, variations in sleep periods can cause a spectrum of health problems, such as obesity, hypertension, and diabetes, in addition to sleep disorders that are specifically related to the circadian rhythm (Martinez et al. 2008; Boudreau et al. 2013).”
BackgroundSerra‐Negra, J. M., Lobbezoo, F., Martins, C. C., Stellini, E., & Manfredini, D. (2017) · Medical Hypotheses · doi:10.1016/j.mehy.2017.01.024 · Cited by 48
Disruption of central and peripheral circadian clocks in police officers working at night
Koshy, A., Cuesta, M., Boudreau, P., Cermakian, N., & Boivin, D. B. (2019) · The FASEB Journal · doi:10.1096/fj.201801889r · Cited by 46
Self-citationOlson, J. A., Artenie, D. Z., Cyr, M., Raz, A., & Lee, V. (2019) · Chronobiology International · doi:10.1080/07420528.2019.1698591 · Cited by 49
“…Campbell and Dawson 1990; Czeisler et al. 1990; Daurat et al. 2000; Gillberg et al. 1996; Härmä et al. 1989; Kretschmer et al. 2011; Wright Jr. et al., 1997), mood (Boudreau et al. 2013; Smith et al. 2009), and sleep (Boivin et al. 2012) as a result of circadian and sleep hygiene interventions.”
BackgroundScheduled evening sleep and enhanced lighting improve adaptation to night shift work in older adults
Chinoy, E. D., Harris, M. P., Kim, M. J., Wang, W., & Duffy, J. F. (2016) · Occupational and Environmental Medicine · doi:10.1136/oemed-2016-103712 · Cited by 43
Sleep Strategies of Night-Shift Nurses on Days Off: Which Ones are Most Adaptive?
Petrov, M. E. R., Clark, C. B., Molzof, H. E., Johnson, R. L., Cropsey, K. L., & Gamble, K. L. (2014) · Frontiers in Neurology · doi:10.3389/fneur.2014.00277 · Cited by 39
“This schedule was used to define the five sleep strategy types for off-shift days according to previously determined operational definitions from Gamble and colleagues (14).”
BackgroundMethodResultInfluentialShift Work and Heart Rate Variability Coherence: Pilot Study Among Nurses
Burch, J. B., Alexander, M. S., Balte, P., Sofge, J., Winstead, J., Kothandaraman, V., & Ginsberg, J. P. (2018) · Applied Psychophysiology and Biofeedback · doi:10.1007/s10484-018-9419-z · Cited by 47
“, timing, rotation, duration, intensity), as well as shift work adaptation strategies (Burch et al. 2009, 2005; Boudreau et al. 2013; Gamble et al. 2011; Arendt 2010), cognitive demands of the workplace, sleep stages, and potentially modifying intrinsic (e.”
BackgroundResultInfluentialInfluence of shift work on rest-activity rhythms, sleep quality, and fatigue of female nurses
Chang, W., & Li, H.-B. (2021) · Chronobiology International · doi:10.1080/07420528.2021.2005082 · Cited by 34
“They must therefore stay awake and battle drowsiness during times when their biological clock signals sleep, which then results in fatigue after several consecutive shifts at work (Boudreau et al. 2013).”
BackgroundDaytime eating prevents mood vulnerability in night work
Qian, J., Vujović, N., Nguyen, H. Q., Rahman, N., Heng, S. W., Amira, S. A., Scheer, F. A. J. L., & Chellappa, S. L. (2022) · Proceedings of the National Academy of Sciences · doi:10.1073/pnas.2206348119 · Cited by 35
Chang, W., & Peng, Y.-X. (2021) · Journal of Occupational Health · doi:10.1002/1348-9585.12262 · Cited by 34
Lin, J., Kuang, H., Jiang, J., Zhou, H., Li, P., Xu, Y., & Kuang, J. (2023) · Medical Science Monitor · doi:10.12659/msm.942215 · Cited by 33
“It has been recognized that people who cannot adapt to shift work may have a significantly increased RR interval compared with those who can adapt to night shift work, and the latter group of people have a sympathetic dominance due to circadian misalignment [68].”
BackgroundSerra‐Negra, J. M., Dias, R. B., Rodrigues, M. J., Aguiar, S. O., Auad, S. M., Pordeus, I. A., Lombardo, L., & Manfredini, D. (2019) · CRANIO® · doi:10.1080/08869634.2019.1587854 · Cited by 31
“gical clock” under biochemical control, with repeated cycles of hormones, enzymes, and substances released over a 24-h span, which govern neurovegetative functions and performance [9,10].”
BackgroundAarts, M. M., Hartmeyer, S. L., Morsink, K., Kort, H. S. M., & de Kort, Y. A. W. (2020) · Clocks & Sleep · doi:10.3390/clockssleep2020018 · Cited by 28
“[48] light box, sunglasses 1350 x‡‡ Full a 15 X X + * ( S ) + ** ( R ) + * ( S) X X ( ood”
InfluentialObstructive sleep apnea, shift work and cardiometabolic risk
Santos, I., Rocha, I., Gozal, D., & Cruz, M. G. M. E. (2020) · Sleep Medicine · doi:10.1016/j.sleep.2020.05.013 · Cited by 26
Li, X., He, Y., Wang, D., & Momeni, M. R. (2024) · Clinical and Experimental Medicine · doi:10.1007/s10238-024-01514-w · Cited by 28
“Factors like gene-environment interactions, the chronotype of individuals, the alignment of their circadian rhythms, and their exposure to light and darkness throughout the day significantly influence one’s adaptation to shift work [72, 73].”
Pressure Building Against the Clock: The Impact of Circadian Misalignment on Blood Pressure
Shafer, B. M., Kogan, S. A., & McHill, A. W. (2023) · Current Hypertension Reports · doi:10.1007/s11906-023-01274-0 · Cited by 24
“Moreover, evidence suggests that circadian misalignment, particularly when accompanied by sleep restriction, may further promote the dysregulation of arterial pressures via changes in autonomic nervous system balance [4, 8, 55–57] and/or sodium retention [58 • ].”
Fink, A. M. (2020) · International Journal of Occupational Medicine and Environmental Health · doi:10.13075/ijomeh.1896.01560 · Cited by 20
Magee, M., Sletten, T. L., Ferguson, S. A., Grunstein, R. R., Anderson, C., Kennaway, D. J., Lockley, S. W., & Rajaratnam, S. M. W. (2016) · Scandinavian Journal of Work Environment & Health · doi:10.5271/sjweh.3560 · Cited by 22
“This finding was consistent with previous reports that adjustment (both partial and full) of the circadian pacemaker to night shift work attenuates performance deficits particularly over successive night shifts (36, 50, 51), and that reducing circadian misalignment during night shift work improves performance (51, 55).”
ResultField-based longitudinal evaluation of multimodal worker fatigue assessments in offshore shiftwork
Kang, J., Payne, S. C., Sasangohar, F., & Mehta, R. K. (2023) · Applied Ergonomics · doi:10.1016/j.apergo.2023.104164 · Cited by 24
Association between chronotype and psychomotor performance of rotating shift workers
Rosa, D. E., Marot, L. P., de Mello, M. T., Marqueze, E. C., Narciso, F. V., de Araújo, L. B., & Crispim, C. A. (2021) · Scientific Reports · doi:10.1038/s41598-021-86299-8 · Cited by 23
Move the night way: how can physical activity facilitate adaptation to shift work?
Easton, D. F., Gupta, C. C., Vincent, G. E., & Ferguson, S. A. (2024) · Communications Biology · doi:10.1038/s42003-024-05962-8 · Cited by 19
der Holst, H. M. L., Dongen, H. P. A. V., Drosopoulos, S., & KERKHOF, G. A. (2016) · Chronobiology International · doi:10.3109/07420528.2016.1167733 · Cited by 18
“In the short term, shift workers suffer from insomnia and/or excessive sleepiness, performance decrements, and mood swings (Boudreau et al., 2013; Drake et al., 2004; Rajaratnam et al., 2013).”
BackgroundBonham, M. P., Leung, G. K. W., Davis, R., Sletten, T. L., Murgia, C., Young, M. J., Eikelis, N., Lambert, É., & Huggins, C. E. (2018) · BMJ Open · doi:10.1136/bmjopen-2017-020396 · Cited by 19
Alertness and psychomotor performance levels of marine pilots on an irregular work roster
Boudreau, P., Lafrance, S., & Boivin, D. B. (2018) · Chronobiology International · doi:10.1080/07420528.2018.1466796 · Cited by 18
“Even when looking at permanent night shift work, the exact prevalence of circadian adjustment remains controversial (Folkard 2008; Boudreau et al. 2013).”
BackgroundSelf-citationChang, W., & Li, H.-B. (2019) · Chronobiology International · doi:10.1080/07420528.2019.1681441 · Cited by 17
“Deep sleep is crucial for the body to recover from fatigue, and night-shift workers, who sleep during the day, have significantly reduced deep sleep times (Boudreau et al. 2013).”
BackgroundApplications in sleep: How light affects sleep
Santhi, N., & Ball, D. M. (2020) · Progress in brain research · doi:10.1016/bs.pbr.2020.05.029 · Cited by 19
Pre-awake light exposure and sleep disturbances: findings from the HEIJO-KYO cohort
Obayashi, K., Yamagami, Y., Kurumatani, N., & Saeki, K. (2018) · Sleep Medicine · doi:10.1016/j.sleep.2018.10.027 · Cited by 16
Shiri, R., Hakola, T., Härmä, M., & Ropponen, A. (2021) · Scandinavian Journal of Work Environment & Health · doi:10.5271/sjweh.3952 · Cited by 15
“Night shift work can reduce sleep duration and sleep quality (31) and can cause mild depressive symptoms (2), which lead to a higher rate of SA.”
BackgroundShift Work Adaptation Among Police Officers: The BCOPS Study
Nevels, T. L., Burch, J. B., Wirth, M. D., Ginsberg, J., McLain, A. C., Andrew, M. E., Allison, P., Fekedulegn, D. B., & Violanti, J. M. (2021) · Chronobiology International · doi:10.1080/07420528.2021.1895824 · Cited by 17
“…sleep flexibility, positive affect, beneficial family and social relationships, low work demands, and certain genetic traits (Arendt 2010; Boudreau et al. 2013; Burch et al. 2009; Drake et al. 2015; Gamble et al. 2011; Lammers-van Der Holst and Kerkhof 2014; Natvik et al. 2011; Reinberg…”
BackgroundPotential Interactions Between Cerebellar Dysfunction and Sleep Disturbances in Dystonia
Leon, L. E. S., & Sillitoe, R. V. (2022) · Dystonia · doi:10.3389/dyst.2022.10691 · Cited by 16
“Shift work is well-known to cause significant circadian misalignment and subsequent comorbidities ranging from mood and social disorders (72, 73), to compromised immune function (74, 75) or cardiovascular disease (72, 76, 77).”
BackgroundSahni, J., Czanner, G., Guţu, T., Taylor, S., Bennett, K. M., Wuerger, S. M., Grierson, I., Murray‐Dunning, C., Holland, M., & Harding, S. P. (2016) · Eye · doi:10.1038/eye.2016.259 · Cited by 15
Work and Health Correlates of Sleep Quantity and Quality Among Correctional Nurses
Zhang, Y., Ghaziri, M. E., Dugan, A. G., & Castro, M. E. (2019) · Journal of Forensic Nursing · doi:10.1097/jfn.0000000000000229 · Cited by 15
Different levels of circadian (de)synchrony – where does it hurt?
Galinde, A. A., Al‐Μughales, F., Oster, H., & Heyde, I. (2022) · F1000Research · doi:10.12688/f1000research.127234.2 · Cited by 13
Circadian Adaptation of Melatonin and Cortisol in Police Officers Working Rotating Shifts
Kosmadopoulos, A., Boudreau, P., Kervezee, L., & Boivin, D. B. (2023) · Journal of Biological Rhythms · doi:10.1177/07487304231196280 · Cited by 13
“For most individuals, the circadian pacemaker is not able to quickly adapt to the new behavioral cycle, thus forcing rhythmic physiological functions to operate at sub-optimal phases (Boivin and James, 2002a; Boudreau et al., 2013; Archer et al., 2014; Resuehr et al., 2019).”
BackgroundResultInfluentialSelf-citationCircadian adaptation to night shift work is associated with higher REM sleep duration
Zimberg, I. Z., Ftouni, S., Magee, M., Ferguson, S. A., Lockley, S. W., Rajaratnam, S. M. W., & Sletten, T. L. (2023) · Sleep Health · doi:10.1016/j.sleh.2023.08.024 · Cited by 13
Disrupted sleep in dystonia depends on cerebellar function but not motor symptoms in mice
Leon, L. E. S., & Sillitoe, R. V. (2023) · Dystonia · doi:10.3389/dyst.2023.11487 · Cited by 12
Jelmini, J. D., Ross, J. A., Whitehurst, L. N., & Heebner, N. R. (2023) · Journal of Occupational Health · doi:10.1002/1348-9585.12409 · Cited by 12
Sun, T.-K., Chu, L., & Hui, C. (2022) · International Journal of Environmental Research and Public Health · doi:10.3390/ijerph191710542 · Cited by 11
“proved that shift work causes sleep disorders that consequently negatively disturb the moods of HCW [26].”
BackgroundMartin, J. S., Laberge, L., Sasseville, A., Bérubé, M., Alain, S., Lavoie, J., Houle, J., & Hébert, M. (2021) · Chronobiology International · doi:10.1080/07420528.2021.1872592 · Cited by 11
“More particularly, evidence suggests that even a partial circadian adjustment to the sleep-wake schedule improves alertness and performance during the night shift and also daytime sleep after the night shift (Boudreau et al. 2013; Crowley et al. 2004; Czeisler et al. 1990; Sasseville and Hebert 2010; Smith and Eastman…”
BackgroundThe impact of duty hour limits on sleep quality of resident: a cross-sectional study
Jaradat, R., Lahlouh, A., Aldabbour, B., Saadeh, A., & Mustafa, M. (2022) · Oman Medical Journal · doi:10.5001/omj.2022.78 · Cited by 11
Shift schedules and circadian preferences: the association with sleep and mood
Ahn, J., Yeo, H., Lee, S., Hwang, Y., Jeon, S., & Kim, S. J. (2024) · Frontiers in Public Health · doi:10.3389/fpubh.2024.1283543 · Cited by 10
Panwar, A., Bagla, R. K., Mohan, M., & Bhandari, B. (2024) · Journal of Family Medicine and Primary Care · doi:10.4103/jfmpc.jfmpc_158_24 · Cited by 10
“[10] Sleep quality is assessed using the Pittsburgh Sleep Quality Index (PSQI), a self‑administered instrument comprising 19 items viz. sleep onset, quality, duration, latency, efficiency, sleep disturbances, sleep medication, and daytime insomnia.”
MethodLeon, L. E. S., Kim, L. H., & Sillitoe, R. V. (2024) · Neurotherapeutics · doi:10.1016/j.neurot.2024.e00467 · Cited by 10
Haque, M., & Adamu, Y. (2019) · Medeniyet Medical Journal · doi:10.5222/mmj.2019.54775 · Cited by 12
“Boudreau et al.25 2013 investigated the effects of circadian adaptation to night shiftwork on performance, alertness, sleep, mood, and cardiac autonomic responses in night shift workers (n=15).”
BackgroundThe association between chronotype profile and temporomandibular disorders among college students
Dan, R., Li, J., Zhao, K., Yang, Z., Dong, Y., Fan, P., Cheng, Q., Wang, J., & Xiong, X. (2024) · Oral Diseases · doi:10.1111/odi.14859 · Cited by 9
The effects of indoor ambient temperature at work on physiological adaptation in night shift nurses
Kim, J. H., & Song, Y. (2020) · Journal of Nursing Management · doi:10.1111/jonm.13052 · Cited by 8
Muzaini, K., Yasin, S. M., Ismail, Z., & Ishak, A. R. (2022) · Journal of Environmental and Public Health · doi:10.1155/2022/8567594 · Cited by 8
“*is initiative will assist workers’ bodies in physiologically adapting to changes [56, 57].”
BackgroundAkimova, E. T., Taiji, R., Ding, X., & Mills, M. C. (2023) · SLEEP · doi:10.1093/sleep/zsad023 · Cited by 8
“Individuals working night shifts typically experience a misalignment between endogenous circadian rhythms and their actual sleep-wake cycle [11].”
BackgroundHarding, B. N., Espinosa, A., Castaño‐Vinyals, G., Pozo, Ó. J., Skene, D. J., Bustamante, M., Mata, M., Aguilar, R., Dobaño, C., Wucher, V., et al. (2024) · Journal of Pineal Research · doi:10.1111/jpi.70017 · Cited by 8
Maternal shift work during pregnancy and cardiovascular health impacts on mother and offspring
Flores, R. C., Yaffe, R., Nhunzwi, M. M., Nguyen, H., & Rabinovich-Nikitin, I. (2025) · Journal of Molecular and Cellular Cardiology · doi:10.1016/j.yjmcc.2024.12.008 · Cited by 10
Kjørstad, K., Faaland, P. M., Sivertsen, B., Kallestad, H., Langsrud, K., Vethe, D., Vestergaard, C. L., Harris, A., Pallesen, S., Scott, J. L., et al. (2022) · BMC Nursing · doi:10.1186/s12912-022-00973-4 · Cited by 8
Multi-Scale Evaluation of Sleep Quality Based on Motion Signal from Unobtrusive Device
Coluzzi, D., Baselli, G., Bianchi, A. M., Guerrero-Mora, G., Kortelainen, J. M., Tenhunen, M. L., & Mendez, M. O. (2022) · Sensors · doi:10.3390/s22145295 · Cited by 7
“Unobtrusive technologies may be of unvaluable interest for the prevention of the well-known risks of occurrence of coronary heart and cardiovascular disease, and beyond that, psychomotor and mood problems [9,10,48].”
BackgroundResultVenesia, Z., & Widyanti, A. (2019) · Journal of Physics Conference Series · doi:10.1088/1742-6596/1175/1/012191 · Cited by 7
“According to Boudreau, adaptation to night shift work is difficult and unique and is associated with different health indices.”
ResultSoprovich, A., Bottorff, J. L., Wozniak, L., Oliffe, J. L., Seaton, C. L., Duncan, M. J., Caperchione, C. M., Ellehoj, E. R., & Johnson, S. T. (2021) · Behavioral Sleep Medicine · doi:10.1080/15402002.2021.1909594 · Cited by 7
“For example, employers could support employees’ sleep health by expanding existing health spending accounts to include sleep-related resources that aid sleep, such as weighted blankets (Ackerley et al., 2015) or blue lights and orange-tinted googles (Boudreau et al., 2013).”
BackgroundA nationally representative study of law enforcement shiftwork and health outcomes
Mumford, E. A., Maitra, P., Liu, W., & Taylor, B. G. (2021) · Journal of Occupational and Environmental Hygiene · doi:10.1080/15459624.2021.1876876 · Cited by 8
“…seen in other professions, police shiftwork is associated with errors, injury, and poorer performance (Rajaratnam et al. 2011; Waggoner et al. 2012; Boudreau et al. 2013; Violanti et al. 2013; Fekedulegn et al. 2017), physical health problems (Violanti et al. 2009; Rajaratnam et al. 2011; Demir et…”
BackgroundHornsby, J., Johnson, B. L., Meckley, D. P., Blackley, A., Peveler, W. W., Lowes, J. N., & Dawes, J. J. (2021) · International journal of exercise science · doi:10.70252/siec4628 · Cited by 6
“Previous research has reported significant relationships between shift work and fatigue, on-duty fatal and non-fatal injuries (36, 40, 42, 45), insomnia (11, 40, 46), short sleep duration (13, 24, 34), day time sleepiness (10, 46) and overall poor sleep quality in police officers working night shifts (4, 5, 9, 11, 12,…”
BackgroundCascino, N., Mélan, C., & Galy, É. (2016) · Le travail humain · doi:10.3917/th.792.0097 · Cited by 6
Ichiba, T., Gorlova, S., Nagashima, Y., Aitake, M., Hori, E., & Nishijo, H. (2018) · Sleep and Vigilance · doi:10.1007/s41782-018-0036-y · Cited by 5
Light in ecological settings: Entrainment, circadian disruption, and interventions
Fischer, D. R., & Hilditch, C. J. (2022) · Progress in brain research · doi:10.1016/bs.pbr.2022.04.001 · Cited by 5
Sleep Quality in Shift-Working Nurses: Subjective and Objective Evaluation
Dujmić, Ž., Mikšić, Š., Barać, I., Samardžić, J., Maršić, L., Samardžić, P., Gvozdanović, Z., Jelinčić, I., Bukvić, B. K., Barišić, M., et al. (2025) · International Journal of Environmental Research and Public Health · doi:10.3390/ijerph23010064 · Cited by 8
“These findings suggest that maladaptive coping strategies may exacerbate the negative health consequences of night shift schedules and highlight the importance of promoting healthier sleep–wake adjustment behaviors among nurses [14].”
Topics Important for the up-to-date Interior Lighting Professional
van Bommel, W. (2020) · Light & Engineering · doi:10.33383/2019-108 · Cited by 4
Joo, Y., Kim, S., Cho, H., Lee, S.-J., Bea, H.-R., & Jeon, S. (2015) · Sleep Medicine Research · doi:10.17241/smr.2015.6.2.66 · Cited by 5
Contreras, J. E., Lisse, T. S., Bouzidi, C., Cavanaugh, A. M., Matynia, A., & Rieger, S. (2019) · bioRxiv (Cold Spring Harbor Laboratory) · doi:10.1101/825257 · Cited by 4
Ding, X., Akimova, E. T., Zhao, B., & Mills, M. C. (2025) · Social Science & Medicine · doi:10.1016/j.socscimed.2025.118443 · Cited by 3
The association between shift work-related sleep complaints and shift work intolerance
Lee, H. J., Son, K., Bang, Y. R., Jeon, H. J., Lee, K., & Yoon, I. (2018) · Sleep and Biological Rhythms · doi:10.1007/s41105-018-0178-2 · Cited by 5
Skin Detection Based Intelligent Alarm Clock Using YCbCr Model
Imran, M., Shadab, M., Islam, M. M., & Haque, M. (2017) · Smart innovation, systems and technologies · doi:10.1007/978-3-319-63645-0_25 · Cited by 2
Implicação do Trabalho noturno na qualidade de vida
Faria, A. B., Geraldine, V. G. S., Júnior, S. A. D., da Silva, T. D., Saez, D. M., Santos, R. C., Duarte, G. G. D. M., & Soares, E. A. (2021) · Research Society and Development · doi:10.33448/rsd-v10i16.23687 · Cited by 2
Xiao, N., Xu, X., Ma, Z., Yu, X., Feng, Y., Li, B., Liu, Y., He, G., Fan, J., Li, B., et al. (2023) · Frontiers in Behavioral Neuroscience · doi:10.3389/fnbeh.2022.867650 · Cited by 2
“For example, the circadian rhythm adaptation in the night shift worker affects their psychomotor performance, sleep quality, and subjective alertness (Boudreau et al., 2013).”
BackgroundKim, H. W., Kim, J.-H., Lee, G., Lee, H.-L., Lee, H., & Kim, S. (2024) · Epidemiology and Health · doi:10.4178/epih.e2024079 · Cited by 2
“For example, Boudreau et al. [31] suggest that circadian entrainment may be possible for individuals exposed to 1 week of fixed night shift work, as evidenced by peak melatonin levels during daytime sleep.”
Shift Work in Law Enforcement: Mental and Physical Outcomes
Violanti, J. M. (2021) · Springer eBooks · doi:10.1007/978-3-030-83974-1_7 · Cited by 2
Work and Health Correlates of Sleep Quantity and Quality among Correctional Nurses
Zhang, Y., El Ghaziri, M., Dugan, A. G., & Castro, M. E. (2019) · Journal of Forensic Nursing · doi:10.1097/jfn.0000000000000233 · Cited by 2
ŻOŁNIEREK, M., SIEKIERKO, N., Lubczyńska, Z., ŚWIĘTOCHOWSKI, J., Lewandowski, M. M., KOTUSIEWICZ, W., POPRAVKO, Y., & Bienia, G. (2023) · Journal of Education Health and Sport · doi:10.12775/jehs.2023.15.01.001 · Cited by 2
Work Characteristics and Psychosomatic Health Complaints of Private Security Personnel
Herrmann, A., & Glaser, J. (2021) · Zeitschrift für Arbeits- und Organisationspsychologie A&O · doi:10.1026/0932-4089/a000351 · Cited by 2
Harnessing Chronobiology for a Healthier and More Productive Workforce
Kalra, Y., & Kour, P. (2025) · IGI Global eBooks · doi:10.4018/979-8-3373-2210-0.ch011 · Cited by 1
Understanding Algorithmic Management in the Traditional Work Context: A Quantitative Analysis
Schmid, A. L., & Wiesche, M. (2026) · Lecture notes in information systems and organisation · doi:10.1007/978-3-032-08483-5_20 · Cited by 2
Occupational stress and heart rate variability
Rauber, M., Bilban, M., & Starc, R. (2015) · DOAJ (DOAJ: Directory of Open Access Journals) · Cited by 1
Shift Work, Light, Sleep and Performance
van Bommel, W. (2019) · Springer eBooks · doi:10.1007/978-3-030-17195-7_7 · Cited by 1
Metadata
- Authors
- Boudreau, P., Dumont, G. A., & Boivin, D. B.
- Affiliations
- Douglas Mental Health University Institute (CA)
- University of British Columbia (CA)
- Corresponding author
- Boivin, Diane B.
- Venue
- PLoS ONE
- Publisher
- Public Library of Science (PLoS)
- Published
- 2013-07-26
- Volume
- 8
- Issue
- 7
- Pages
- e70813
- ISSN
- 1932-6203 (ISSN-L)
- PMC
- PMC3724779
- OpenAlex
- W2094064988
- Cited by
- 128
- References
- 111
- Citations by year
- 2026: 5 · 2025: 10 · 2024: 9 · 2023: 12 · 2022: 13 · 2021: 13 · 2020: 8 · 2019: 17 · 2018: 15 · 2017: 6 · 2016: 9 · 2015: 6 · 2014: 5
- FWCI
- 9.01
- Type
- journal article
- Language
- en
- Open access
- gold
- doi.org
- Locations
- PLoS ONE (publishedVersion, cc-by)
- Europe PMC (PubMed Central) (publishedVersion, cc-by)
- PubMed Central (publishedVersion, cc-by)
- PubMed (publishedVersion)
- DOAJ (DOAJ: Directory of Open Access Journals) (submittedVersion)
- Figshare (submittedVersion, cc-by)
- PhareSST (submittedVersion)
- Funders
- Servier
- Topics
- Social Sciences › Psychology › Experimental and Cognitive Psychology › Sleep and Work-Related Fatigue
- Life Sciences › Neuroscience › Endocrine and Autonomic Systems › Circadian rhythm and melatonin
- Social Sciences › Psychology › Experimental and Cognitive Psychology › Sleep and related disorders
- Keywords
- circadian adaptation, night shift work, rotating shifts, melatonin, heart rate variability, sleep quality, sleep latency, psychomotor performance, subjective alertness, mood, sympathetic dominance, circadian misalignment, police officers
- MeSH terms
- Adaptation, Physiological, Adult, Affect, Circadian Rhythm, Darkness, Female, Heart Rate, Humans, Male, Melatonin, Psychomotor Performance, Sleep, Wakefulness, Work Schedule Tolerance
About these checks
Registry, retraction, Cites and statistics results are computed, not judged, with one exception: a printed reference that no index lists is read once by a model before it counts as a citation error. Claims are extracted by a model and kept only when their quote appears verbatim in the text; each cited source is then checked, with a model’s help, for whether it says what the claim relies on. Those verdicts can be wrong — read the claim’s quote and the cited source before relying on one.
Statistics and arithmetic are recomputed, not judged.
Confidence bands are shown only for fields calibrated on our annotated test set. None is calibrated yet, so no band is shown.
What counts as a claim ›How we measure confidence ›How we check this ›
Are you an author, or do you see a problem with this page? Request a review
