

The DOI matches its Crossref record; 42 of the 42 references it cites were found in a registry or an index.
Application of Concave Microwells to Pancreatic Tumor Spheroids Enabling Anticancer Drug Evaluation in a Clinically Relevant Drug Resistance Model
Open accessAbstract
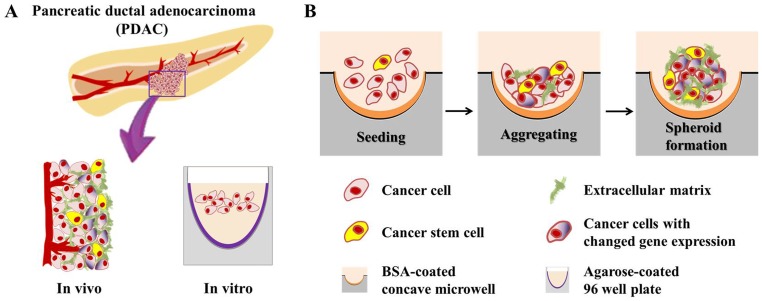
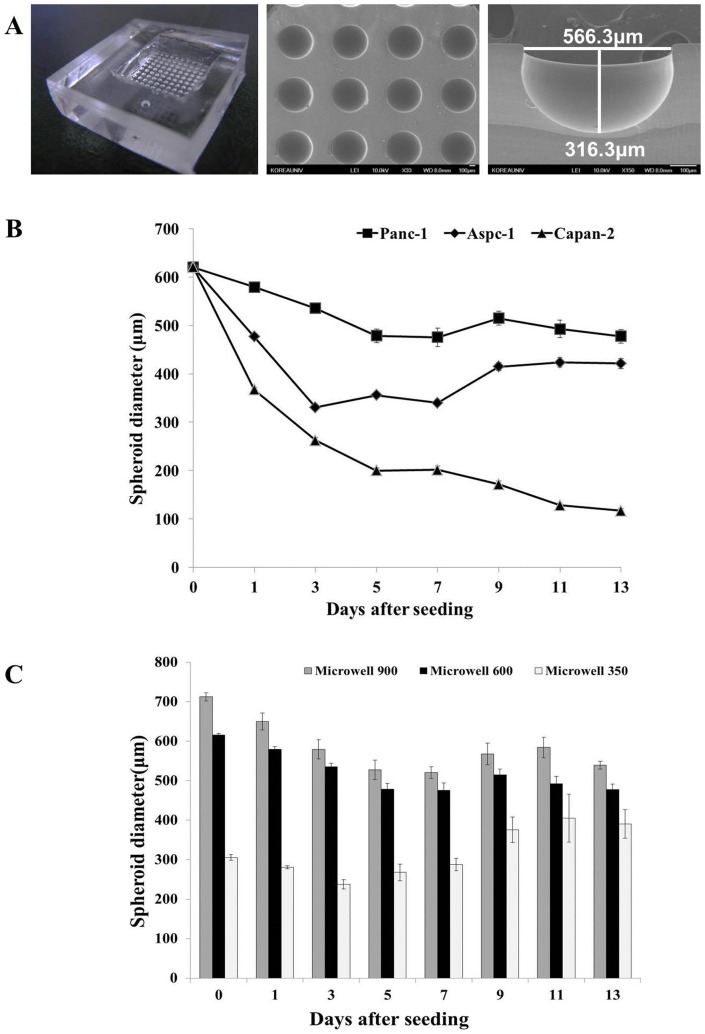
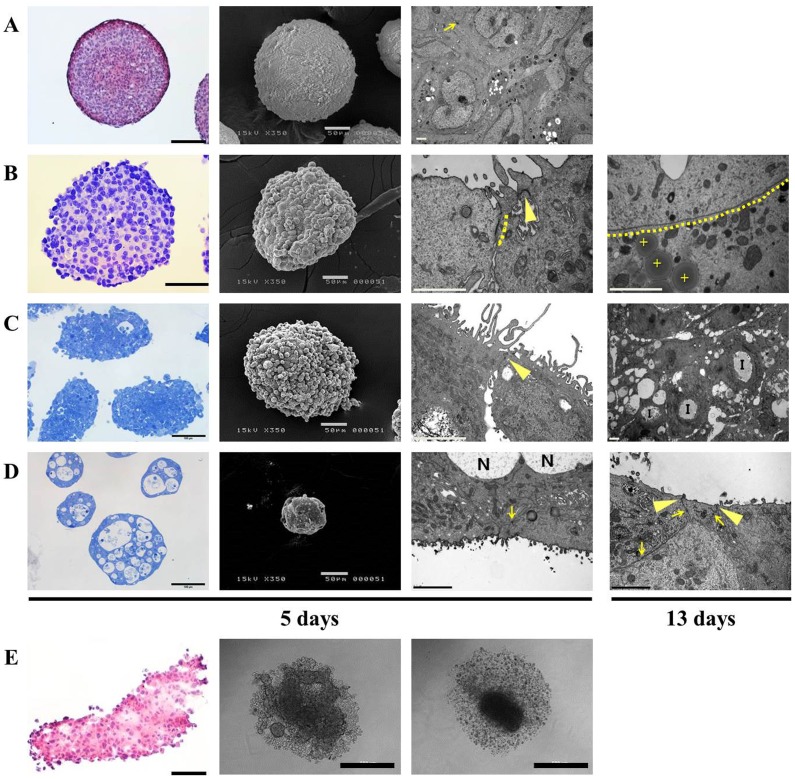
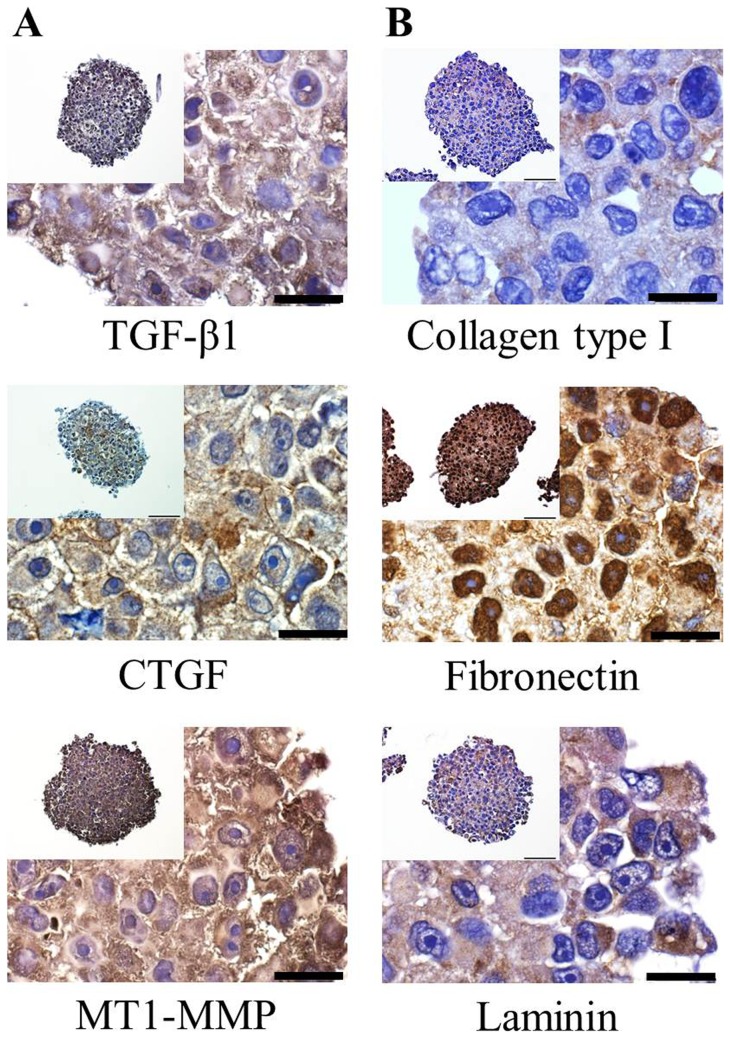
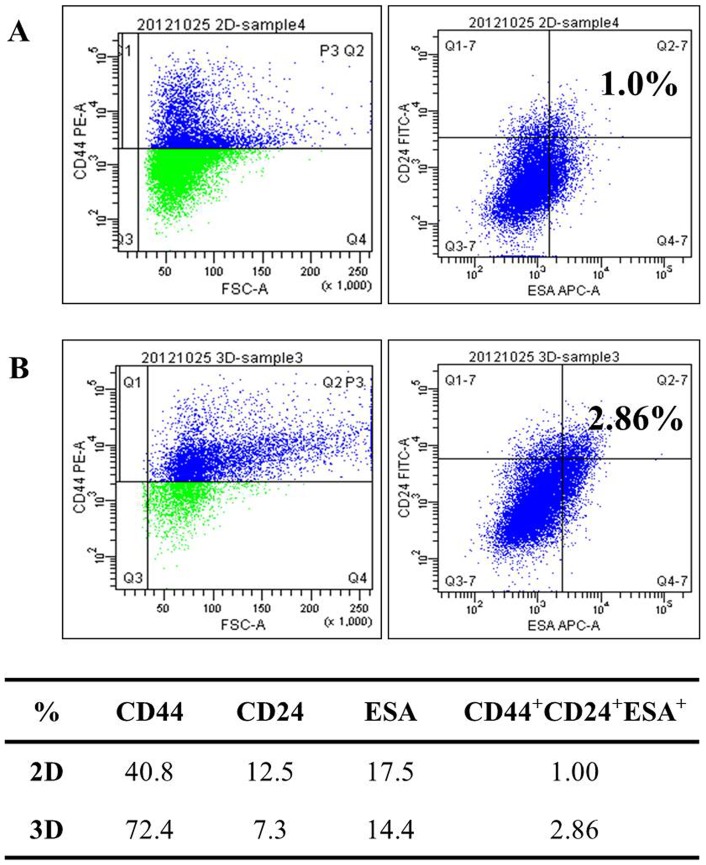
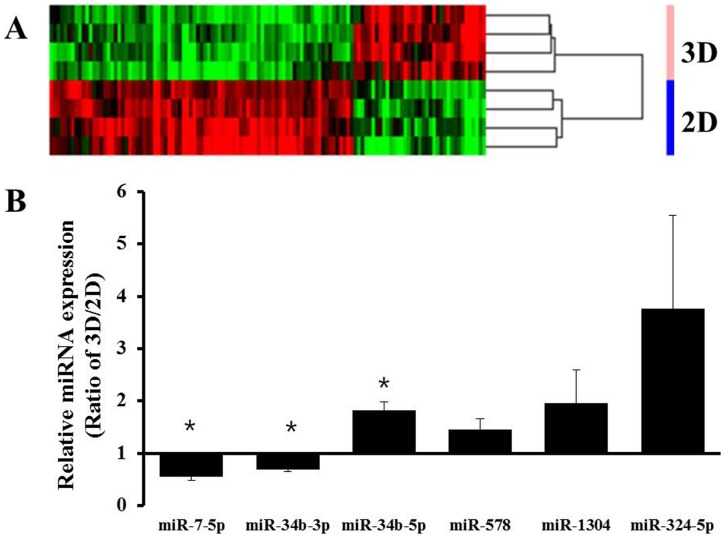
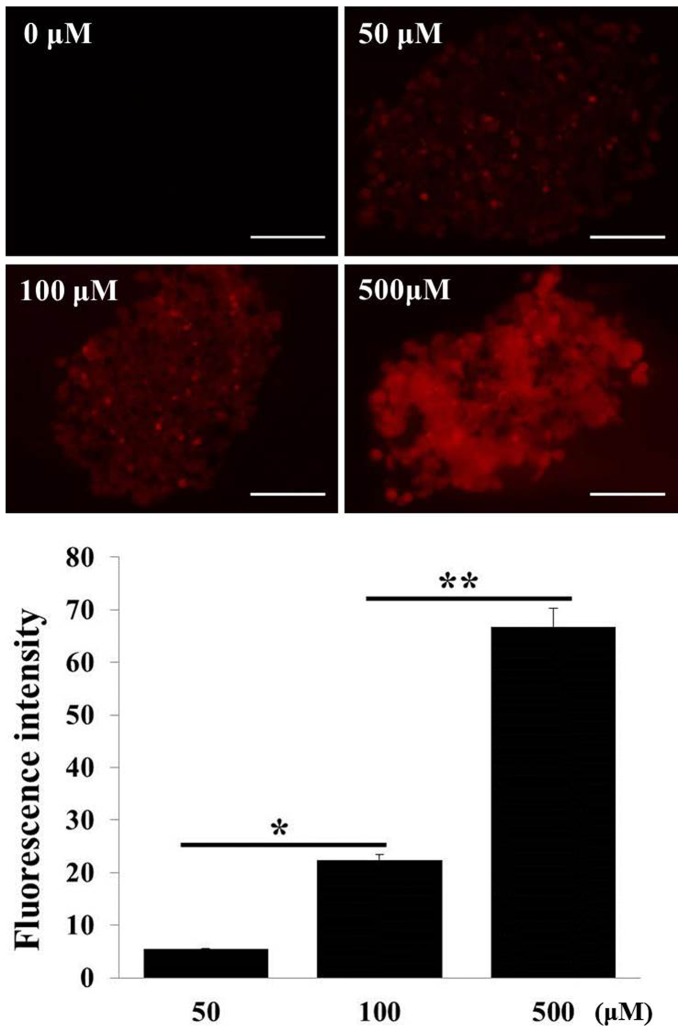
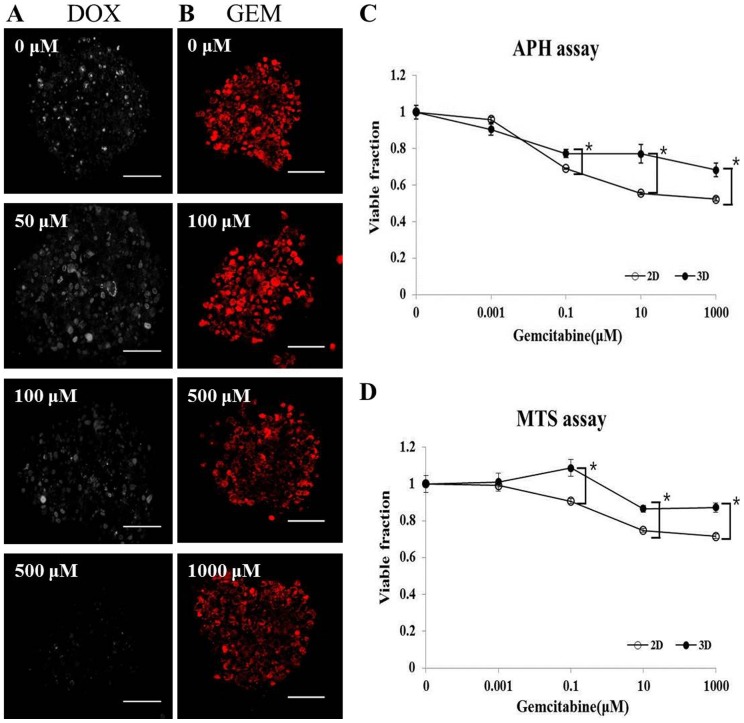
Intrinsic drug resistance of pancreatic ductal adenocarcinoma (PDAC) warrants studies using models that are more clinically relevant for identifying novel resistance mechanisms as well as for drug development. Tumor spheroids (TS) mimic in vivo tumor conditions associated with multicellular resistance and represent a promising model for efficient drug screening, however, pancreatic cancer cells often fail to form spheroids using conventional methods such as liquid overlay. This study describes the induction of TS of human pancreatic cancer cells (Panc-1, Aspc-1, Capan-2) in concave polydimethylsiloxane (PDMS) microwell plates and evaluation of their usefulness as an anticancer efficacy test model. All three cell lines showed TS formation with varying degree of necrosis inside TS. Among these, Panc-1 spheroid with spherical morphology, a rather rough surface, and unique adhesion structures were successfully produced with no notable necrosis in concave microwell plates. Panc-1 TS contained growth factors or enzymes such as TGF-β1, CTGF, and MT1-MMP, and extracellular matrix proteins such as collagen type I, fibronectin, and laminin. Panc-1 cells grown as TS showed changes in stem cell populations and in expression levels of miRNAs that may play roles in chemoresistance. Visualization of drug penetration and detection of viability indicators, such as Ki-67 and MitoSOX, were optimized for TS for quantitative analysis. Water-soluble tetrazolium (MTS) and acid phosphatase (APH) assays were also successfully optimized. Overall, we demonstrated that concave PDMS microwell plates are a novel platform for preparation of TS of weakly aggregating cells and that Panc-1 spheroids may represent a novel three-dimensional model for anti-pancreatic cancer drug screening.
Overview
The claims and statistics of this paper haven’t been checked yet.
Run the check — free, no account needed. It reads the open-access text and checks the sources it cites.
Integrity signals
Registry
Cites
Statistics
Figures
Verification
Claims the paper makes
The claims and statistics of this paper haven’t been checked yet.
Run the check — free, no account needed. It reads the open-access text and checks the sources it cites.
Claims other papers make about this one
Each is checked against this paper’s own text: does it say what the citing paper says it does?
The cited source says what the claim attributes to it.
In the citing paper
“Electron microscopy, including both scanning (SEM) and transmission (TEM) modalities, provides ultra-high-resolution imaging and remains a valuable tool for evaluating cellular morphology, surface topology, and intercellular organization across spheroid layers [245,256].”
From Modeling Tumor Microenvironment Complexity In Vitro: Spheroids as Physiologically Relevant Tumor Models and Strategies for Their Analysis (2025) · cites this paper as [245]
Self-check
Percentages, sums and reported differences re-computed from the paper’s own numbers.
The self-check needs the paper’s full text.
Citations
Cites
Identification of Pancreatic Cancer Stem Cells
Li, C., Heidt, D. G., Dalerba, P. D., Burant, C., Zhang, L., Adsay, V. N., Wicha, M. S., Clarke, M. F., & Simeone, D. M. (2007) · Cancer Research · doi:10.1158/0008-5472.can-06-2030 · Cited by 3,419
Drug penetration in solid tumours
Minchinton, A. I., & Tannock, I. F. (2006) · Nature reviews. Cancer · doi:10.1038/nrc1893 · Cited by 2,805
Spheroid-based drug screen: Considerations and practical approach
Friedrich, J., Seidel, C., Ebner, R., & Kunz-Schughart, L. A. (2009) · Nature Protocols · doi:10.1038/nprot.2008.226 · Cited by 1,742
The Pancreas Cancer Microenvironment
Feig, C., Gopinathan, A., Neesse, A., Chan, D. S., Cook, N., & Tuveson, D. A. (2012) · Clinical Cancer Research · doi:10.1158/1078-0432.ccr-11-3114 · Cited by 1,316
Recent advances in three‐dimensional multicellular spheroid culture for biomedical research
Lin, R., & Chang, H. (2008) · Biotechnology Journal · doi:10.1002/biot.200700228 · Cited by 1,264
Environment-mediated drug resistance: A major contributor to minimal residual disease
Meads, M. B., Gatenby, R. A., & Dalton, W. S. (2009) · Nature Reviews Cancer · doi:10.1038/nrc2714 · Cited by 892
MicroRNA miR-34 Inhibits Human Pancreatic Cancer Tumor-Initiating Cells
Ji, Q., Hao, X., Zhang, M., Tang, W., Yang, M., Li, L., Xiang, D., DeSano, J. T., Bommer, G. T., Fan, D., et al. (2009) · PLoS ONE · doi:10.1371/journal.pone.0006816 · Cited by 699
Microfluidic scaffolds for tissue engineering
Choi, N., Cabodi, M., Held, B., Gleghorn, J. P., Bonassar, L. J., & Stroock, A. D. (2007) · Nature Materials · doi:10.1038/nmat2022 · Cited by 618
Advances in the formation, use and understanding of multi-cellular spheroids
Achilli, T.-M., Meyer, J., & Morgan, J. R. (2012) · Expert Opinion on Biological Therapy · doi:10.1517/14712598.2012.707181 · Cited by 600
Experimental anti-tumor therapy in 3-D: Spheroids – old hat or new challenge?
Friedrich, J., Ebner, R., & Kunz‐Schughart, L. A. (2007) · International Journal of Radiation Biology · doi:10.1080/09553000701727531 · Cited by 460
Cited by
Sorted by citations
Items 101–110 of 110
Barrow, C. W. (2004) · Revista de la Educación Superior
Reinhart‐King, C. A. (2020) · Faculty Opinions – Post-Publication Peer Review of the Biomedical Literature · doi:10.3410/f.735972016.793581380
Karshieva, S. S., Demidova, E. A., Spirina, T. S., Babayeva, G. A., Bondarev, N. A., Bazhenov, S. V., Манухов, И. В., & Pokrovsky, V. S. (2024) · Russian Journal of Oncology · doi:10.17816/onco640835
Morphological Analysis of US Treated PANC-1 Spheroids
Ricci, M., Dimitri, M., Serio, M., & Corvi, A. (2025) · Applied Sciences · doi:10.3390/app15041707
Li, Y., Peytral-Rieu, O., Dubuc, D., & Grenier, K. M. (2025) · European Microwave Conference (EuMC) · doi:10.23919/eumc65286.2025.11235155
Etude des propriétés mécaniques intrinsèques d’un modèle de microtumeur in vitro
Guillaume, L. (2017) · theses.fr (ABES) · doi:10.70675/98eaf292zbc52z4451z8a14z84364523ff6b
Goodarzi, S. (2021) · theses.fr (ABES) · doi:10.70675/b0a0d503z93b4z464bz93d6z36d6613fb371
Goisnard, A. (2021) · theses.fr (ABES) · doi:10.70675/efb6e253zbfeaz431aza15czc11449d801f3
High-density microwell arrays enable controlled pseudoislet engineering for diabetes cell therapy
Rosenberger, C., Heller, C., Basiewicz, T. M., Lehmann, S., Sarangova, V., Abdelgawad, H., Schubert, U., Schmid, J., Werner, C., Bornstein, S. R., et al. (2026) · Biomedical Materials · doi:10.1088/1748-605x/ae88a4
Metadata
- Authors
- Yeon, S.-E., No, D. Y., Lee, S.-H., Nam, S. W., Oh, I.-H., Lee, J., & Kuh, H.-J.
- Affiliations
- Catholic University of Korea (KR)
- Korea University (KR)
- Chung-Ang University (KR)
- Corresponding author
- Kuh, Hyo-Jeong
- Venue
- PLoS ONE
- Publisher
- Public Library of Science (PLoS)
- Published
- 2013-09-10
- Volume
- 8
- Issue
- 9
- Pages
- e73345
- ISSN
- 1932-6203 (ISSN-L)
- PMC
- PMC3769301
- OpenAlex
- W2025183054
- Cited by
- 110
- References
- 42
- Citations by year
- 2026: 1 · 2025: 6 · 2024: 6 · 2023: 4 · 2022: 4 · 2021: 12 · 2020: 14 · 2019: 12 · 2018: 11 · 2017: 13 · 2016: 11 · 2015: 9 · 2014: 6
- FWCI
- 4.79
- Type
- journal article
- Language
- en
- Open access
- gold
- doi.org
- Locations
- PLoS ONE (publishedVersion, cc-by)
- Europe PMC (PubMed Central) (publishedVersion, other-oa)
- PubMed Central (publishedVersion, cc-by)
- PubMed (publishedVersion)
- DOAJ (DOAJ: Directory of Open Access Journals) (submittedVersion, cc-by-sa)
- Funders
- National Research Foundation
- National Research Foundation of Korea (2012R1A5A2047939, 2012R1A2A2A01003361)
- Topics
- Physical Sciences › Engineering › Biomedical Engineering › 3D Printing in Biomedical Research
- Health Sciences › Medicine › Oncology › Cancer Cells and Metastasis
- Life Sciences › Biochemistry, Genetics and Molecular Biology › Cell Biology › Cellular Mechanics and Interactions
- Keywords
- pancreatic ductal adenocarcinoma, drug resistance, anticancer drug screening, PANC-1 cells, 3D tumor models, extracellular matrix, chemoresistance, drug penetration, necrosis, stem cell populations, microRNA expression, MTS assay
- MeSH terms
- Antinematodal Agents, Drug Screening Assays, Antitumor, Equipment Design, Humans, Pancreatic Neoplasms, Spheroids, Cellular, Cell Line, Tumor
About these checks
Registry, retraction, Cites and statistics results are computed, not judged, with one exception: a printed reference that no index lists is read once by a model before it counts as a citation error. Claims are extracted by a model and kept only when their quote appears verbatim in the text; each cited source is then checked, with a model’s help, for whether it says what the claim relies on. Those verdicts can be wrong — read the claim’s quote and the cited source before relying on one.
Statistics and arithmetic are recomputed, not judged.
Confidence bands are shown only for fields calibrated on our annotated test set. None is calibrated yet, so no band is shown.
What counts as a claim ›How we measure confidence ›How we check this ›
Are you an author, or do you see a problem with this page? Request a review
