

The DOI matches its Crossref record; 31 of the 31 references it cites were found in a registry or an index.
Quantitative Proteomic Analysis of Gingival Crevicular Fluid in Different Periodontal Conditions
Open accessAbstract
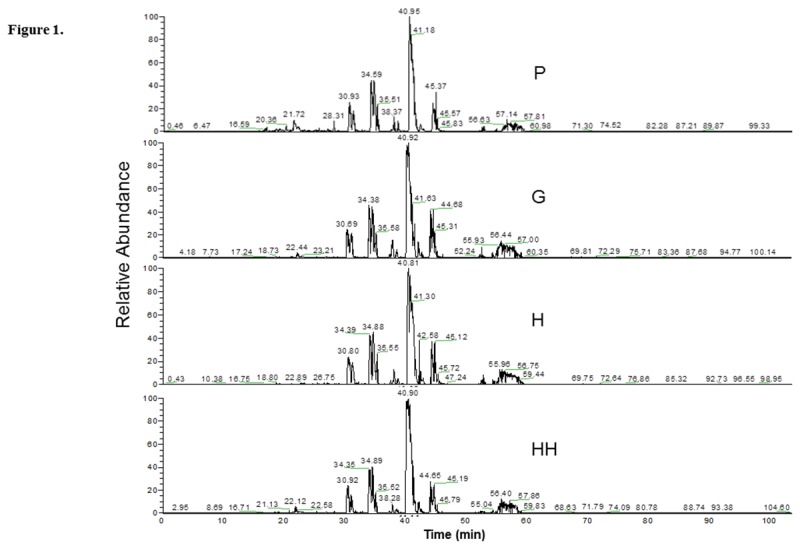
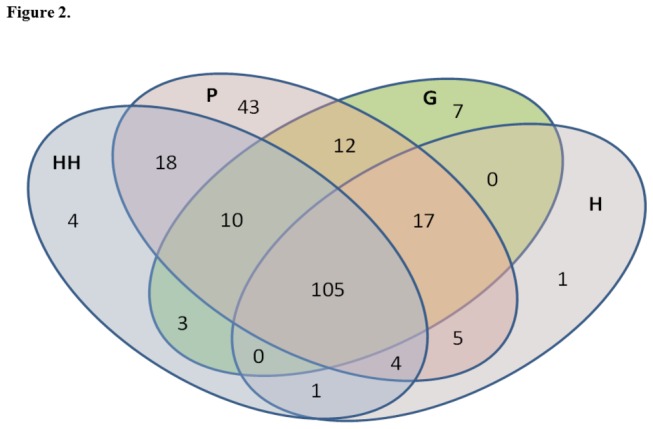
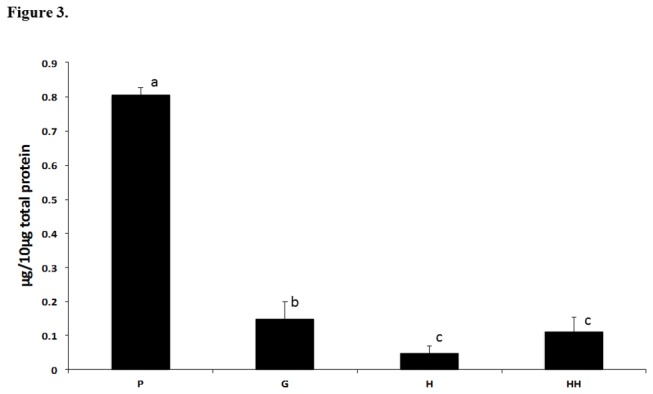
AIM: To quantify the proteome composition of the GCF in periodontal health (HH) and in sites with different clinical conditions in chronic periodontitis (CP) subjects. MATERIAL AND METHODS: 5 subjects with HH and 5 with CP were submitted to full-mouth periodontal examination, and GCF sampling. Sites in the CP group were classified and sampled as periodontitis (P, probing depth, PD>4 mm), gingivitis (G, PD≤3 mm with bleeding on probing, BOP), and healthy sites (H, PD≤3 mm without BOP). GCF proteins were subjected to liquid chromatography electrospray ionization mass spectrometry for identification, characterization and quantification. RESULTS: 230 proteins were identified; 145 proteins were detected in HH, 214 in P, 154 in G, and 133 in H. Four proteins were exclusively detected at HH, 43 proteins at P, 7 proteins at G, and 1 protein at H. Compared to HH group, 35 and 6 proteins were more abundant in P and G (p<0.001), respectively; and 4, 15 and 37 proteins were less abundant in P, G and H (p≤0.01), respectively. CONCLUSIONS: There are marked differences in the GCF proteome according to disease profile. Comprehension of the role of the identified proteins in the etiopathogenesis of periodontal disease may lead to biomarkers definition.
Overview
The claims and statistics of this paper haven’t been checked yet.
Run the check — free, no account needed. It reads the open-access text and checks the sources it cites.
Integrity signals
Registry
Cites
Statistics
Figures
Verification
Claims the paper makes
The claims and statistics of this paper haven’t been checked yet.
Run the check — free, no account needed. It reads the open-access text and checks the sources it cites.
Claims other papers make about this one
Each is checked against this paper’s own text: does it say what the citing paper says it does?
In the citing paper
“Culture‐independent methods have improved our understanding of microbial diversity in the oral cavity.”
From The oral microbiome: Role of key organisms and complex networks in oral health and disease (2021) · cites this paper as [70]
In the citing paper
“Proteomic applications have been applied to understand changes in the proteome that diverge states of periodontal health from disease and to further characterize various periodontal disease states, including gingivitis, mild, moderate, chronic, and aggressive periodontitis.70, 101, 102, 103, 104”
From The oral microbiome: Role of key organisms and complex networks in oral health and disease (2021) · cites this paper as [70]
Self-check
Percentages, sums and reported differences re-computed from the paper’s own numbers.
The self-check needs the paper’s full text.
Citations
Cites
Neutrophil Extracellular Traps Kill Bacteria
Brinkmann, V., Reichard, U., Goosmann, C., Fauler, B., Uhlemann, Y., Weiss, D. S., Weinrauch, Y., & Zychlinsky, A. (2004) · Science · doi:10.1126/science.1092385 · Cited by 10,268
Development of a Classification System for Periodontal Diseases and Conditions
Armitage, G. C. (1999) · Annals of Periodontology · doi:10.1902/annals.1999.4.1.1 · Cited by 5,110
Phases of Biomarker Development for Early Detection of Cancer
Pepe, M. S., Etzioni, R., Feng, Z., Potter, J. D., Thompson, M. L., Thornquist, M., Winget, M., & Yasui, Y. (2001) · JNCI Journal of the National Cancer Institute · doi:10.1093/jnci/93.14.1054 · Cited by 1,686
Risk factors for periodontal disease
Genco, R. J., & Borgnakke, W. S. (2013) · Periodontology 2000 · doi:10.1111/j.1600-0757.2012.00457.x · Cited by 1,307
The Bacterial Etiology of Destructive Periodontal Disease: Current Concepts
Socransky, S. S., & Haffajee, A. D. (1992) · Journal of Periodontology · doi:10.1902/jop.1992.63.4s.322 · Cited by 1,203
Periodontal diagnoses and classification of periodontal diseases
Armitage, G. C. (2004) · Periodontology 2000 · doi:10.1046/j.0906-6713.2002.003421.x · Cited by 779
"Checkerboard" DNA-DNA hybridization.
Socransky, S. S., Smith, C., Martin, L., Paster, B. J., Dewhirst, F. E., & Levin, A. E. (1994) · PubMed · Cited by 725
Quantitative analysis of peptides and proteins in biomedicine by targeted mass spectrometry
Gillette, M. A., & Carr, S. A. (2012) · Nature Methods · doi:10.1038/nmeth.2309 · Cited by 504
Tonetti, M. S., & Mombelli, A. (1999) · Annals of Periodontology · doi:10.1902/annals.1999.4.1.39 · Cited by 318
Epithelial Antimicrobial Peptides: Review and Significance for Oral Applications
Weinberg, A., Krisanaprakornkit, S., & Dale, B. A. (1998) · Critical Reviews in Oral Biology & Medicine · doi:10.1177/10454411980090040201 · Cited by 251
Research works printed but not linked: 1
- WL Siqueira, 2012, Quantitative proteomic analysis of the effect of fluoride on the acquired enamel pellicle, PLOS ONE, 7, e42204, 10.1371/journal.pone.0042204 · DOI
Cited by
Sorted by citations
The oral microbiome: Role of key organisms and complex networks in oral health and disease
Sedghi, L., DiMassa, V., Harrington, A., Lynch, S. V., & Kapila, Y. L. (2021) · Periodontology 2000 · doi:10.1111/prd.12393 · Cited by 755
Coronavirus COVID-19 impacts to dentistry and potential salivary diagnosis
Silva, R. S., Jardim, A. C. G., & Siqueira, W. L. (2020) · Clinical Oral Investigations · doi:10.1007/s00784-020-03248-x · Cited by 694
Self-citationGingival crevicular fluid as a source of biomarkers for periodontitis
Barros, S. P., Williams, R. C., Offenbacher, S., & Morelli, T. (2015) · Periodontology 2000 · doi:10.1111/prd.12107 · Cited by 475
Saliva as a Candidate for COVID-19 Diagnostic Testing: A Meta-Analysis
Czumbel, L. M., Kiss, S., Farkas, N., Mandel, I., Hegyi, A., Nagy, Á., Lohinai, Z. M., Szakács, Z., Hegyi, P. J., Steward, M. C., et al. (2020) · Frontiers in Medicine · doi:10.3389/fmed.2020.00465 · Cited by 230
Ghallab, N. A. (2018) · Archives of Oral Biology · doi:10.1016/j.archoralbio.2017.12.022 · Cited by 174
Human Gingival Crevicular Fluids (GCF) Proteomics: An Overview
Khurshid, Z., Mali, M., Naseem, M., Najeeb, S., & Zafar, M. S. (2017) · Dentistry Journal · doi:10.3390/dj5010012 · Cited by 115
Gingival crevicular fluid and its immune mediators in the proteomic era
Bostanci, N., & Belibasakis, G. N. (2018) · Periodontology 2000 · doi:10.1111/prd.12154 · Cited by 109
Advances of Proteomic Sciences in Dentistry
Khurshid, Z., Zohaib, S., Najeeb, S., Zafar, M. S., Rehman, R., & Rehman, I. U. (2016) · International Journal of Molecular Sciences · doi:10.3390/ijms17050728 · Cited by 74
Biomaterial surface proteomic signature determines interaction with epithelial cells
Abdallah, M., Tran, S. D., Abughanam, G., Laurenti, M., Zuanazzi, D., Mezour, M. A., Xiao, Y., Cerruti, M., Siqueira, W. L., & Tamimi, F. (2017) · Acta Biomaterialia · doi:10.1016/j.actbio.2017.02.044 · Cited by 74
Self-citationBaima, G., Corana, M., Iaderosa, G., Romano, F., Citterio, F., Meoni, G., Tenori, L., & Aimetti, M. (2021) · Journal of Periodontal Research · doi:10.1111/jre.12872 · Cited by 71
Gingival crevicular fluid proteomes in health, gingivitis and chronic periodontitis
Huynh, A. H. S., Veith, P. D., McGregor, N., Adams, G. G., Chen, D., Reynolds, E. C., Ngo, L., & Darby, I. B. (2014) · Journal of Periodontal Research · doi:10.1111/jre.12244 · Cited by 69
Ferrer, M. D., López-López, A., Nicolescu, T., Perez-Vilaplana, S., Boix-Amorós, A., Dzidic, M., Garcia, S., Artacho, A., Llena, C., & Mira, Á. (2020) · Frontiers in Cellular and Infection Microbiology · doi:10.3389/fcimb.2020.00465 · Cited by 77
Tsuchida, S., Satoh, M., Takiwaki, M., & Nomura, F. (2018) · International Journal of Molecular Sciences · doi:10.3390/ijms20010086 · Cited by 55
Proteomic analysis of whole saliva in chronic periodontitis
Hartenbach, F. A. R. R., Velásquez, E., Nogueira, F. C. S., Domont, G. B., Ferreira, E. D. O., & Colombo, A. P. V. (2019) · Journal of Proteomics · doi:10.1016/j.jprot.2019.103602 · Cited by 57
Self-citationKhiabani, K. S., & Amirzade-Iranaq, M. H. (2021) · American Journal of Infection Control · doi:10.1016/j.ajic.2021.03.008 · Cited by 53
Utility of gingival crevicular fluid components for periodontal diagnosis
Buduneli, N., Bıyıkoğlu, B., & Kinane, D. F. (2024) · Periodontology 2000 · doi:10.1111/prd.12595 · Cited by 62
Host‐microbe interactions: Profiles in the transcriptome, the proteome, and the metabolome
Nguyen, T., Sedghi, L., Ganther, S., Malone, E., Kamarajan, P., & Kapila, Y. L. (2020) · Periodontology 2000 · doi:10.1111/prd.12316 · Cited by 51
Metaproteome and metabolome of oral microbial communities
Bostancı, N., Grant, M. M., Bao, K., Silbereisen, A., Hetrodt, F., Manoil, D., & Belibasakis, G. N. (2020) · Periodontology 2000 · doi:10.1111/prd.12351 · Cited by 50
Mass spectrometry analysis of gingival crevicular fluid in the presence of external root resorption
Rody, W. J., Holliday, L. S., McHugh, K. P., Wallet, S. M., Spicer, V., & Krokhin, O. V. (2014) · American Journal of Orthodontics and Dentofacial Orthopedics · doi:10.1016/j.ajodo.2014.03.013 · Cited by 46
Next-Generation Examination, Diagnosis, and Personalized Medicine in Periodontal Disease
Kikuchi, T., Hayashi, J., & Mitani, A. (2022) · Journal of Personalized Medicine · doi:10.3390/jpm12101743 · Cited by 48
Metabolomic Analysis of Gingival Crevicular Fluid Using Gas Chromatography/Mass Spectrometry
Ozeki, M., Nozaki, T., Aoki, J., Bamba, T., Jensen, K. R., Murakami, S., & Toyoda, M. (2016) · Mass Spectrometry · doi:10.5702/massspectrometry.a0047 · Cited by 39
The complexity of oral physiology and its impact on salivary diagnostics
Helmerhorst, E. J., Dawes, C., & Oppenheim, F. G. (2017) · Oral Diseases · doi:10.1111/odi.12780 · Cited by 33
Role of Calprotectin as a Biomarker in Periodontal Disease
Wei, L., Liu, M., & Xiong, H. (2019) · Mediators of Inflammation · doi:10.1155/2019/3515026 · Cited by 35
Gingival Crevicular Fluid Peptidome Profiling in Healthy and in Periodontal Diseases
Preianò, M., Savino, R., Villella, C., Pelaia, C., & Terracciano, R. (2020) · International Journal of Molecular Sciences · doi:10.3390/ijms21155270 · Cited by 36
The diagnostic accuracy of saliva testing for SARS‐CoV‐2: A systematic review and meta‐analysis
Atieh, M. A., Guirguis, M., Alsabeeha, N. H. M., & Cannon, R. D. (2021) · Oral Diseases · doi:10.1111/odi.13934 · Cited by 33
Cembranelli, S. B. S., Souto, F. O., Paim, K. F., Richinho, T. T., Nunes, P. L., Nascentes, G. A. N., Ferreira, T. B., Correia, D., & Lages-Silva, E. (2013) · PLoS ONE · doi:10.1371/journal.pone.0082864 · Cited by 31
Proteomic profile of root canal contents in teeth with post‐treatment endodontic disease
Francisco, P. A., Delboni, M. G., Lima, A. R., Xiao, Y., Siqueira, W. L., & Gomes, B. P. F. D. A. (2018) · International Endodontic Journal · doi:10.1111/iej.13021 · Cited by 30
Self-citationProteomics approach for biomarkers and diagnosis of periodontitis: systematic review
Rizal, M. I., Soeroso, Y., Sulijaya, B., Assiddiq, B. F., Bachtiar, E. W., & Bachtiar, B. M. (2020) · Heliyon · doi:10.1016/j.heliyon.2020.e04022 · Cited by 31
Preianò, M., Maggisano, G., Lombardo, N., Montalcini, T., Paduano, S., Pelaia, G., Savino, R., & Terracciano, R. (2015) · PROTEOMICS · doi:10.1002/pmic.201500328 · Cited by 26
Ahmad, P., Escalante‐Herrera, A., Marin, L. M., & Siqueira, W. L. (2024) · Journal of Periodontal Research · doi:10.1111/jre.13313 · Cited by 30
Self-citationPark, J., Ko, K., Lee, J., Oh, J.-W., Lim, H., Lee, D., Choi, S., & Cha, J. (2021) · Nutrients · doi:10.3390/nu13082604 · Cited by 26
Tancharoen, S., Matsuyama, T., Kawahara, K.-I., Tanaka, K., Lee, L.-J., Machigashira, M., Noguchi, K., Ito, T., Imamura, T., Potempa, J., et al. (2015) · PLoS ONE · doi:10.1371/journal.pone.0117775 · Cited by 24
Aboodi, G. M., Sima, C., Moffa, E. B., Crosara, K. T. B., Xiao, Y., Siqueira, W. L., & Glogauer, M. (2016) · Frontiers in Cellular and Infection Microbiology · doi:10.3389/fcimb.2015.00092 · Cited by 24
Self-citationRakmanee, T., Calciolari, E., Olsen, I., Darbar, U. R., Griffiths, G. S., Petrie, A., & Donos, N. (2018) · Clinical Oral Investigations · doi:10.1007/s00784-018-2752-z · Cited by 22
Marinho, M. C., Pacheco, A. B. F., Costa, G., Ortiz, N. D., Zajdenverg, L., & Sansone, C. (2018) · Oral Diseases · doi:10.1111/odi.12996 · Cited by 21
Preianò, M., Falcone, D., Maggisano, G., Montalcini, T., Navarra, M., Paduano, S., Savino, R., & Terracciano, R. (2014) · Clinica Chimica Acta · doi:10.1016/j.cca.2014.07.022 · Cited by 21
Yuan, Z., Janmey, P. A., & McCulloch, C. A. (2025) · Cell Communication and Signaling · doi:10.1186/s12964-025-02194-z · Cited by 20
Quantitative proteomic analysis of gingival crevicular fluids from deciduous and permanent teeth
Moriya, Y., Obama, T., Aiuchi, T., Sugiyama, T., Endo, Y., Koide, Y., Noguchi, E., Ishizuka, M., Inoue, M., Itabe, H., et al. (2017) · Journal Of Clinical Periodontology · doi:10.1111/jcpe.12696 · Cited by 20
Label-free analysis of gingival crevicular fluid (GCF) by surface enhanced Raman scattering (SERS)
Fornasaro, S., Berton, F., Stacchi, C., Farina, F., Esposito, A., Sergo, V., Lenarda, R. D., & Bonifacio, A. (2020) · The Analyst · doi:10.1039/d0an01997f · Cited by 20
Dental Healthcare Amid the COVID-19 Pandemic
Butt, R. T., Janjua, O. S., Qureshi, S. M., Shaikh, M. S., Gironés, J. G., Rodríguez‐Lozano, F. J., & Zafar, M. S. (2021) · International Journal of Environmental Research and Public Health · doi:10.3390/ijerph182111008 · Cited by 20
Proteomic analysis of gingival crevicular fluid for novel biomarkers of pubertal growth peak
Xi, W., Franchi, L., Chen, F., & Gu, Y. (2017) · European Journal of Orthodontics · doi:10.1093/ejo/cjx082 · Cited by 19
Bellei, E., Bertoldi, C., Monari, E., & Bergamini, S. (2022) · Materials · doi:10.3390/ma15062161 · Cited by 18
Shindo, S., Pierrelus, R., Ikeda, A., Nakamura, S., Heidari, A., Pastore, M. R., Leon, E., Ruiz, S., Chheda, H., Khatiwala, R., et al. (2023) · Cells · doi:10.3390/cells12081109 · Cited by 17
Torres, A., Michea, M. A., Végvári, Á., Arce, M., Morales, A., Lanyon, E., Alcota, M., Fuentes, C., Vernal, R., Budini, M., et al. (2023) · Journal of Periodontal Research · doi:10.1111/jre.13169 · Cited by 18
Preianò, M., Maggisano, G., Murfuni, M. S., Villella, C., Pelaia, C., Montalcini, T., Lombardo, N., Pelaia, G., Savino, R., & Terracciano, R. (2018) · PROTEOMICS - CLINICAL APPLICATIONS · doi:10.1002/prca.201800005 · Cited by 16
Kim, J. S., Cho, I., Kim, K., & Hwang, Y. S. (2020) · Molecular Medicine Reports · doi:10.3892/mmr.2020.11762 · Cited by 15
Nasri, F. A. M., Ariffin, S. H. Z., Karsani, S. A., & Wahab, R. M. A. (2020) · BMC Oral Health · doi:10.1186/s12903-020-01246-9 · Cited by 14
Dipalma, G., Inchingolo, A. M., Inchingolo, F., Palumbo, I., Riccaldo, L., Guglielmo, M., Morolla, R., Palermo, A., Marinelli, G., & Inchingolo, A. D. (2025) · Journal of Personalized Medicine · doi:10.3390/jpm15090440 · Cited by 15
Santamaria, P., Jin, Y., Ghuman, M. S., Shoaie, S., Spratt, D. A., Troiano, G., & Nibali, L. (2024) · Journal Of Clinical Periodontology · doi:10.1111/jcpe.14034 · Cited by 13
Comparative proteomics of saliva of healthy and gingivitis individuals from Rio de Janeiro
da Silva, C. V. F., Sade, Y. B., Scapin, S. M. N., Silva‐Boghossian, C. M., & Santos, E. D. O. (2023) · PROTEOMICS - CLINICAL APPLICATIONS · doi:10.1002/prca.202200098 · Cited by 12
Self-citationBlanco‐Pintos, T., Regueira‐Iglesias, A., Relvas, M., Alonso‐Sampedro, M., Chantada‐Vázquez, M. D. P., Balsa‐Castro, C., & Tomás, I. (2024) · Journal Of Clinical Periodontology · doi:10.1111/jcpe.14037 · Cited by 12
Batschkus, S., Cingoez, G., Urlaub, H., Miosge, N., Kirschneck, C., Meyer-Marcotty, P., & Lenz, C. (2017) · Clinical Oral Investigations · doi:10.1007/s00784-017-2213-0 · Cited by 11
Michalusová, I., Trubacova, D., Cejnar, P., Kučková, Š., Šantrůček, J., & Hynek, R. (2020) · International Journal of Mass Spectrometry · doi:10.1016/j.ijms.2020.116375 · Cited by 12
Xiao, X., Song, T., Xiao, X., Liu, Y., Sun, H., Guo, Z., Liu, X., Shao, C., Li, Q., & Sun, W. (2021) · PROTEOMICS · doi:10.1002/pmic.202000321 · Cited by 11
Direct MALDI-TOF profiling of gingival crevicular fluid sediments for periodontitis diagnosis
Yi, J., Shen, Y., Yang, Y., Shen, C., Liu, B., Qiao, L., & Wang, Y. (2020) · Talanta · doi:10.1016/j.talanta.2020.121956 · Cited by 10
Mohammed-Salih, H. S., Al-Lami, H. A., Saloom, H. F., Abdulkareem, A. A., Al‐Obaidi, J. R., & Razali, N. (2023) · 3 Biotech · doi:10.1007/s13205-023-03572-5 · Cited by 9
Abduljabbar, T. S., Al‐Hamdan, R. S., Deeb, M. A., Al‐Aali, K. A., & Vohra, F. A. (2020) · European Journal of Dentistry · doi:10.1055/s-0040-1716986 · Cited by 9
Tracking the functional meaning of the human oral-microbiome protein-protein interactions
Rosa, N. D. N., Campos, B., Esteves, A. C., Duarte, A. S., Correia, M. J., Silva, R. M., & Barros, M. (2020) · Advances in protein chemistry and structural biology · doi:10.1016/bs.apcsb.2019.11.014 · Cited by 8
Yakar, N., Bostancı, N., Özdemir, G., Atmaca, H., Türedi, A., Şahin, Ç., Köse, T., & Emingil, G. (2023) · Journal of Periodontology · doi:10.1002/jper.23-0124 · Cited by 7
A loss of profilin‐1 in late‐stage oral squamous cell carcinoma
Adami, G. R., O'Callaghan, T. N., Kolokythas, A., Cabay, R. J., Zhou, Y., & SCHWARTZ, J. L. (2016) · Journal of Oral Pathology and Medicine · doi:10.1111/jop.12523 · Cited by 7
Salivary detection of COVID-19: clinical performance of oral sponge sampling for SARS-CoV-2 testing
Marquette, C., Boutros, J., Benzaquen, J., Ilié, M., Labaky, M., Benchetrit, D., Lavrut, T., Leroy, S., Chemla, R., Carlès, M., et al. (2021) · ERJ Open Research · doi:10.1183/23120541.00396-2021 · Cited by 7
Induction of Epithelial–Mesenchymal Transition in Periodontitis Rat Model
Alanbari, B. F., Al-Taweel, F. B. H., Cooper, P. R., & Milward, M. R. (2024) · European Journal of Dentistry · doi:10.1055/s-0044-1792011 · Cited by 7
Annexin A2 Contributes to Release of Extracellular Vimentin in Response to Inflammation
Yuan, Z., Ostrowska‐Podhorodecka, Z., Cox, T., Norouzi, M., Wang, Y., Robaszkiewicz, K., Siatkowska, M., Xia, K., Ali, A. A., Abovsky, M., et al. (2025) · The FASEB Journal · doi:10.1096/fj.202500793r · Cited by 6
Characterisation of the periodontal proteome in gingival crevicular fluid and saliva using SWATH-MS
Blanco‐Pintos, T., Regueira‐Iglesias, A., Suárez‐Rodríguez, B., Seijas‐Otero, N., Relvas, M., Bravo, S. B., Balsa‐Castro, C., & Tomás, I. (2025) · Frontiers in Cellular and Infection Microbiology · doi:10.3389/fcimb.2025.1576906 · Cited by 7
Chakravarthy, Y., Mishra, A., Krishnan, P., Pathakota, K. R., Vijaya, V., & Kamathan, S. N. (2022) · Indian Journal of Dental Research · doi:10.4103/ijdr.ijdr_646_21 · Cited by 5
Gingivitis in cattle and supplemental protein diet: Insights from proteomic analysis
Saraiva, J. R., Dionizio, A. S., Borsanelli, A. C., Ventura, T. M. O., Grizzo, L. T., de Athayde, F. R. F., Vaccari, J., Ramos, T. N. M., de Souza, N. C., Buzalaf, M. A. R., et al. (2023) · Journal of Proteomics · doi:10.1016/j.jprot.2023.104913 · Cited by 5
Bellei, E., Monari, E., Bertoldi, C., & Bergamini, S. (2024) · Sci · doi:10.3390/sci6040057 · Cited by 6
Yuan, Z., Smith, P. C., & McCulloch, C. A. (2025) · The FASEB Journal · doi:10.1096/fj.202402322r · Cited by 5
Salivary Lactoferrin Levels and Polymorphisms in Down Syndrome Individuals with Periodontitis
López, L. S., García, E. V., de Coo, A., Cruz, R., Antequera, D., Dios, P. D., Carro, E., & Mundiña, B. R. (2025) · Journal of Clinical Medicine · doi:10.3390/jcm14061815 · Cited by 4
Ali, K., & Raja, M. (2020) · Evidence-Based Dentistry · doi:10.1038/s41432-020-0108-4 · Cited by 4
Ventura, T. M. O., Santos, K. O., Braga, A. S., Grizzo, L. T., Buzalaf, M. A. R., Barbieri, F. A., Kalva‐Filho, C. A., Faria, M. H., & Magalhães, A. C. (2022) · Sport Sciences for Health · doi:10.1007/s11332-021-00883-z · Cited by 5
Alpha-Defensin 1: An Emerging Periodontitis Biomarker
Lee, J., Chang, D., Kim, J., & Hwang, Y. (2023) · Diagnostics · doi:10.3390/diagnostics13132143 · Cited by 3
Proteomics - The Future of Periodontal Diagnostics
Kj, N., & George, A. K. (2017) · Biomedical Journal of Scientific & Technical Research · doi:10.26717/bjstr.2017.01.000447 · Cited by 3
Interproximal Contact Area and Width: Relationship to Periodontal Parameters
Awang, R. A. (2020) · International Journal of Dentistry and Oral Science · doi:10.19070/2377-8075-20000158 · Cited by 3
Proteomics of Periodontal Pocket
Sakellari, D. (2017) · Current Oral Health Reports · doi:10.1007/s40496-017-0160-0 · Cited by 3
Rao, P. V., Nair-Shaef, D., Chen, S., Kazmierczak, S. C., Roberts, C. T., & Nagalla, S. R. (2021) · medRxiv · doi:10.1101/2021.06.28.21259657 · Cited by 3
Saylan, B. C. U., Yılmaz, B., Öztürk, V. Ö., Atmaca, H., & Emingil, G. (2025) · BMC Oral Health · doi:10.1186/s12903-025-06049-4 · Cited by 2
Analysis of Periodontitis Biomarker Expression in Gingival Crevicular Fluids
Hwang, Y. S. (2021) · Journal of dental hygiene science · doi:10.17135/jdhs.2021.21.1.45 · Cited by 2
Dentistry and COVID-19: A current view
Universidad Señor de Sipán. Chiclayo, P., Mondragón, J. P. P., Alvarez, H., & Centro Médico Odontológico Americano. Chiclayo, P. (2020) · Journal Of Oral Research · doi:10.17126/joralres.2020.047 · Cited by 2
PROTEOMICS IN DENTISTRY- A REVIEW.
Alexander, B. (2018) · International Journal of Advanced Research · doi:10.21474/ijar01/7614 · Cited by 1
The importance of Dentistry in COVID-19 pandemic and the role of saliva as a diagnostic tool
Moura, N. M. V., Gonzalez, A. F., & Taba, M. (2021) · RGO - Revista Gaúcha de Odontologia · doi:10.1590/1981-86372021001620200138 · Cited by 1
Proteomic Analysis of Gingival Crevicular Fluid During Tooth Eruption
ALBAT, S. Y., Akyüz, S., Yarat, A., Şahi̇n, F., & Çimen, H. (2023) · Clinical and Experimental Health Sciences · doi:10.33808/clinexphealthsci.1214974 · Cited by 1
Thangavel, S., Venkatesh, P. M. L., & Varadhan, K. B. (2020) · Journal of Bio Innovation · doi:10.46344/jbino.2020.v09i03.18 · Cited by 1
Use of JAK STAT Pathway Blocker To Treat COVID19 Patients - The Future of COVID19 TreatmentPreprint
Mukherjee, D., Imam, S., & Mukherjee, K. K. (2020) · SSRN Electronic Journal · doi:10.2139/ssrn.3623965
Powered Versus Manual Scalers, The Competition Ends with Wins or Failures
Jassim, S. D. (2020) · Journal Of Oral Medicine And Dental Research · doi:10.52793/jomdr.2020.1(2)-06
ORAL MANIFESTATIONS OF COVID-19: EARLY DIAGNOSTIC AID?
Katira, P., Shah, D., & Maniyar, F. (2020) · INTERNATIONAL JOURNAL OF SCIENTIFIC RESEARCH · doi:10.36106/ijsr/7233891
CORONAVÍRUS e desafios para o atendimento odontológico
Andrade, R. A. R., de Almeida, A. A. G., Mota, I. M. B. D. S., & do Amaral, R. C. (2021) · Research Society and Development · doi:10.33448/rsd-v10i4.13862
Tammam, R., & Ibrahim, A. (2021) · Indian Journal of Forensic Medicine & Toxicology · doi:10.37506/ijfmt.v15i3.15922
COVID-19 Crisis and Precautions in Dental Practice: A Review Report
Penugonda, B., Kansara, P., Kansara, T. M., & Kini, A. (2021) · Journal of Oral Health and Community Dentistry · doi:10.5005/jp-journals-10062-0098
Saliva in coronavirus disease-2019: A reliable diagnostic tool and imperative transmitter: A review
Hiremutt, D. P., Pandey, J., & Mhapuskar, A. (2021) · Journal of the International Clinical Dental Research Organization · doi:10.4103/jicdro.jicdro_81_20
Coronavirus COVID-19 – Impact on Dentistry
(2020) · Journal of the Bahrain Medical Society · doi:10.26715/jbms.32_2020_1_1
Veerman, E. C. I. (2014) · Bohn Stafleu van Loghum eBooks · doi:10.1007/978-90-368-0387-8_14
Fauzia, M., Roeswahjuni, N., Priyanto, R., Pratiwi, A. R., Firani, N. K., & Amelia, M. (2022) · Acta stomatologica Naissi · doi:10.5937/asn2286479f
Neelambigai, R., Nsk, P., Nasruddin, N. S., Ms, S., Na, N. M., & Farinawati, Y. (2023) · Medicine & health · doi:10.17576/mh.2023.1802.04
Balasubramaniyam, K., Sree, S. L., Jayavel, K., Krishnan, V., & Sundaram, R. (2023) · SRM Journal of Research in Dental Sciences · doi:10.4103/srmjrds.srmjrds_99_23
Ahmad, P., Lowe, C., Chumala, P., & Siqueira, W. L. (2025) · The Veterinary Journal · doi:10.1016/j.tvjl.2025.106521
Self-citationFeyo, V. B., Provinciali, L. S., Rodrigues, L. S. S., Pereira, J. J., Gerheim, P. S. A. S., de Souza, V. A., Fraga, R. D. O., Raposo, N. R. B., & Fabri, G. M. C. (2025) · International Journal of Rheumatic Diseases · doi:10.1111/1756-185x.70494
Proteomic Characterization of Grade II Furcation Defects: A Discovery‐Phase Study
Chatzopoulos, G. S., Sakellari, D., Kaklamanos, E. G., & Tsalikis, L. (2026) · Journal of Periodontal Research · doi:10.1111/jre.70108
Metadata
- Authors
- Silva-Boghossian, C. M., Colombo, A. P. V., Tanaka, M., Rayo, C., Xiao, Y., & Siqueira, W. L.
- Affiliations
- Universidade Federal do Rio de Janeiro (BR)
- Western University (CA)
- Corresponding author
- Siqueira, Walter L.
- Venue
- PLoS ONE
- Publisher
- Public Library of Science (PLoS)
- Published
- 2013-10-01
- Volume
- 8
- Issue
- 10
- Pages
- e75898
- ISSN
- 1932-6203 (ISSN-L)
- PMC
- PMC3787961
- OpenAlex
- W1965316932
- Cited by
- 104
- References
- 31
- Citations by year
- 2026: 4 · 2025: 9 · 2024: 6 · 2023: 10 · 2022: 5 · 2021: 16 · 2020: 22 · 2019: 4 · 2018: 6 · 2017: 10 · 2016: 4 · 2015: 3 · 2014: 4 · 2013: 1
- FWCI
- 4.85
- Type
- journal article
- Language
- en
- Open access
- gold
- doi.org
- Locations
- PLoS ONE (publishedVersion, cc-by)
- Europe PMC (PubMed Central) (publishedVersion, cc-by)
- PubMed Central (publishedVersion, cc-by)
- PubMed (publishedVersion)
- DOAJ (DOAJ: Directory of Open Access Journals) (submittedVersion, cc-by-sa)
- Funders
- Coordenação de Aperfeiçoamento de Pessoal de Nível Superior
- Conselho Nacional de Desenvolvimento Científico e Tecnológico
- Canadian Institutes of Health Research (25116, 113166, 106657, 97577)
- Natural Sciences and Engineering Research Council of Canada (#371813, 113166)
- Topics
- Health Sciences › Dentistry › Periodontics › Oral microbiology and periodontitis research
- Health Sciences › Dentistry › Periodontics › Periodontal Regeneration and Treatments
- Health Sciences › Dentistry › Periodontics › Oral and gingival health research
- Keywords
- gingival crevicular fluid, proteome, chronic periodontitis, gingivitis, periodontal health, periodontal biomarkers, protein abundance
- MeSH terms
- Female, Gingival Crevicular Fluid, Humans, Male, Middle Aged, Case-Control Studies, Proteomics, Chronic Periodontitis, Young Adult
About these checks
Registry, retraction, Cites and statistics results are computed, not judged, with one exception: a printed reference that no index lists is read once by a model before it counts as a citation error. Claims are extracted by a model and kept only when their quote appears verbatim in the text; each cited source is then checked, with a model’s help, for whether it says what the claim relies on. Those verdicts can be wrong — read the claim’s quote and the cited source before relying on one.
Statistics and arithmetic are recomputed, not judged.
Confidence bands are shown only for fields calibrated on our annotated test set. None is calibrated yet, so no band is shown.
What counts as a claim ›How we measure confidence ›How we check this ›
Are you an author, or do you see a problem with this page? Request a review
