

Graphical Tools for Network Meta-Analysis in STATA
Open accessThe DOI matches its Crossref record; 51 of the 51 references it cites were found in a registry or an index.
Abstract
Network meta-analysis synthesizes direct and indirect evidence in a network of trials that compare multiple interventions and has the potential to rank the competing treatments according to the studied outcome. Despite its usefulness network meta-analysis is often criticized for its complexity and for being accessible only to researchers with strong statistical and computational skills. The evaluation of the underlying model assumptions, the statistical technicalities and presentation of the results in a concise and understandable way are all challenging aspects in the network meta-analysis methodology. In this paper we aim to make the methodology accessible to non-statisticians by presenting and explaining a series of graphical tools via worked examples. To this end, we provide a set of STATA routines that can be easily employed to present the evidence base, evaluate the assumptions, fit the network meta-analysis model and interpret its results.
Overview
The claims and statistics of this paper haven’t been checked yet.
Free: it reads the open-access text and checks the first 5 claims that cite a source we can check. Create a free account to check every claim.
Integrity signals
Registry
Cites
Statistics
Figures





Verification
Claims the paper makes
The claims and statistics of this paper haven’t been checked yet.
Free: it reads the open-access text and checks the first 5 claims that cite a source we can check. Create a free account to check every claim.
Claims other papers make about this one
Each is checked against this paper’s own text: does it say what the citing paper says it does?
The source backs part of the claim, not all of it — or backs it for a different population, condition or comparison.
In the citing paper
“We used comparisonadjusted funnel plots to assess publi cation bias.23”
From Comparative efficacy and acceptability of antidepressants, psychotherapies, and their combination for acute treatment of children and adolescents with depressive disorder: a systematic review and network meta-analysis (2020) · cites this paper as [23]
Experimental — accuracy not yet measuredThe source backs part of the claim, not all of it — or backs it for a different population, condition or comparison.
In the citing paper
“The statistical examination of the transitivity assumption was conducted using tests of local and global inconsistency 20 .”
From Psychotherapies for depression: a network meta-analysis covering efficacy, acceptability and long-term outcomes of all main treatment types (2021) · cites this paper as [20]
Experimental — accuracy not yet measuredThe source backs part of the claim, not all of it — or backs it for a different population, condition or comparison.
In the citing paper
“Small-study effects and potential publication bias were investigated by visual inspection of contour-enhanced, comparison-adjusted funnel plots, and an Egger's test.[26][27][28]”
From Comparative efficacy and tolerability of pharmacological interventions for acute bipolar depression in adults: a systematic review and network meta-analysis (2023) · cites this paper as [27]
Experimental — accuracy not yet measuredThe cited source says what the claim attributes to it.
In the citing paper
“We used comparison-adjusted funnel plots to investigate whether results in imprecise trials differ from those in more precise trials.17”
The cited source says what the claim attributes to it.
In the citing paper
“For each outcome with ≥10 studies, the comparison-adjusted funnel plot was used to assess small-study effects,17 where the overall treatment effect for each comparison was estimated under the fixed-effect meta-analysis model.”
2 more claims about this paper
Create a free account to see every claim other papers make about this one.
Self-check
Percentages, sums and reported differences re-computed from the paper’s own numbers.
The self-check needs the paper’s full text.
Citations
Cites
Bias in meta-analysis detected by a simple, graphical test
Egger, M., Smith, G. D., Schneider, M., & Minder, C. (1997) · BMJ · doi:10.1136/bmj.315.7109.629 · Cited by 56,722 · cited 1×
“It is the most common tool used to assess the presence of small-study effects in a meta-analysis [34].”
MethodMeta-analysis in clinical trials
DerSimonian, R., & Laird, N. (1986) · Controlled Clinical Trials · doi:10.1016/0197-2456(86)90046-2 · Cited by 39,552 · cited 1×
“Method of moments and restricted maximum likelihood are those most commonly used and have been implemented in STATA’s metan command along with an empirical Bayes method [32,33].”
MethodThe Handbook of Research Synthesis and Meta-Analysis
(2019) · doi:10.7758/9781610448864 · Cited by 4,553 · cited 1×
“freedom (in NMA we suggest this is set to number of studies – number of comparisons with data – 1 [41]) and m̂ is the metaanalysis summary effect.”
BackgroundSalanti, G., Ades, A. E., & Ioannidis, J. P. A. (2011) · Journal of Clinical Epidemiology · doi:10.1016/j.jclinepi.2010.03.016 · Cited by 3,766 · cited 4×
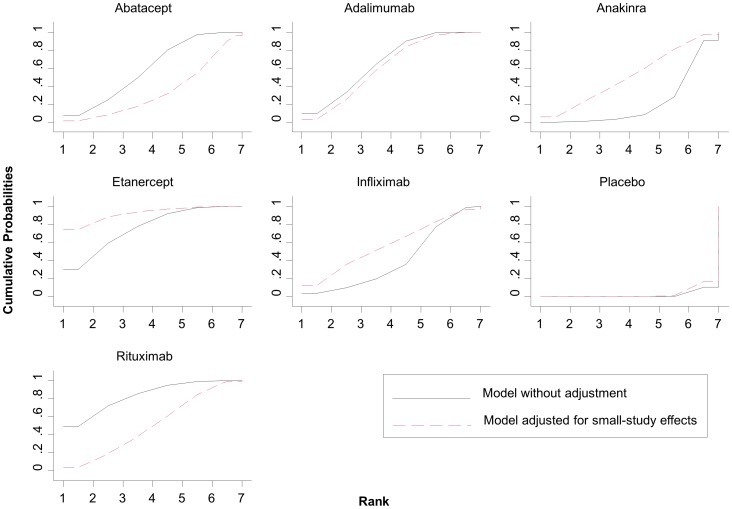
“So-called rankograms and cumulative ranking probability plots have been suggested as a reliable and comprehensive graphical way to present ranking probabilities and their uncertainty [2].”
BackgroundMethodInfluentialSelf-citationInterpretation of random effects meta-analyses
Riley, R. D., Higgins, J. P. T., & Deeks, J. J. (2011) · BMJ · doi:10.1136/bmj.d549 · Cited by 2,884 · cited 2×
“and predictive ranking probabilities (the probability that each treatment will be placed in each rank in a future study [39,40]) can be estimated with the suboption predict.”
BackgroundSelf-citationA Re-Evaluation of Random-Effects Meta-Analysis
Higgins, J. P. T., Thompson, S. G., & Spiegelhalter, D. J. (2009) · Journal of the Royal Statistical Society Series A: Statistics in Society · doi:10.1111/j.1467-985x.2008.00552.x · Cited by 2,569 · cited 2×
“and predictive ranking probabilities (the probability that each treatment will be placed in each rank in a future study [39,40]) can be estimated with the suboption predict.”
BackgroundSelf-citationChecking consistency in mixed treatment comparison meta-analysis
Dias, S., Welton, N. J., Caldwell, D. M., & Ades, A. E. (2010) · Statistics in Medicine · doi:10.1002/sim.3767 · Cited by 2,521 · cited 1×
“Several approaches have been developed to deal with inconsistency in a network of interventions [26–29].”
BackgroundCombination of direct and indirect evidence in mixed treatment comparisons
Lu, G., & Ades, A. E. (2004) · Statistics in Medicine · doi:10.1002/sim.1875 · Cited by 2,166 · cited 1×
“Thus, in the presence of multi-arm trials, researchers have often preferred to perform NMA in a Bayesian framework that offers more flexibility [21,22].”
BackgroundConsistency and inconsistency in network meta-analysis: concepts and models for multi-arm studies
Higgins, J. P. T., Jackson, D., Barrett, J. K., Lu, G., Ades, A. E., & White, I. R. (2012) · Research Synthesis Methods · doi:10.1002/jrsm.1044 · Cited by 2,098 · cited 1×
“recently described NMA as a multivariate meta-analysis model [23,24].”
MethodSelf-citationBucher, H. C., Guyatt, G. H., Griffith, L. E., & Walter, S. D. (1997) · Journal of Clinical Epidemiology · doi:10.1016/s0895-4356(97)00049-8 · Cited by 2,052 · cited 1×
“The integration of direct evidence (from studies directly comparing interventions) with indirect evidence (information about two treatments derived via a common comparator) increases the precision in the estimates and produces a relative ranking of all treatments for the studied outcome [1,2].”
BackgroundCluster analysis for researchers
(1987) · Environmental Software · doi:10.1016/0266-9838(87)90010-4 · Cited by 1,850
Salanti, G. (2012) · Research Synthesis Methods · doi:10.1002/jrsm.1037 · Cited by 1,729 · cited 3×
“Rather than weighting edges by amount of information, the use of weighted edges according to the distribution of study-specific variables may assist in evaluation of the transitivity assumption [17,12].”
BackgroundMethodSelf-citationBias and Efficiency of Meta-Analytic Variance Estimators in the Random-Effects Model
Viechtbauer, W. (2005) · Journal of Educational and Behavioral Statistics · doi:10.3102/10769986030003261 · Cited by 1,699 · cited 1×
“Numerous methods are available to estimate the heterogeneity variance in meta-analysis [31].”
MethodParametric empirical Bayes inference: theory and applications
Morris, C. N. (1983) · Journal of the American Statistical Association · doi:10.1080/01621459.1983.10477920 · Cited by 1,448 · cited 1×
“Method of moments and restricted maximum likelihood are those most commonly used and have been implemented in STATA’s metan command along with an empirical Bayes method [32,33].”
MethodNetwork meta‐analysis for indirect treatment comparisons
Lumley, T. (2002) · Statistics in Medicine · doi:10.1002/sim.1201 · Cited by 1,206 · cited 1×
“The model uses as covariates the basic parameters (a set of comparisons sufficient to generate all possible comparisons via the consistency equations) and assumes that heterogeneity is independent of the comparison being made [20].”
MethodWhite, I. R., Barrett, J. K., Jackson, D., & Higgins, J. P. T. (2012) · Research Synthesis Methods · doi:10.1002/jrsm.1045 · Cited by 1,114
Self-citationEvaluation of networks of randomized trials
Salanti, G., Higgins, J. P., Ades, A., & Ioannidis, J. P. (2008) · Statistical Methods in Medical Research · doi:10.1177/0962280207080643 · Cited by 1,078 · cited 1×
“Thus, in the presence of multi-arm trials, researchers have often preferred to perform NMA in a Bayesian framework that offers more flexibility [21,22].”
BackgroundSelf-citationConceptual and technical challenges in network meta-analysis
Cipriani, A., Higgins, J. P. T., Geddes, J. R., & Salanti, G. (2013) · Annals of Internal Medicine · doi:10.7326/0003-4819-159-2-201307160-00008 · Cited by 1,072 · cited 1×
“The assumption of consistency (agreement between direct and indirect sources of evidence) underlies the methodology and if it holds, NMA can give valuable information to patients, practitioners and decision makers [3,4].”
BackgroundSelf-citationGraphs in Statistical Analysis
Anscombe, F. J. (1973) · The American Statistician · doi:10.2307/2682899 · Cited by 1,048
Jansen, J. P., Fleurence, R., Devine, B., Itzler, R., Barrett, A., Hawkins, N., Lee, K., Boersma, C., Annemans, L., & Cappelleri, J. C. (2011) · Value in Health · doi:10.1016/j.jval.2011.04.002 · Cited by 1,036 · cited 1×
“One of the advantages of network meta-analysis is that it can provide information about the ranking of all evaluated interventions for the studied outcome [2,42].”
BackgroundGraphs in Statistical Analysis
Anscombe, F. J. (1973) · The American Statistician · doi:10.1080/00031305.1973.10478966 · Cited by 976 · cited 1×
“Graphical tools can provide comprehensive and easily understandable ways to present results of statistical analyses, particularly when a large amount of data is involved [5].”
BackgroundAssessing Evidence Inconsistency in Mixed Treatment Comparisons
Lu, G., & Ades, A. E. (2006) · Journal of the American Statistical Association · doi:10.1198/016214505000001302 · Cited by 756 · cited 2×
“Several approaches have been developed to deal with inconsistency in a network of interventions [26–29].”
BackgroundMethodNetwork meta‐analysis, electrical networks and graph theory
Rücker, G. (2012) · Research Synthesis Methods · doi:10.1002/jrsm.1058 · Cited by 730
Dias, S., Welton, N. J., Sutton, A. J., & Ades, A. E. (2011) · Bristol Research (University of Bristol) · Cited by 691
Cipriani, A., Barbui, C., Salanti, G., Rendell, J., Brown, R., Stockton, S., Purgato, M., Spineli, L. M., Goodwin, G. M., & Geddes, J. R. (2011) · The Lancet · doi:10.1016/s0140-6736(11)60873-8 · Cited by 631 · cited 1×
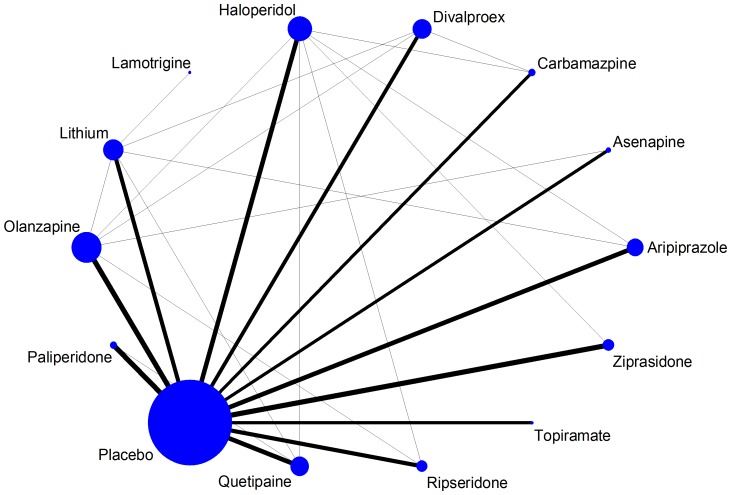
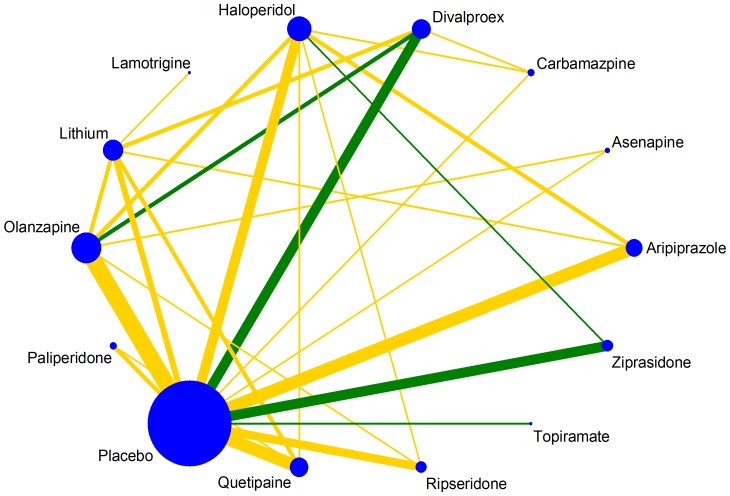
“The first example compares 14 antimanic drugs for acute mania [14].”
BackgroundSelf-citationQuantifying the impact of between-study heterogeneity in multivariate meta-analyses
Jackson, D., White, I. R., & Riley, R. D. (2012) · Statistics in Medicine · doi:10.1002/sim.5453 · Cited by 577 · cited 1×
“Although multivariate heterogeneity measures such as I 2 for multivariate meta-analysis have been developed [38], they have not been applied yet to NMA.”
MethodEvaluation of inconsistency in networks of interventions
Veroniki, A. A., Vasiliadis, H. S., Higgins, J. P., & Salanti, G. (2013) · International Journal of Epidemiology · doi:10.1093/ije/dys222 · Cited by 576 · cited 1×
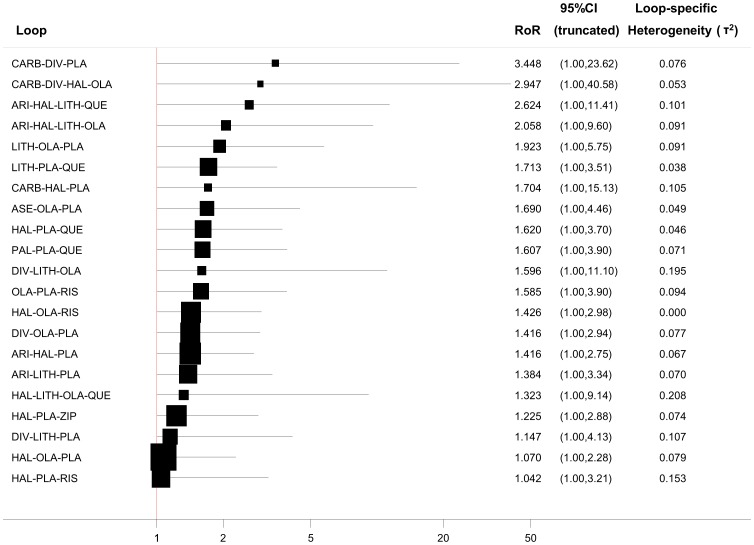
“It has been shown that different estimators of the heterogeneity parameter and the various assumptions about the similarity of heterogeneity across comparisons can lead to different conclusions about the presence of statistical inconsistency [30].”
BackgroundSelf-citationThe handbook of research synthesis and meta-analysis, 2nd ed.
Cooper, H. M., Hedges, L. V., & Valentine, J. C. (2009) · Cited by 541
Multivariate meta‐analysis: Potential and promise
Jackson, D., Riley, R., & White, I. R. (2011) · Statistics in Medicine · doi:10.1002/sim.4172 · Cited by 530 · cited 1×
“An appropriate analysis of multiple outcomes should be undertaken using multivariate methods to account for the dependency between outcomes [45,46].”
Chaimani, A., & Salanti, G. (2012) · Research Synthesis Methods · doi:10.1002/jrsm.57 · Cited by 521
Self-citationA graphical tool for locating inconsistency in network meta-analyses
Krahn, U., Binder, H., & König, J. (2013) · BMC Medical Research Methodology · doi:10.1186/1471-2288-13-35 · Cited by 458 · cited 2×
“Graphical tools may help investigators to spot parts of the evidence network that appear inconsistent, or to inform judgments about the plausibility of consistency [8].”
BackgroundMultivariate Random-effects Meta-regression: Updates to Mvmeta
White, I. R. (2011) · The Stata Journal: Promoting communications on statistics and Stata · doi:10.1177/1536867x1101100206 · Cited by 400
Song, F., Loke, Y. K., Walsh, T., Glenny, A.-M., Eastwood, A. J., & Altman, D. G. (2009) · BMJ · doi:10.1136/bmj.b1147 · Cited by 395 · cited 1×
“Finally, NMA results are not easy to interpret and do not always facilitate decision-making [9,10].”
BackgroundNetwork meta-analysis-highly attractive but more methodological research is needed
Li, T., Puhan, M. A., Vedula, S. S., Singh, S., Dickersin, K., & The Ad Hoc Network Meta-analysis Methods Meeting Working Group (2011) · BMC Medicine · doi:10.1186/1741-7015-9-79 · Cited by 361 · cited 1×
“The assumption of consistency (agreement between direct and indirect sources of evidence) underlies the methodology and if it holds, NMA can give valuable information to patients, practitioners and decision makers [3,4].”
A case study of multiple-treatments meta-analysis demonstrates that covariates should be considered
Salanti, G., Marinho, V., & Higgins, J. P. T. (2009) · Journal of Clinical Epidemiology · doi:10.1016/j.jclinepi.2008.10.001 · Cited by 302 · cited 2×
“Ratherthan weighting edges by amount of information, the use of weighted edges according to the distribution of study-specific variables may assist in evaluation of the transitivity assumption [17,12].”
BackgroundMethodSelf-citationAssessing key assumptions of network meta‐analysis: a review of methods
Donegan, S., Williamson, P., D'Alessandro, U., & Tudur Smith, C. (2013) · Research Synthesis Methods · doi:10.1002/jrsm.1085 · Cited by 267 · cited 3×
“Several approaches have been developed to deal with inconsistency in a network of interventions [26–29].”
BackgroundMethodA practical introduction to multivariate meta-analysis
Mavridis, D., & Salanti, G. (2013) · Statistical Methods in Medical Research · doi:10.1177/0962280211432219 · Cited by 255 · cited 1×
“An appropriate analysis of multiple outcomes should be undertaken using multivariate methods to account for the dependency between outcomes [45,46].”
Self-citationTrikalinos, T. A., Alsheikh-Ali, A. A., Tatsioni, A., Nallamothu, B. K., & Kent, D. M. (2009) · The Lancet · doi:10.1016/s0140-6736(09)60319-6 · Cited by 243 · cited 1×
“The second example is a network of 62 studies that evaluate the effectiveness of four different percutaneous coronary interventions for nonacute coronary artery disease [15].”
BackgroundGraphical displays for meta-analysis: An overview with suggestions for practice
Anzures‐Cabrera, J., & Higgins, J. P. T. (2010) · Research Synthesis Methods · doi:10.1002/jrsm.6 · Cited by 233 · cited 1×
“Various plots have been suggested for summarizing the evidence from studies on the relative effectiveness or acceptability of two interventions [6,7].”
BackgroundSelf-citationSingh, J. A., Christensen, R., Wells, G. A., Suarez-Almazor, M. E., Buchbinder, R., Lopez-Olivo, M. A., Ghogomu, E. T., & Tugwell, P. (2009) · Canadian Medical Association Journal · doi:10.1503/cmaj.091391 · Cited by 229
Song, F., Harvey, I., & Lilford, R. (2008) · Journal of Clinical Epidemiology · doi:10.1016/j.jclinepi.2007.06.006 · Cited by 195 · cited 2×
“Several approaches have been developed to deal with inconsistency in a network of interventions [26–29].”
BackgroundMethodAssessing Publication Bias in Meta-Analyses in the Presence of Between-Study Heterogeneity
Peters, J. L., Sutton, A. J., Jones, D. R., Abrams, K. R., Rushton, L., & Moreno, S. G. (2010) · Journal of the Royal Statistical Society Series A: Statistics in Society · doi:10.1111/j.1467-985x.2009.00629.x · Cited by 166 · cited 1×
“In the ‘comparison-adjusted’ funnel plot the horizontal axis presents the difference between the study-specific effect sizes from the corresponding comparison-specific summary effect [35].”
BackgroundMore Than Numbers: The Power of Graphs in Meta-Analysis
Bax, L., Ikeda, N., Fukui, N., Yaju, Y., Tsuruta, H., & Moons, K. G. M. (2008) · American Journal of Epidemiology · doi:10.1093/aje/kwn340 · Cited by 165 · cited 1×
“Various plots have been suggested for summarizing the evidence from studies on the relative effectiveness or acceptability of two interventions [6,7].”
BackgroundRejoinder to commentaries on ‘Multivariate meta‐analysis: Potential and promise’
Jackson, D., White, I. R., & Riley, R. D. (2011) · Statistics in Medicine · doi:10.1002/sim.4247 · Cited by 161
Indirect Comparisons: A Review of Reporting and Methodological Quality
Donegan, S., Williamson, P., Gamble, C., & Tudur-Smith, C. (2010) · PLoS ONE · doi:10.1371/journal.pone.0011054 · Cited by 145 · cited 1×
“Finally, NMA results are not easy to interpret and do not always facilitate decision-making [9,10].”
BackgroundMavridis, D., Sutton, A., Cipriani, A., & Salanti, G. (2013) · Statistics in Medicine · doi:10.1002/sim.5494 · Cited by 87 · cited 1×
“If the funnel plot suggests the presence of small-study effects, investigators can explore this further by employing appropriate network meta-regression or selection models [36,37].”
MethodSelf-citationLinear inference for mixed treatment comparison meta‐analysis: a two‐stage approach
Lu, G., Welton, N. J., Higgins, J. P. T., White, I. R., & Ades, A. E. (2012) · Research Synthesis Methods · doi:10.1002/jrsm.1059 · Cited by 85
Self-citationLu, G., Welton, N. J., Higgins, J. P. T., White, I. R., & Ades, A. E. (2011) · Research Synthesis Methods · doi:10.1002/jrsm.34 · Cited by 77 · cited 2×
“Important differences in the variance of direct estimates between comparisons can affect their relative contribution to the other comparisons [18,19].”
BackgroundSelf-citationThe Analysis of Proximity Data
Lee, K., Everitt, B. S., & Rabe‐Hesketh, S. (1999) · Technometrics · doi:10.2307/1270998 · Cited by 71
Graphical exploration of network meta-analysis data: the use of multidimensional scaling
Chung, H., & Lumley, T. (2008) · Clinical Trials · doi:10.1177/1740774508093614 · Cited by 26 · cited 1×
“An alternative approach to rank the competing treatments is by using multidimensional scaling (MDS) [43], which was recently employed to examine the inconsistency in a network of interventions [44].”
MethodEvaluation of inconsistency in networks of interventions
Veroniki, A. A., Vasiliadis, H. S., Higgins, J. P. T., & Salanti, G. (2013) · International Journal of Epidemiology · doi:10.1093/ije/dyt106 · Cited by 22
Self-citation
Cited by
Hutton, B., Salanti, G., Caldwell, D. M., Chaimani, A., Schmid, C. H., Cameron, C., Ioannidis, J. P. A., Straus, S., Thorlund, K., Jansen, J. P., et al. (2015) · Annals of Internal Medicine · doi:10.7326/m14-2385 · Cited by 8,269
Self-citationCipriani, A., Furukawa, T. A., Salanti, G., Chaimani, A., Atkinson, L. Z., Ogawa, Y., Leucht, S., Ruhe, H. G., Turner, E. H., Higgins, J. P. T., et al. (2018) · The Lancet · doi:10.1016/s0140-6736(17)32802-7 · Cited by 3,541
Self-citationPuhan, M. A., Schunemann, H. J., Murad, M. H., Li, T., Brignardello-Petersen, R., Singh, J. A., Kessels, A. G., Guyatt, G. H., & for the GRADE Working Group (2014) · BMJ · doi:10.1136/bmj.g5630 · Cited by 1,812
Ranking treatments in frequentist network meta-analysis works without resampling methods
Rücker, G., & Schwarzer, G. (2015) · BMC Medical Research Methodology · doi:10.1186/s12874-015-0060-8 · Cited by 1,732
“They also introduced several graphical presentations of ranking, such as rankograms, bar graphs and scatterplots [10, 17], and a numerical summary of the rank distribution, called the Surface Under the Cumulative RAnking curve (SUCRA) for each treatment [6, 18, 19].”
Evaluating the quality of evidence from a network meta-analysis
Salanti, G., Del Giovane, C., Chaimani, A., Caldwell, D. M., & Higgins, J. P. T. (2014) · PLoS ONE · doi:10.1371/journal.pone.0099682 · Cited by 1,402
“The contribution plot can be obtained in STATA (see [14]).”
BackgroundMethodSelf-citation
Metadata
- Authors
- Chaimani, A., Higgins, J. P. T., Mavridis, D., Spyridonos, P., & Salanti, G.
- Affiliations
- University of Ioannina (GR)
- University of Bristol (GB)
- Corresponding author
- Salanti, Georgia
- Venue
- PLoS ONE
- Publisher
- Public Library of Science (PLoS)
- Published
- 2013-10-03
- Volume
- 8
- Issue
- 10
- Pages
- e76654
- ISSN
- 1932-6203 (ISSN-L)
- PMC
- PMC3789683
- OpenAlex
- W2091808438
- Semantic Scholar
- c99555607f865f8e0d32e5054195b29ccecc06cf
- Cited by
- 2,473
- References
- 51
- Citations by year
- 2026: 222 · 2025: 237 · 2024: 256 · 2023: 252 · 2022: 267 · 2021: 298 · 2020: 228 · 2019: 186 · 2018: 182 · 2017: 154 · 2016: 99 · 2015: 65 · 2014: 26 · 2013: 1
- FWCI
- 70.14
- Type
- journal article
- Language
- en
- Open access
- gold
- doi.org
- Locations
- PLoS ONE (publishedVersion, cc-by)
- Europe PMC (PubMed Central) (publishedVersion, cc-by)
- PubMed Central (publishedVersion, cc-by)
- PubMed (publishedVersion)
- RePEc: Research Papers in Economics (submittedVersion)
- DOAJ (DOAJ: Directory of Open Access Journals) (submittedVersion)
- Figshare (submittedVersion, cc-by)
- Bristol Research (University of Bristol) (submittedVersion)
- Funders
- FP7 Ideas: European Research Council (260559)
- Topics
- Social Sciences › Decision Sciences › Statistics, Probability and Uncertainty › Meta-analysis and systematic reviews
- Physical Sciences › Mathematics › Statistics and Probability › Statistical Methods in Clinical Trials
- Social Sciences › Sociology and Political Science › Delphi Technique in Research
- Keywords
- network meta-analysis, graphical tools, treatment ranking, non-statisticians
- MeSH terms
- Acute Disease, Arthritis, Rheumatoid, Bipolar Disorder, Data Interpretation, Statistical, Humans, Research Design, Meta-Analysis as Topic, Models, Statistical, Odds Ratio, Treatment Outcome, Antirheumatic Agents, Antimanic Agents
About these checks
Registry, retraction, Cites and statistics results are computed, not judged, with one exception: a printed reference that no index lists is read once by a model before it counts as a citation error. Claims are extracted by a model and kept only when their quote appears verbatim in the text; each cited source is then checked, with a model’s help, for whether it says what the claim relies on. Those verdicts can be wrong — read the claim’s quote and the cited source before relying on one.
Statistics and arithmetic are recomputed, not judged.
Confidence bands are shown only for fields calibrated on our annotated test set. None is calibrated yet, so no band is shown.
What counts as a claim ›How we measure confidence ›How we check this ›
Are you an author, or do you see a problem with this page? Request a review
Data sources
Bibliographic data: Semantic Scholar, OpenAlex, Crossref.
Contains information from the Semantic Scholar Academic Graph Datasets, made available under the ODC Attribution License (ODC-BY 1.0).
Semantic Scholar’s data is described in: Kinney, R., et al. (2023). The Semantic Scholar Open Data Platform. arXiv:2301.10140.
