

Graphical Tools for Network Meta-Analysis in STATA
Open accessThe DOI matches its Crossref record; 51 of the 51 references it cites were found in a registry or an index.
Abstract
Network meta-analysis synthesizes direct and indirect evidence in a network of trials that compare multiple interventions and has the potential to rank the competing treatments according to the studied outcome. Despite its usefulness network meta-analysis is often criticized for its complexity and for being accessible only to researchers with strong statistical and computational skills. The evaluation of the underlying model assumptions, the statistical technicalities and presentation of the results in a concise and understandable way are all challenging aspects in the network meta-analysis methodology. In this paper we aim to make the methodology accessible to non-statisticians by presenting and explaining a series of graphical tools via worked examples. To this end, we provide a set of STATA routines that can be easily employed to present the evidence base, evaluate the assumptions, fit the network meta-analysis model and interpret its results.
Overview
The claims and statistics of this paper haven’t been checked yet.
Free: it reads the open-access text and checks the first 5 claims that cite a source we can check. Create a free account to check every claim.
Integrity signals
Registry
Cites
Statistics
Figures





Verification
Claims the paper makes
The claims and statistics of this paper haven’t been checked yet.
Free: it reads the open-access text and checks the first 5 claims that cite a source we can check. Create a free account to check every claim.
Claims other papers make about this one
Each is checked against this paper’s own text: does it say what the citing paper says it does?
The source backs part of the claim, not all of it — or backs it for a different population, condition or comparison.
In the citing paper
“We used comparisonadjusted funnel plots to assess publi cation bias.23”
From Comparative efficacy and acceptability of antidepressants, psychotherapies, and their combination for acute treatment of children and adolescents with depressive disorder: a systematic review and network meta-analysis (2020) · cites this paper as [23]
Experimental — accuracy not yet measuredThe source backs part of the claim, not all of it — or backs it for a different population, condition or comparison.
In the citing paper
“The statistical examination of the transitivity assumption was conducted using tests of local and global inconsistency 20 .”
From Psychotherapies for depression: a network meta-analysis covering efficacy, acceptability and long-term outcomes of all main treatment types (2021) · cites this paper as [20]
Experimental — accuracy not yet measuredThe source backs part of the claim, not all of it — or backs it for a different population, condition or comparison.
In the citing paper
“Small-study effects and potential publication bias were investigated by visual inspection of contour-enhanced, comparison-adjusted funnel plots, and an Egger's test.[26][27][28]”
From Comparative efficacy and tolerability of pharmacological interventions for acute bipolar depression in adults: a systematic review and network meta-analysis (2023) · cites this paper as [27]
Experimental — accuracy not yet measuredThe cited source says what the claim attributes to it.
In the citing paper
“We used comparison-adjusted funnel plots to investigate whether results in imprecise trials differ from those in more precise trials.17”
The cited source says what the claim attributes to it.
In the citing paper
“For each outcome with ≥10 studies, the comparison-adjusted funnel plot was used to assess small-study effects,17 where the overall treatment effect for each comparison was estimated under the fixed-effect meta-analysis model.”
2 more claims about this paper
Create a free account to see every claim other papers make about this one.
Self-check
Percentages, sums and reported differences re-computed from the paper’s own numbers.
The self-check needs the paper’s full text.
Citations
Cites
Bias in meta-analysis detected by a simple, graphical test
Egger, M., Smith, G. D., Schneider, M., & Minder, C. (1997) · BMJ · doi:10.1136/bmj.315.7109.629 · Cited by 56,722 · cited 1×
“It is the most common tool used to assess the presence of small-study effects in a meta-analysis [34].”
MethodMeta-analysis in clinical trials
DerSimonian, R., & Laird, N. (1986) · Controlled Clinical Trials · doi:10.1016/0197-2456(86)90046-2 · Cited by 39,552 · cited 1×
“Method of moments and restricted maximum likelihood are those most commonly used and have been implemented in STATA’s metan command along with an empirical Bayes method [32,33].”
MethodThe Handbook of Research Synthesis and Meta-Analysis
(2019) · doi:10.7758/9781610448864 · Cited by 4,553 · cited 1×
“freedom (in NMA we suggest this is set to number of studies – number of comparisons with data – 1 [41]) and m̂ is the metaanalysis summary effect.”
BackgroundSalanti, G., Ades, A. E., & Ioannidis, J. P. A. (2011) · Journal of Clinical Epidemiology · doi:10.1016/j.jclinepi.2010.03.016 · Cited by 3,766 · cited 4×
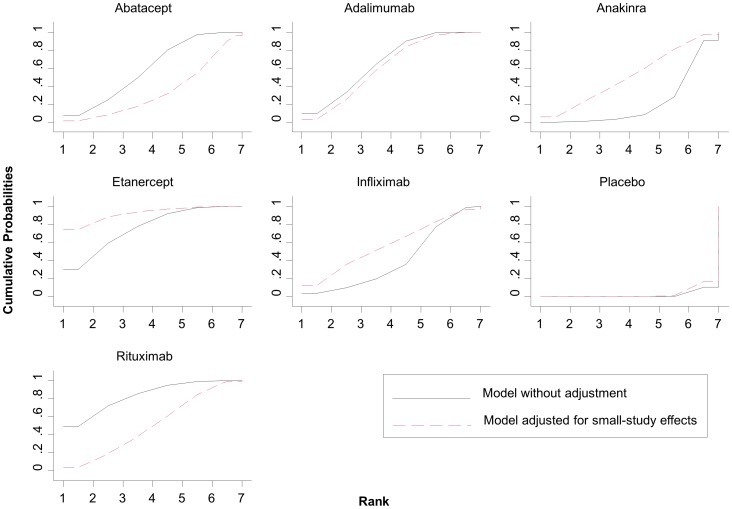
“So-called rankograms and cumulative ranking probability plots have been suggested as a reliable and comprehensive graphical way to present ranking probabilities and their uncertainty [2].”
BackgroundMethodInfluentialSelf-citationInterpretation of random effects meta-analyses
Riley, R. D., Higgins, J. P. T., & Deeks, J. J. (2011) · BMJ · doi:10.1136/bmj.d549 · Cited by 2,884 · cited 2×
“and predictive ranking probabilities (the probability that each treatment will be placed in each rank in a future study [39,40]) can be estimated with the suboption predict.”
BackgroundSelf-citationA Re-Evaluation of Random-Effects Meta-Analysis
Higgins, J. P. T., Thompson, S. G., & Spiegelhalter, D. J. (2009) · Journal of the Royal Statistical Society Series A: Statistics in Society · doi:10.1111/j.1467-985x.2008.00552.x · Cited by 2,569 · cited 2×
“and predictive ranking probabilities (the probability that each treatment will be placed in each rank in a future study [39,40]) can be estimated with the suboption predict.”
BackgroundSelf-citationChecking consistency in mixed treatment comparison meta-analysis
Dias, S., Welton, N. J., Caldwell, D. M., & Ades, A. E. (2010) · Statistics in Medicine · doi:10.1002/sim.3767 · Cited by 2,521 · cited 1×
“Several approaches have been developed to deal with inconsistency in a network of interventions [26–29].”
BackgroundCombination of direct and indirect evidence in mixed treatment comparisons
Lu, G., & Ades, A. E. (2004) · Statistics in Medicine · doi:10.1002/sim.1875 · Cited by 2,166 · cited 1×
“Thus, in the presence of multi-arm trials, researchers have often preferred to perform NMA in a Bayesian framework that offers more flexibility [21,22].”
BackgroundConsistency and inconsistency in network meta-analysis: concepts and models for multi-arm studies
Higgins, J. P. T., Jackson, D., Barrett, J. K., Lu, G., Ades, A. E., & White, I. R. (2012) · Research Synthesis Methods · doi:10.1002/jrsm.1044 · Cited by 2,098 · cited 1×
“recently described NMA as a multivariate meta-analysis model [23,24].”
MethodSelf-citationBucher, H. C., Guyatt, G. H., Griffith, L. E., & Walter, S. D. (1997) · Journal of Clinical Epidemiology · doi:10.1016/s0895-4356(97)00049-8 · Cited by 2,052 · cited 1×
“The integration of direct evidence (from studies directly comparing interventions) with indirect evidence (information about two treatments derived via a common comparator) increases the precision in the estimates and produces a relative ranking of all treatments for the studied outcome [1,2].”
Background
Cited by
Hutton, B., Salanti, G., Caldwell, D. M., Chaimani, A., Schmid, C. H., Cameron, C., Ioannidis, J. P. A., Straus, S., Thorlund, K., Jansen, J. P., et al. (2015) · Annals of Internal Medicine · doi:10.7326/m14-2385 · Cited by 8,269
Self-citationCipriani, A., Furukawa, T. A., Salanti, G., Chaimani, A., Atkinson, L. Z., Ogawa, Y., Leucht, S., Ruhe, H. G., Turner, E. H., Higgins, J. P. T., et al. (2018) · The Lancet · doi:10.1016/s0140-6736(17)32802-7 · Cited by 3,541
Self-citationPuhan, M. A., Schunemann, H. J., Murad, M. H., Li, T., Brignardello-Petersen, R., Singh, J. A., Kessels, A. G., Guyatt, G. H., & for the GRADE Working Group (2014) · BMJ · doi:10.1136/bmj.g5630 · Cited by 1,812
Ranking treatments in frequentist network meta-analysis works without resampling methods
Rücker, G., & Schwarzer, G. (2015) · BMC Medical Research Methodology · doi:10.1186/s12874-015-0060-8 · Cited by 1,732
“They also introduced several graphical presentations of ranking, such as rankograms, bar graphs and scatterplots [10, 17], and a numerical summary of the rank distribution, called the Surface Under the Cumulative RAnking curve (SUCRA) for each treatment [6, 18, 19].”
Evaluating the quality of evidence from a network meta-analysis
Salanti, G., Del Giovane, C., Chaimani, A., Caldwell, D. M., & Higgins, J. P. T. (2014) · PLoS ONE · doi:10.1371/journal.pone.0099682 · Cited by 1,402
“The contribution plot can be obtained in STATA (see [14]).”
BackgroundMethodSelf-citationNetwork meta-analysis: an introduction for clinicians
Rouse, B., Chaimani, A., & Li, T. (2017) · Internal and Emergency Medicine · doi:10.1007/s11739-016-1583-7 · Cited by 875
“appropriate to infer on treatment ranking using the mean rank, or the cumulative ranking probabilities [22].”
Self-citationKhera, R., Murad, M. H., Chandar, A. K., Dulai, P. S., Wang, Z., Prokop, L. J., Loomba, R., Camilleri, M., & Singh, S. (2016) · JAMA · doi:10.1001/jama.2016.7602 · Cited by 865
Drug treatments for covid-19: living systematic review and network meta-analysis
Siemieniuk, R. A., Bartoszko, J. J., Zeraatkar, D., Kum, E., Qasim, A., Díaz Martinez, J. P., Izcovich, A., Rochwerg, B., Lamontagne, F., Han, M. A., et al. (2020) · BMJ · doi:10.1136/bmj.m2980 · Cited by 846
White, I. R. (2015) · The Stata Journal: Promoting communications on statistics and Stata · doi:10.1177/1536867x1501500403 · Cited by 766
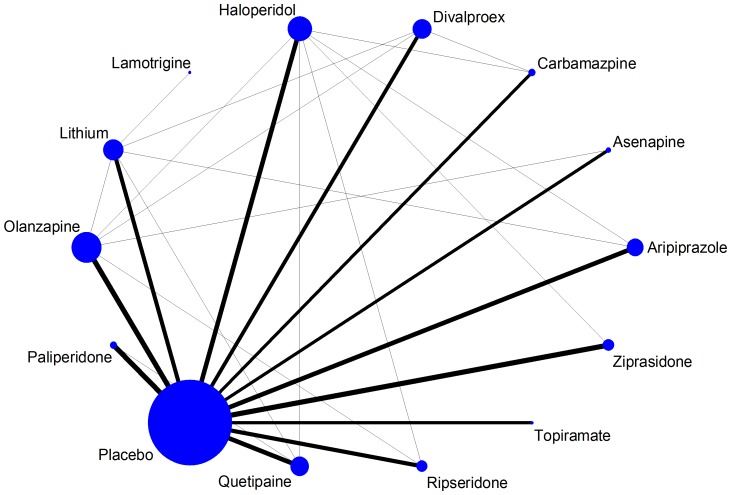
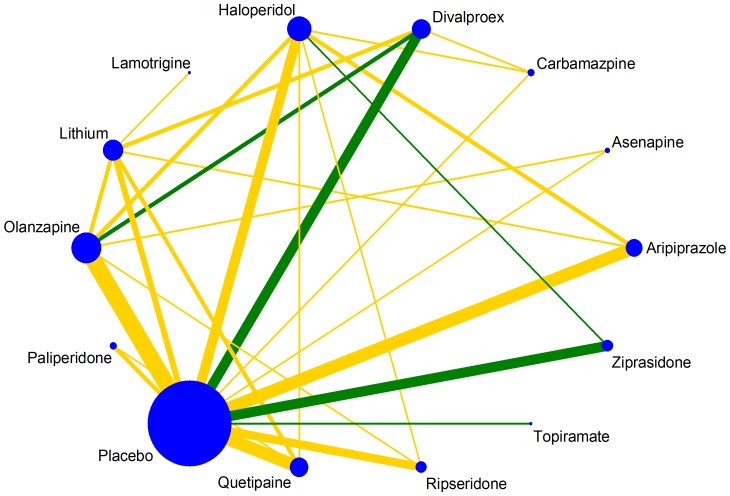
“Many graphical tools for displaying the evidence base and the results of network meta-analysis have been written by Chaimani et al. (2013).”
InfluentialCipriani, A., Zhou, X., Del Giovane, C., Hetrick, S. E., Qin, B., Whittington, C., Coghill, D., Zhang, Y., Hazell, P., Leucht, S., et al. (2016) · The Lancet · doi:10.1016/s0140-6736(16)30385-3 · Cited by 734
“18 The node splitting method was used to calculate the inconsistency of the model, which separated evidence on a particular comparison into direct and indirect evidence.”
A meta-analysis of procedures to change implicit measures
Forscher, P. S., Lai, C. K., Axt, J. R., Ebersole, C. R., Herman, M., Devine, P. G., & Nosek, B. A. (2019) · Journal of Personality and Social Psychology · doi:10.1037/pspa0000160 · Cited by 700
“Comparisonadjusted funnel plots are funnel plots adapted to network meta-analysis (Chaimani et al., 2013).”
MethodApproaches to interpreting and choosing the best treatments in network meta-analyses
Mbuagbaw, L., Rochwerg, B., Jaeschke, R., Heels-Andsell, D., Alhazzani, W., Thabane, L., & Guyatt, G. H. (2017) · Systematic Reviews · doi:10.1186/s13643-017-0473-z · Cited by 693
“However, the results of NMAs may be complex and difficult to interpret for clinicians especially when there are many alternative strategies and outcomes to consider [6, 7].”
BackgroundPalmer, S. C., Tendal, B., Mustafa, R. A., Vandvik, P. O., Li, S., Hao, Q., Tunnicliffe, D., Ruospo, M., Natale, P., Saglimbene, V., et al. (2021) · BMJ · doi:10.1136/bmj.m4573 · Cited by 679
“29”
Tricco, A. C., Thomas, S. M., Veroniki, A. A., Hamid, J. S., Cogo, E., Strifler, L., Khan, P. A., Robson, R., Sibley, K. M., MacDonald, H., et al. (2017) · JAMA · doi:10.1001/jama.2017.15006 · Cited by 611
Xu, C., Chen, Y.-P., Du, X.-J., Liu, J.-Q., Huang, C.-L., Chen, L., Zhou, G.-Q., Li, W.-F., Mao, Y.-P., Hsu, C., et al. (2018) · BMJ · doi:10.1136/bmj.k4226 · Cited by 558
Cuijpers, P., Noma, H., Karyotaki, E., Vinkers, C. H., Cipriani, A., & Furukawa, T. A. (2020) · World Psychiatry · doi:10.1002/wps.20701 · Cited by 540
Cuijpers, P., Noma, H., Karyotaki, E., Cipriani, A., & Furukawa, T. A. (2019) · JAMA Psychiatry · doi:10.1001/jamapsychiatry.2019.0268 · Cited by 539
netmeta : An R Package for Network Meta-Analysis Using Frequentist Methods
Balduzzi, S., Rücker, G., Nikolakopoulou, A., Papakonstantinou, T., Salanti, G., Efthimiou, O., & Schwarzer, G. (2023) · Journal of Statistical Software · doi:10.18637/jss.v106.i02 · Cited by 532
“The function funnel.netmeta() generates a “comparison-adjusted” funnel plot to assess funnel plot asymmetry in an NMA (Chaimani and Salanti 2012; Chaimani, Higgins, Mavridis, Spyridonos, and Salanti 2013).”
Self-citationda Costa, B. R., Reichenbach, S., Keller, N., Nartey, L., Wandel, S., Jüni, P., & Trelle, S. (2017) · The Lancet · doi:10.1016/s0140-6736(17)31744-0 · Cited by 522
RetractedBrunoni, A. R., Chaimani, A., Moffa, A. H., Razza, L. B., Gattaz, W. F., Daskalakis, Z. J., & Carvalho, A. F. (2017) · JAMA Psychiatry · doi:10.1001/jamapsychiatry.2016.3644 · Cited by 520
Self-citationZaccardi, F., Webb, D. R., Htike, Z. Z., Youssef, D., Khunti, K., & Davies, M. J. (2016) · Diabetes, Obesity and Metabolism · doi:10.1111/dom.12670 · Cited by 489
“For all outcomes, we summarized the evidence by using a network diagram [17].”
MethodMutz, J., Vipulananthan, V., Carter, B., Hurlemann, R., Fu, C. H. Y., & Young, A. H. (2019) · BMJ · doi:10.1136/bmj.l1079 · Cited by 427
Ge, L., Sadeghirad, B., Ball, G. D. C., da Costa, B. R., Hitchcock, C. L., Svendrovski, A., Kiflen, R., Quadri, K., Kwon, H. Y., Karamouzian, M., et al. (2020) · BMJ · doi:10.1136/bmj.m696 · Cited by 426
Palmer, S. C., Mavridis, D., Nicolucci, A., Johnson, D. W., Tonelli, M., Craig, J. C., Maggo, J., Gray, V., De Berardis, G., Ruospo, M., et al. (2016) · JAMA · doi:10.1001/jama.2016.9400 · Cited by 420
Self-citationRiboh, J. C., Saltzman, B. M., Yanke, A. B., Fortier, L., & Cole, B. J. (2016) · The American Journal of Sports Medicine · doi:10.1177/0363546515580787 · Cited by 417
“The model was built using the mvmeta command in Stata, as previously described.(8) A random-effects model was used to provide a more conservative estimate of effect sizes, and a common heterogeneity was assumed across comparisons.”
MethodInfluentialda Costa, B. R., Reichenbach, S., Keller, N., Nartey, L., Wandel, S., Jüni, P., & Trelle, S. (2016) · The Lancet · doi:10.1016/s0140-6736(16)30002-2 · Cited by 418
RetractedHtike, Z. Z., Zaccardi, F., Papamargaritis, D., Webb, D. R., Khunti, K., & Davies, M. J. (2017) · Diabetes, Obesity and Metabolism · doi:10.1111/dom.12849 · Cited by 416
Network meta-analysis: a technique to gather evidence from direct and indirect comparisons
Tonin, F. S., Rotta, I., Mendes, A. M., & Pontarolo, R. (2017) · Pharmacy Practice · doi:10.18549/pharmpract.2017.01.943 · Cited by 405
“Robust reporting of rankings may also include specifying statistics such as median ranks with uncertainty intervals, cumulative probability curves, and the surface under the cumulative ranking (SUCRA) curve.(19,36,51) Figure 6.”
BackgroundGetReal in network meta-analysis: a review of the methodology
Efthimiou, O., Debray, T. P. A., van Valkenhoef, G., Trelle, S., Panayidou, K., Moons, K. G. M., Reitsma, J. B., Shang, A., Salanti, G., & on behalf of GetReal Methods Review Group (2016) · Research Synthesis Methods · doi:10.1002/jrsm.1195 · Cited by 401
“2016, 7 236–263 2 4 6 (2013), and Zhang et al. (2013); some papers used STATA (StataCorp., 2013): Ballesteros (2005), Chaimani et al. (2013a), Franchini et al. (2012), Higgins et al. (2012), Jonas et al. (2013), Madan et al. (2011), Norton et al. (2012), Tu and Faggion (2012), Veroniki et al.…”
BackgroundMethodResultInfluentialSelf-citationPalmer, S. C., Mavridis, D., Navarese, E., Craig, J. C., Tonelli, M., Salanti, G., Wiebe, N., Ruospo, M., Wheeler, D. C., & Strippoli, G. F. M. (2015) · The Lancet · doi:10.1016/s0140-6736(14)62459-4 · Cited by 395
Self-citationCuijpers, P., Quero, S., Noma, H., Ciharova, M., Miguel, C., Karyotaki, E., Cipriani, A., Cristea, I. A., & Furukawa, T. A. (2021) · World Psychiatry · doi:10.1002/wps.20860 · Cited by 388
Zhou, X., Teng, T., Zhang, Y., Del Giovane, C., Furukawa, T. A., Weisz, J. R., Li, X., Cuijpers, P., Coghill, D., Xiang, Y., et al. (2020) · The Lancet Psychiatry · doi:10.1016/s2215-0366(20)30137-1 · Cited by 367
Black, C. J., Staudacher, H. M., & Ford, A. C. (2022) · Gut · doi:10.1136/gutjnl-2021-325214 · Cited by 353
Miura, T., Noma, H., Furukawa, T. A., Mitsuyasu, H., Tanaka, S., Stockton, S., Salanti, G., Motomura, K., Shimano-Katsuki, S., Leucht, S., et al. (2014) · The Lancet Psychiatry · doi:10.1016/s2215-0366(14)70314-1 · Cited by 364
Self-citationBratton, D. J., Gaisl, T., Wons, A. M., & Kohler, M. (2015) · JAMA · doi:10.1001/jama.2015.16303 · Cited by 362
Siontis, G. C. M., Stefanini, G. G., Mavridis, D., Siontis, K. C., Alfonso, F., Pérez-Vizcayno, M. J., Byrne, R. A., Kastrati, A., Meier, B., Salanti, G., et al. (2015) · The Lancet · doi:10.1016/s0140-6736(15)60657-2 · Cited by 349
Self-citationMoser, W., Schindler, C., & Keiser, J. (2017) · BMJ · doi:10.1136/bmj.j4307 · Cited by 350
Ribassin-Majed, L., Marguet, S., Lee, A. W. M., Ng, W. T., Ma, J., Chan, A. T. C., Huang, P.-Y., Zhu, G., Chua, D. T. T., Chen, Y., et al. (2017) · Journal of Clinical Oncology · doi:10.1200/jco.2016.67.4119 · Cited by 352
Veroniki, A. A., Cogo, E., Rios, P., Straus, S. E., Finkelstein, Y., Kealey, R., Reynen, E., Soobiah, C., Thavorn, K., Hutton, B., et al. (2017) · BMC Medicine · doi:10.1186/s12916-017-0845-1 · Cited by 339
“The comparison-adjusted funnel plot was used to assess publication bias and small-study effects for outcomes including at least 10 studies [20].”
Caldwell, D. M., Davies, S. R., Hetrick, S. E., Palmer, J. C., Caro, P., López-López, J. A., Gunnell, D., Kidger, J., Thomas, J., French, C., et al. (2019) · The Lancet Psychiatry · doi:10.1016/s2215-0366(19)30403-1 · Cited by 336
Cipriani, A., Furukawa, T. A., Salanti, G., Chaimani, A., Atkinson, L. Z., Ogawa, Y., Leucht, S., Ruhe, H. G., Turner, E. H., Higgins, J. P. T., et al. (2018) · Focus · doi:10.1176/appi.focus.16407 · Cited by 328
Self-citationNaci, H., Salcher-Konrad, M., Dias, S., Blum, M. R., Sahoo, S. A., Nunan, D., & Ioannidis, J. P. A. (2019) · British Journal of Sports Medicine · doi:10.1136/bjsports-2018-099921 · Cited by 326
“Characteristics of exercise and medication RCTs RCTs of exercise interventions included substantially fewer participants; average sample size in exercise RCTs was 53 (range: 15-464) compared to 139 in RCTs of beta-blockers (7-1092), 174 in studies of ACE-inhibitors (14-625), 188 for diuretics (24-2776), 185 for CCBs (…”
ResultComparative Effectiveness of First-Line Medications for Primary Open-Angle Glaucoma
Li, T., Lindsley, K., Rouse, B., Hong, H., Shi, Q., Friedman, D. S., Wormald, R., & Dickersin, K. (2016) · Ophthalmology · doi:10.1016/j.ophtha.2015.09.005 · Cited by 320
“Rankings based on SUCRA values account better for the uncertainly in the estimated treatment effect.(15,16) All rankings used “placebo/vehicle/no treatment” as the reference group.”
BackgroundMethodInfluentialVisualizing Assumptions and Results in Network Meta-analysis: The Network Graphs Package
Chaimani, A., & Salanti, G. (2015) · The Stata Journal: Promoting communications on statistics and Stata · doi:10.1177/1536867x1501500402 · Cited by 323
“Differences in the relative effects between small and large trials in a network of interventions often challenge the interpretation of the pairwise summary effects and need exploration (Chaimani et al. 2013b; Moreno et al. 2011).”
InfluentialSelf-citationEfficacy and safety of COVID-19 vaccines
Graña, C., Ghosn, L., Evrenoglou, T., Jarde, A., Minozzi, S., Bergman, H., Buckley, B. S., Probyn, K., Villanueva, G., Henschke, N., et al. (2022) · Cochrane Database of Systematic Reviews · doi:10.1002/14651858.cd015477 · Cited by 310
Self-citationNikolakopoulou, A., White, I. R., & Salanti, G. (2020) · Handbook of Meta-Analysis · doi:10.1201/9781315119403-10 · Cited by 303
Self-citationSamara, M. T., Dold, M., Gianatsi, M., Nikolakopoulou, A., Helfer, B., Salanti, G., & Leucht, S. (2016) · JAMA Psychiatry · doi:10.1001/jamapsychiatry.2015.2955 · Cited by 300
Self-citationBlack, C. J., Thakur, E. R., Houghton, L. A., Quigley, E. M. M., Moayyedi, P., & Ford, A. C. (2020) · Gut · doi:10.1136/gutjnl-2020-321191 · Cited by 299
Undertaking network meta‐analyses
Chaimani, A., Caldwell, D. M., Li, T., Higgins, J. P., & Salanti, G. (2019) · Cochrane Handbook for Systematic Reviews of Interventions · doi:10.1002/9781119536604.ch11 · Cited by 213
Self-citationDe Crescenzo, F., Ciabattini, M., D’Alò, G. L., De Giorgi, R., Del Giovane, C., Cassar, C., Janiri, L., Clark, N., Ostacher, M. J., & Cipriani, A. (2018) · PLOS Medicine · doi:10.1371/journal.pmed.1002715 · Cited by 274
“We incorporated indirect comparisons with direct comparisons using random-effects network meta-analyses within a frequentist framework using STATA (network package), and results are presented with the network graphs package [20].”
MethodShen, N. T., Maw, A., Tmanova, L. L., Pino, A., Ancy, K., Crawford, C. V., Simon, M. S., & Evans, A. T. (2017) · Gastroenterology · doi:10.1053/j.gastro.2017.02.003 · Cited by 273
Schwingshackl, L., Chaimani, A., Hoffmann, G., Schwedhelm, C., & Boeing, H. (2018) · European Journal of Epidemiology · doi:10.1007/s10654-017-0352-x · Cited by 273
“We also produced the comparison-adjusted funnel plot [36] and fit a network meta-regression model to assess the magnitude of funnel plot asymmetry for the primary outcome.”
MethodSelf-citationAl-Moraissi, E. A., Wolford, L. M., Ellis, E., & Neff, A. (2020) · Journal of Cranio-Maxillofacial Surgery · doi:10.1016/j.jcms.2019.10.004 · Cited by 266
Anti-vascular endothelial growth factor for diabetic macular oedema: a network meta-analysis
Virgili, G., Parravano, M., Evans, J. R., Gordon, I., & Lucenteforte, E. (2017) · Cochrane Database of Systematic Reviews · doi:10.1002/14651858.cd007419.pub5 · Cited by 228
Fodor, L. A., Georgescu, R., Cuijpers, P., Szamoskozi, Ş., David, D., Furukawa, T. A., & Cristea, I. A. (2020) · The Lancet Psychiatry · doi:10.1016/s2215-0366(20)30130-9 · Cited by 258
Terkawi, A. S., Mavridis, D., Sessler, D. I., Nunemaker, M. S., Doais, K. S., Terkawi, R. S., Terkawi, Y. S., Petropoulou, M., & Nemergut, E. C. (2017) · Anesthesiology · doi:10.1097/aln.0000000000001607 · Cited by 255
“Treatment rankings based on SUCRA scores, from largest to smallest, were F/O (92), ITM (81), F/S (78), PA (69), LP/S (67), LB (63), ACB/S (60), FIC (57), F (46), EA (40), ACB (38), LP (21), placebo (21), O (12), and finally PCA (6).”
Self-citationSystemic treatments for metastatic cutaneous melanoma
Pasquali, S., Hadjinicolaou, A. V., Chiarion Sileni, V., Rossi, C. R., & Mocellin, S. (2018) · Cochrane Database of Systematic Reviews · doi:10.1002/14651858.cd011123.pub2 · Cited by 237
Kim, M. S., An, M. H., Kim, W. J., & Hwang, T.-H. (2020) · PLOS Medicine · doi:10.1371/journal.pmed.1003501 · Cited by 246
“Data synthesis and statistical analysis We conducted a random-effects NMA within a frequentist framework using STATA (Stata Corp, College Station, Texas, United States of America, version 15.0) and R (version 3.6.0) software [25].”
MethodInfluentialRiley, R. D., Jackson, D., Salanti, G., Burke, D. L., Price, M., Kirkham, J., & White, I. R. (2017) · BMJ · doi:10.1136/bmj.j3932 · Cited by 247
Self-citationZhang, Y., Zhang, C., Shu, J., Guo, J., Chang, H.-M., Leung, P. C. K., Sheng, J.-Z., & Huang, H. (2020) · Human Reproduction Update · doi:10.1093/humupd/dmz046 · Cited by 230
Network Meta-Analysis and Cost-Effectiveness Analysis of New Generation Antidepressants
Khoo, A. L., Zhou, H. J., Teng, M., Lin, L., Zhao, Y. J., Soh, L. B., Mok, Y. M., Lim, B. P., & Gwee, K. P. (2015) · CNS Drugs · doi:10.1007/s40263-015-0267-6 · Cited by 228
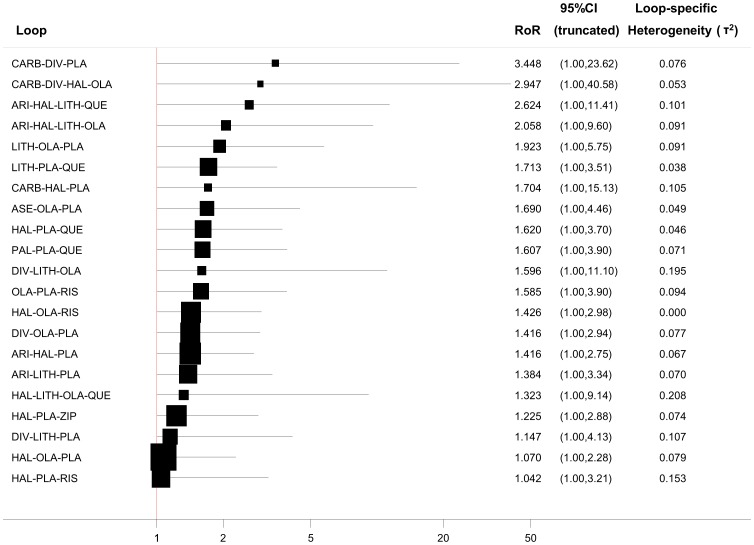
“For the local test, we used the loop-specific approach [17] where the inconsistency factor was evaluated, using the ifplot command in STATA software [14], for every closed loop formed by either three or four treatments in the network.”
MethodInterventions for the management of malignant pleural effusions: a network meta-analysis
Clive, A. O., Jones, H. E., Bhatnagar, R., Preston, N. J., & Maskell, N. (2016) · Cochrane Database of Systematic Reviews · doi:10.1002/14651858.cd010529.pub2 · Cited by 228
Zeng, C., Wei, J., Persson, M. S. M., Sarmanova, A., Doherty, M., Xie, D., Wang, Y., Li, X., Li, J., Long, H., et al. (2018) · British Journal of Sports Medicine · doi:10.1136/bjsports-2017-098043 · Cited by 223
Lack of evidence to favor specific preventive interventions in psychosis: a network meta‐analysis
Davies, C., Cipriani, A., Ioannidis, J. P. A., Radua, J., Stahl, D., Provenzani, U., McGuire, P., & Fusar‐Poli, P. (2018) · World Psychiatry · doi:10.1002/wps.20526 · Cited by 229
Veroniki, A. A., Rios, P., Cogo, E., Straus, S. E., Finkelstein, Y., Kealey, R., Reynen, E., Soobiah, C., Thavorn, K., Hutton, B., et al. (2017) · BMJ Open · doi:10.1136/bmjopen-2017-017248 · Cited by 222
“16 For each outcome with ≥ 10 studies, the comparison-adjusted funnel plot was used to assess small-study effects, 17 where the overall treatment effect for each comparison was estimated under the fixed-effect meta-analysis model.”
MethodVeroniki, A. A., Straus, S. E., Fyraridis, A., & Tricco, A. C. (2016) · Journal of Clinical Epidemiology · doi:10.1016/j.jclinepi.2016.02.016 · Cited by 219
“However, there are 6 numerous ways to present NMA results [5-9], and thi s variation makes their interpretation 7 difficult for research users [10].”
BackgroundMethodInfluentialSuijkerbuijk, Y. B., Schaafsma, F. G., van Mechelen, J. C., Ojajärvi, A., Corbière, M., & Anema, J. R. (2017) · Cochrane Database of Systematic Reviews · doi:10.1002/14651858.cd011867.pub2 · Cited by 207
Posch, F., Königsbrügge, O., Zielinski, C., Pabinger, I., & Ay, C. (2015) · Thrombosis Research · doi:10.1016/j.thromres.2015.07.011 · Cited by 215
“The trial network was graphically visualized using the user-contributed networkplot function.[26] We expressed the efficacy and safety endpoints as relative risks with 95% CIs, and pooled them using a random-effects pairwise meta-analysis model (Stata routine metan).”
MethodResultInfluentialTramacere, I., Del Giovane, C., Salanti, G., D'Amico, R., & Filippini, G. (2015) · Cochrane Database of Systematic Reviews · doi:10.1002/14651858.cd011381.pub2 · Cited by 210
Self-citationFurukawa, T. A., Salanti, G., Atkinson, L. Z., Leucht, S., Ruhe, H. G., Turner, E. H., Chaimani, A., Ogawa, Y., Takeshima, N., Hayasaka, Y., et al. (2016) · BMJ Open · doi:10.1136/bmjopen-2015-010919 · Cited by 214
“contribution of each direct meta-analysis to the entire body of evidence.(29) 30”
BackgroundSelf-citationBrown, S., Hutton, B., Clifford, T., Coyle, D., Grima, D., Wells, G., & Cameron, C. (2014) · Systematic Reviews · doi:10.1186/2046-4053-3-110 · Cited by 209
“The majority of network meta-analyses conducted to date have used WinBUGS [3], although new routines have been developed which allow network meta-analyses to be conducted with STATA [6,7,21], R [22], and SAS [23].”
BackgroundMethodInfluentialTang, H., Dai, Q., Shi, W., Zhai, S., Song, Y., & Han, J. (2017) · Diabetologia · doi:10.1007/s00125-017-4370-8 · Cited by 206
Lee, S. W. H., Chan, C. K. Y., Chua, S. S., & Chaiyakunapruk, N. (2017) · Scientific Reports · doi:10.1038/s41598-017-12987-z · Cited by 200
“Tele-education & telecasemanagement 9 1,409 96% [26] −0.”
New generation antidepressants for depression in children and adolescents: a network meta-analysis
Hetrick, S. E., McKenzie, J. E., Bailey, A. P., Sharma, V., Moller, C. I., Badcock, P. B., Cox, G., Merry, S., & Meader, N. (2021) · Cochrane Database of Systematic Reviews · doi:10.1002/14651858.cd013674.pub2 · Cited by 269
A primer on network meta-analysis with emphasis on mental health
Mavridis, D., Giannatsi, M., Cipriani, A., & Salanti, G. (2015) · Evidence Based Mental Health · doi:10.1136/eb-2015-102088 · Cited by 198
“There is a lot of ongoing research on how to evaluate the quality of evidence from a NMA.”
MethodInfluentialSelf-citationFu, J., Liu, Y., Zhang, L., Zhou, L., Li, D., Quan, H., Zhu, L., Hu, F., Li, X., Meng, S., et al. (2020) · Journal of the American Heart Association · doi:10.1161/jaha.120.016804 · Cited by 184
Black, C. J., Burr, N. E., Camilleri, M., Earnest, D. L., Quigley, E. M., Moayyedi, P., Houghton, L. A., & Ford, A. C. (2020) · Gut · doi:10.1136/gutjnl-2018-318160 · Cited by 191
Rokkas, T., Gisbert, J. P., Malfertheiner, P., Niv, Y., Gasbarrini, A., Leja, M., Megraud, F., O’Morain, C., & Graham, D. Y. (2021) · Gastroenterology · doi:10.1053/j.gastro.2021.04.012 · Cited by 185
Barberio, B., Gracie, D. J., Black, C. J., & Ford, A. C. (2023) · Gut · doi:10.1136/gutjnl-2022-328052 · Cited by 183
Giuliano, M., Schettini, F., Rognoni, C., Milani, M., Jerusalem, G., Bachelot, T., De Laurentiis, M., Thomas, G., De Placido, P., Arpino, G., et al. (2019) · The Lancet Oncology · doi:10.1016/s1470-2045(19)30420-6 · Cited by 186
Management of Frailty: A Systematic Review and Network Meta-analysis of Randomized Controlled Trials
Negm, A. M., Kennedy, C. C., Thabane, L., Veroniki, A.-A., Adachi, J. D., Richardson, J., Cameron, I. D., Giangregorio, A., Petropoulou, M., Alsaad, S. M., et al. (2019) · Journal of the American Medical Directors Association · doi:10.1016/j.jamda.2019.08.009 · Cited by 185
Wilhelmus, K. R. (2015) · Cochrane Database of Systematic Reviews · doi:10.1002/14651858.cd002898.pub5 · Cited by 178
Pasquali, S., Yim, G., Vohra, R. S., Mocellin, S., Nyanhongo, D., Marriott, P., Geh, J. I., & Griffiths, E. A. (2017) · Annals of Surgery · doi:10.1097/sla.0000000000001905 · Cited by 183
“The surface under the cumulative ranking (SUCRA) line for each treatment, which equals 1 when a treatment is certain to be the best and 0 when a treatment is certain to be the worst, was used for treatment ranking.(27,36) All statistical tests were 2-sided.”
MethodAmer, M. A., Smith, M. D., Herbison, G. P., Plank, L. D., & McCall, J. L. (2017) · Journal of British Surgery · doi:10.1002/bjs.10408 · Cited by 186
Anti-vascular endothelial growth factor for diabetic macular oedema: a network meta-analysis
Virgili, G., Parravano, M., Evans, J. R., Gordon, I., & Lucenteforte, E. (2018) · Cochrane Database of Systematic Reviews · doi:10.1002/14651858.cd007419.pub6 · Cited by 184
Combining randomized and non-randomized evidence in network meta-analysis
Efthimiou, O., Mavridis, D., Debray, T. P. A., Samara, M., Belger, M., Siontis, G. C. M., Leucht, S., Salanti, G., & 4, O. B. O. G. W. P. (2017) · Statistics in Medicine · doi:10.1002/sim.7223 · Cited by 183
“We used the network command in Stata, which implements the loop-speci fi c approach [61] and the node-splitting approach [27].”
Self-citationBangalore, S., Toklu, B., Gianos, E., Schwartzbard, A., Weintraub, H., Ogedegbe, G., & Messerli, F. H. (2017) · The American Journal of Medicine · doi:10.1016/j.amjmed.2017.01.004 · Cited by 182
Uhlig, C., Bluth, T., Schwarz, K., Deckert, S., Heinrich, L., De Hert, S., Landoni, G., Serpa Neto, A., Schultz, M. J., Pelosi, P., et al. (2016) · Anesthesiology · doi:10.1097/aln.0000000000001120 · Cited by 182
Govender, J., Loos, B., Marais, E., & Engelbrecht, A. (2014) · Journal of Pineal Research · doi:10.1111/jpi.12176 · Cited by 176
Li, B.-Z., Threapleton, D. E., Wang, J.-Y., Xu, J.-M., Yuan, J.-Q., Zhang, C., Li, P., Ye, Q.-L., Guo, B., Mao, C., et al. (2015) · BMJ · doi:10.1136/bmj.h4052 · Cited by 176
Treatments for Shoulder Impingement Syndrome: A PRISMA Systematic Review and Network Meta-Analysis
Dong, W., Goost, H., Lin, X.-B., Burger, C., Paul, C., Wang, Z.-L., Zhang, T.-Y., Jiang, Z.-C., Welle, K., & Kabir, K. (2015) · Medicine · doi:10.1097/md.0000000000000510 · Cited by 174
“Then, the rank probability data were imported into STATA, which then produced surface plots under the cumulative ranking (SUCRA) curve.(45) Medicine Volume 94, Number 10, March 2015”
MethodKaram, G., Agarwal, A., Sadeghirad, B., Jalink, M., Hitchcock, C. L., Ge, L., Kiflen, R., Ahmed, W., Zea, A. M., Milenkovic, J., et al. (2023) · BMJ · doi:10.1136/bmj-2022-072003 · Cited by 192
Yamada, T., Shojima, N., Noma, H., Yamauchi, T., & Kadowaki, T. (2017) · Intensive Care Medicine · doi:10.1007/s00134-016-4523-0 · Cited by 171
Interventions for myopia control in children: a living systematic review and network meta-analysis
Lawrenson, J. G., Shah, R., Huntjens, B., Downie, L. E., Virgili, G., Dhakal, R., Verkicharla, P. K., Li, D., Mavi, S., Kernohan, A., et al. (2023) · Cochrane Database of Systematic Reviews · doi:10.1002/14651858.cd014758.pub2 · Cited by 164
Ballesio, A., Aquino, M. R. J. V., Feige, B., Johann, A. F., Kyle, S. D., Spiegelhalder, K., Lombardo, C., Rücker, G., Riemann, D., & Baglioni, C. (2018) · Sleep Medicine Reviews · doi:10.1016/j.smrv.2017.01.006 · Cited by 172
Burr, N. E., Gracie, D. J., Black, C. J., & Ford, A. C. (2022) · Gut · doi:10.1136/gutjnl-2021-326390 · Cited by 164
Black, C. J., Yuan, Y., Selinger, C. P., Camilleri, M., Quigley, E. M. M., Moayyedi, P., & Ford, A. C. (2020) · The Lancet Gastroenterology & Hepatology · doi:10.1016/s2468-1253(19)30324-3 · Cited by 171
Dou, K.-X., Tan, M.-S., Tan, C.-C., Cao, X.-P., Hou, X.-H., Guo, Q.-H., Tan, L., Mok, V., & Yu, J.-T. (2018) · Alzheimer's Research & Therapy · doi:10.1186/s13195-018-0457-9 · Cited by 171
Zhao, Y., Liu, J., Cai, X., Pan, Z., Liu, J., Yin, W., Chen, H., Xie, Z., Liang, H., Wang, W., et al. (2019) · BMJ · doi:10.1136/bmj.l5460 · Cited by 170
Tang, H. L., Li, D. D., Zhang, J. J., Hsu, Y. H., Wang, T. S., Zhai, S. D., & Song, Y. Q. (2016) · Diabetes, Obesity and Metabolism · doi:10.1111/dom.12742 · Cited by 161
“1 using the “mvmeta” command and programmed STATA routines.(18,19) For a zero-event RCT, a 0.”
Method
Metadata
- Authors
- Chaimani, A., Higgins, J. P. T., Mavridis, D., Spyridonos, P., & Salanti, G.
- Affiliations
- University of Ioannina (GR)
- University of Bristol (GB)
- Corresponding author
- Salanti, Georgia
- Venue
- PLoS ONE
- Publisher
- Public Library of Science (PLoS)
- Published
- 2013-10-03
- Volume
- 8
- Issue
- 10
- Pages
- e76654
- ISSN
- 1932-6203 (ISSN-L)
- PMC
- PMC3789683
- OpenAlex
- W2091808438
- Semantic Scholar
- c99555607f865f8e0d32e5054195b29ccecc06cf
- Cited by
- 2,473
- References
- 51
- Citations by year
- 2026: 222 · 2025: 237 · 2024: 256 · 2023: 252 · 2022: 267 · 2021: 298 · 2020: 228 · 2019: 186 · 2018: 182 · 2017: 154 · 2016: 99 · 2015: 65 · 2014: 26 · 2013: 1
- FWCI
- 70.14
- Type
- journal article
- Language
- en
- Open access
- gold
- doi.org
- Locations
- PLoS ONE (publishedVersion, cc-by)
- Europe PMC (PubMed Central) (publishedVersion, cc-by)
- PubMed Central (publishedVersion, cc-by)
- PubMed (publishedVersion)
- RePEc: Research Papers in Economics (submittedVersion)
- DOAJ (DOAJ: Directory of Open Access Journals) (submittedVersion)
- Figshare (submittedVersion, cc-by)
- Bristol Research (University of Bristol) (submittedVersion)
- Funders
- FP7 Ideas: European Research Council (260559)
- Topics
- Social Sciences › Decision Sciences › Statistics, Probability and Uncertainty › Meta-analysis and systematic reviews
- Physical Sciences › Mathematics › Statistics and Probability › Statistical Methods in Clinical Trials
- Social Sciences › Sociology and Political Science › Delphi Technique in Research
- Keywords
- network meta-analysis, graphical tools, treatment ranking, non-statisticians
- MeSH terms
- Acute Disease, Arthritis, Rheumatoid, Bipolar Disorder, Data Interpretation, Statistical, Humans, Research Design, Meta-Analysis as Topic, Models, Statistical, Odds Ratio, Treatment Outcome, Antirheumatic Agents, Antimanic Agents
About these checks
Registry, retraction, Cites and statistics results are computed, not judged, with one exception: a printed reference that no index lists is read once by a model before it counts as a citation error. Claims are extracted by a model and kept only when their quote appears verbatim in the text; each cited source is then checked, with a model’s help, for whether it says what the claim relies on. Those verdicts can be wrong — read the claim’s quote and the cited source before relying on one.
Statistics and arithmetic are recomputed, not judged.
Confidence bands are shown only for fields calibrated on our annotated test set. None is calibrated yet, so no band is shown.
What counts as a claim ›How we measure confidence ›How we check this ›
Are you an author, or do you see a problem with this page? Request a review
Data sources
Bibliographic data: Semantic Scholar, OpenAlex, Crossref.
Contains information from the Semantic Scholar Academic Graph Datasets, made available under the ODC Attribution License (ODC-BY 1.0).
Semantic Scholar’s data is described in: Kinney, R., et al. (2023). The Semantic Scholar Open Data Platform. arXiv:2301.10140.
