

The DOI matches its Crossref record; 54 of the 54 references it cites were found in a registry or an index.
Functional Reorganization of the Default Mode Network across Chronic Pain Conditions
Open accessAbstract
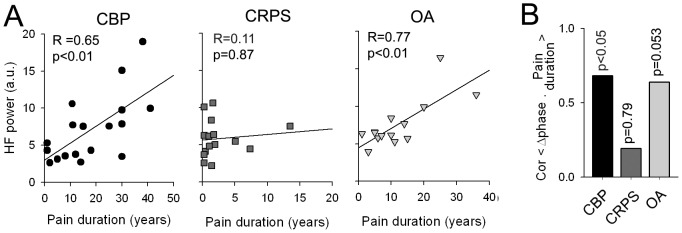
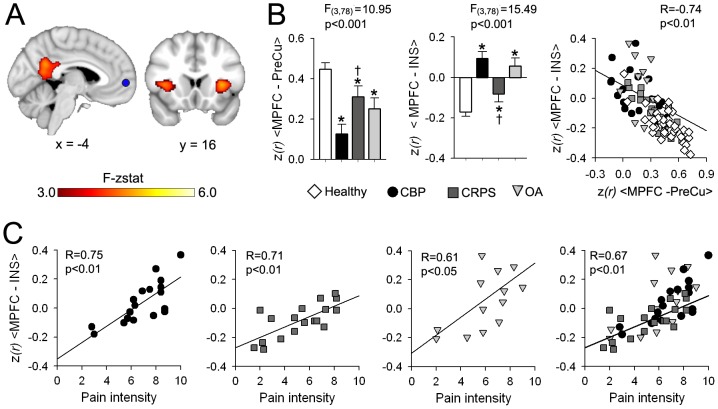
Chronic pain is associated with neuronal plasticity. Here we use resting-state functional magnetic resonance imaging to investigate functional changes in patients suffering from chronic back pain (CBP), complex regional pain syndrome (CRPS) and knee osteoarthritis (OA). We isolated five meaningful resting-state networks across the groups, of which only the default mode network (DMN) exhibited deviations from healthy controls. All patient groups showed decreased connectivity of medial prefrontal cortex (MPFC) to the posterior constituents of the DMN, and increased connectivity to the insular cortex in proportion to the intensity of pain. Multiple DMN regions, especially the MPFC, exhibited increased high frequency oscillations, conjoined with decreased phase locking with parietal regions involved in processing attention. Both phase and frequency changes correlated to pain duration in OA and CBP patients. Thus chronic pain seems to reorganize the dynamics of the DMN and as such reflect the maladaptive physiology of different types of chronic pain.
Overview
The claims and statistics of this paper haven’t been checked yet.
Run the check — free, no account needed. It reads the open-access text and checks the sources it cites.
Integrity signals
Registry
Cites
Statistics
Figures
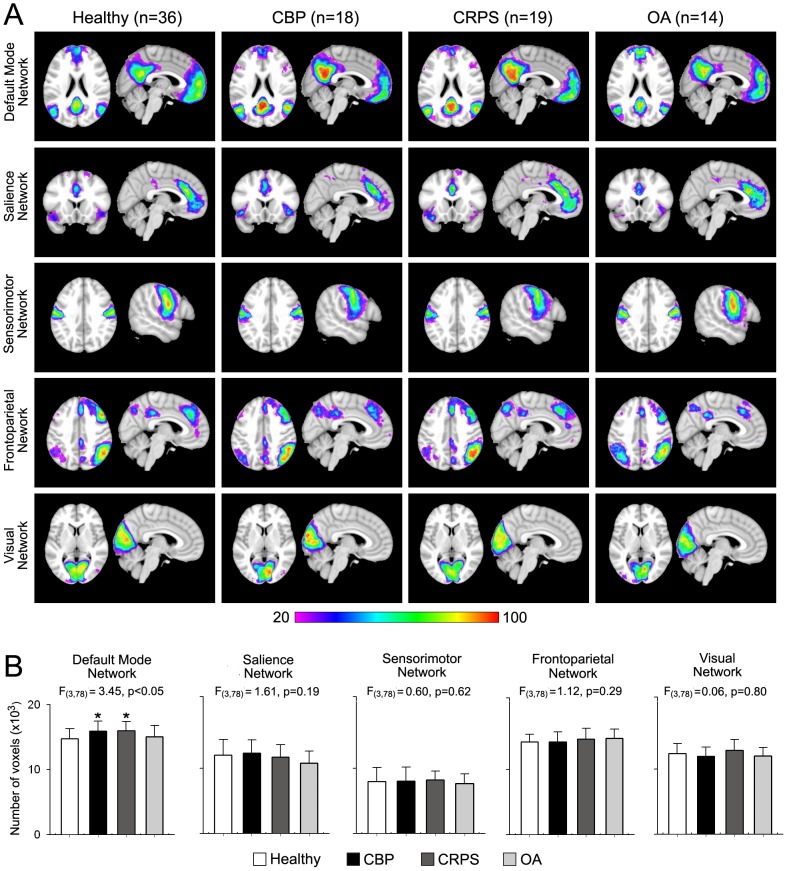
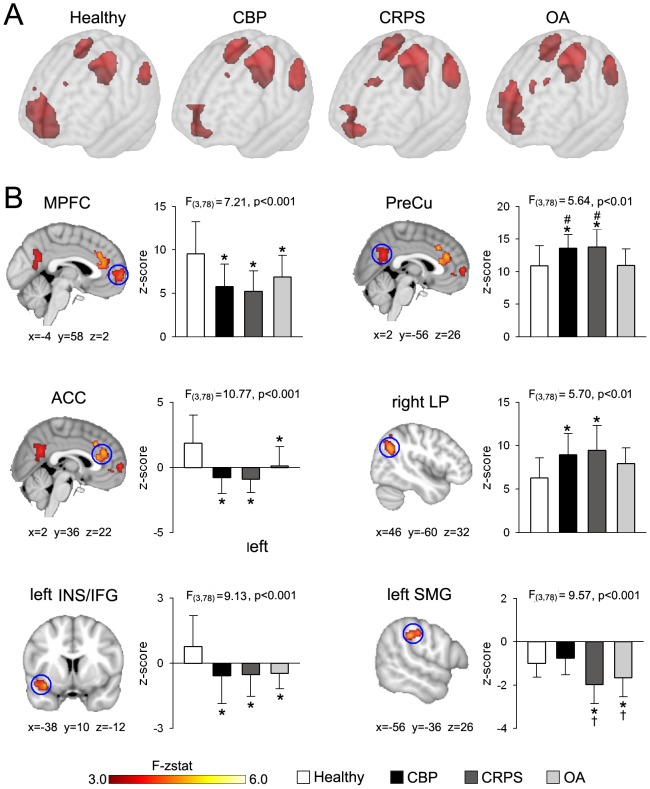
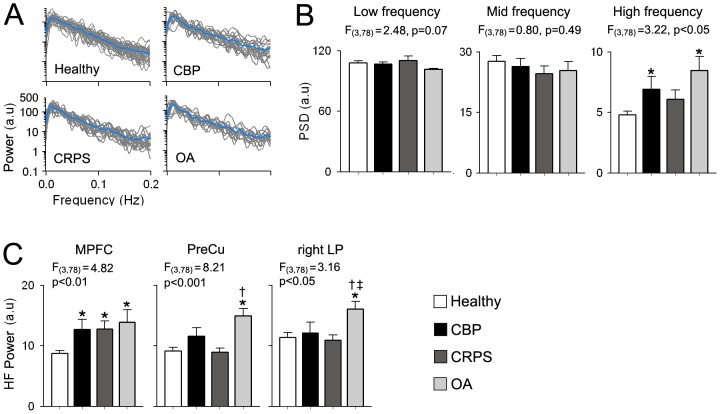
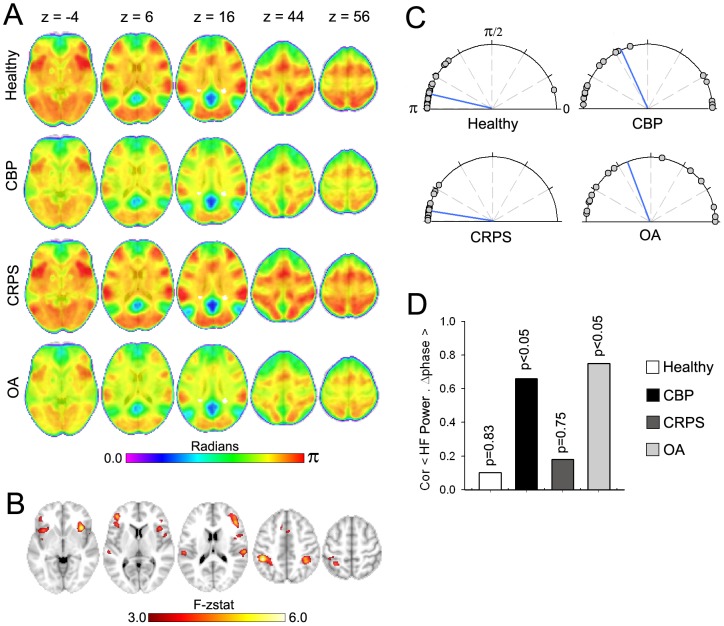
Verification
Claims the paper makes
The claims and statistics of this paper haven’t been checked yet.
Run the check — free, no account needed. It reads the open-access text and checks the sources it cites.
Claims other papers make about this one
Each is checked against this paper’s own text: does it say what the citing paper says it does?
In the citing paper
“psychosocial variables such as depression, anxiety, and distress are among the most potent and robust predictors of the transition from acute to chronic pain 13–18.”
From Evaluating psychosocial contributions to chronic pain outcomes (2018) · cites this paper as [17]
In the citing paper
“the development of an enduring pain condition confers a substantially increased vulnerability for the subsequent diagnosis of an affective disorder”
From Evaluating psychosocial contributions to chronic pain outcomes (2018) · cites this paper as [17]
In the citing paper
“longitudinal, observational research supports a strong bidirectional link between mood disorders and persistent pain”
From Evaluating psychosocial contributions to chronic pain outcomes (2018) · cites this paper as [17]
Self-check
Percentages, sums and reported differences re-computed from the paper’s own numbers.
The self-check needs the paper’s full text.
Citations
Cites
Advances in functional and structural MR image analysis and implementation as FSL
Smith, S. M., Jenkinson, M., Woolrich, M. W., Beckmann, C. F., Behrens, T. E. J., Johansen-Berg, H., Bannister, P. R., De Luca, M., Drobnjak, I., Flitney, D. E., et al. (2004) · NeuroImage · doi:10.1016/j.neuroimage.2004.07.051 · Cited by 13,630
A default mode of brain function
Raichle, M. E., MacLeod, A. M., Snyder, A. Z., Powers, W. J., Gusnard, D. A., & Shulman, G. L. (2001) · Proceedings of the National Academy of Sciences · doi:10.1073/pnas.98.2.676 · Cited by 12,190
The Brain's Default Network: Anatomy, Function, and Relevance to Disease
Buckner, R. L., Andrews‐Hanna, J. R., & Schacter, D. L. (2008) · Annals of the New York Academy of Sciences · doi:10.1196/annals.1440.011 · Cited by 9,761
Voxel-Based Morphometry—The Methods
Ashburner, J., & Friston, K. J. (2000) · NeuroImage · doi:10.1006/nimg.2000.0582 · Cited by 8,676
The human brain is intrinsically organized into dynamic, anticorrelated functional networks
Fox, M. D., Snyder, A. Z., Vincent, J. L., Corbetta, M., Van Essen, D. C., & Raichle, M. E. (2005) · Proceedings of the National Academy of Sciences · doi:10.1073/pnas.0504136102 · Cited by 8,553
A global optimisation method for robust affine registration of brain images
Jenkinson, M., & Smith, S. M. (2001) · Medical Image Analysis · doi:10.1016/s1361-8415(01)00036-6 · Cited by 7,018
Functional connectivity in the resting brain: a network analysis of the default mode hypothesis
Greicius, M. D., Krasnow, B., Reiss, A. L., & Menon, V. (2003) · Proceedings of the National Academy of Sciences · doi:10.1073/pnas.0135058100 · Cited by 6,358
Correspondence of the brain's functional architecture during activation and rest
Smith, S. M., Fox, P. T., Miller, K. L., Glahn, D. C., Fox, P. M., Mackay, C. E., Filippini, N., Watkins, K. E., Toro, R., Laird, A. R., et al. (2009) · Proceedings of the National Academy of Sciences · doi:10.1073/pnas.0905267106 · Cited by 5,150
The precuneus: a review of its functional anatomy and behavioural correlates
Cavanna, A. E., & Trimble, M. R. (2006) · Brain · doi:10.1093/brain/awl004 · Cited by 5,128
A Voxel-Based Morphometric Study of Ageing in 465 Normal Adult Human Brains
Good, C. D., Johnsrude, I. S., Ashburner, J., Henson, R. N. A., Friston, K. J., & Frackowiak, R. S. J. (2001) · NeuroImage · doi:10.1006/nimg.2001.0786 · Cited by 4,561
Cited by
Sorted by citations
Do we need a third mechanistic descriptor for chronic pain states?
Kosek, E., Cohen, M. L., Baron, R., Gebhart, G. F., Micó, J. A., Rice, A. S. C., Rief, W., & Sluka, K. A. (2016) · Pain · doi:10.1097/j.pain.0000000000000507 · Cited by 972
The role of psychosocial processes in the development and maintenance of chronic pain
Edwards, R. R., Dworkin, R. H., Sullivan, M. D., Turk, D. C., & Wasan, A. D. (2016) · The Journal of Pain · doi:10.1016/j.jpain.2016.01.001 · Cited by 954
Role of the Prefrontal Cortex in Pain Processing
Ong, W., Stohler, C. S., & Herr, D. R. (2018) · Molecular Neurobiology · doi:10.1007/s12035-018-1130-9 · Cited by 824
On testing for spatial correspondence between maps of human brain structure and function
Alexander-Bloch, A. F., Shou, H., Liu, S., Satterthwaite, T. D., Glahn, D. C., Shinohara, R. T., Vandekar, S. N., & Raznahan, A. (2018) · NeuroImage · doi:10.1016/j.neuroimage.2018.05.070 · Cited by 947
Nociception, pain, negative moods, and behavior selection
Baliki, M. N., & Apkarian, A. V. (2015) · Neuron · doi:10.1016/j.neuron.2015.06.005 · Cited by 731
Self-citationEvaluating psychosocial contributions to chronic pain outcomes
Meints, S. M., & Edwards, R. R. (2018) · Progress in Neuro-Psychopharmacology and Biological Psychiatry · doi:10.1016/j.pnpbp.2018.01.017 · Cited by 719
Structural plasticity and reorganisation in chronic pain
Kuner, R., & Flor, H. (2016) · Nature reviews. Neuroscience · doi:10.1038/nrn.2016.162 · Cited by 700
Evidence for a large-scale brain system supporting allostasis and interoception in humans
Kleckner, I. R., Zhang, J., Touroutoglou, A., Chanes, L., Xia, C., Simmons, W. K., Quigley, K. S., Dickerson, B. C., & Feldman Barrett, L. (2017) · Nature Human Behaviour · doi:10.1038/s41562-017-0069 · Cited by 641
Kucyi, A., & Davis, K. D. (2015) · Trends in Neurosciences · doi:10.1016/j.tins.2014.11.006 · Cited by 587
Vlaeyen, J. W. S., Maher, C. G., Wiech, K., Van Zundert, J., Meloto, C. B., Diatchenko, L., Battié, M. C., Goossens, M., Koes, B., & Linton, S. J. (2018) · Nature Reviews Disease Primers · doi:10.1038/s41572-018-0052-1 · Cited by 497
Assessment of Chronic Pain: Domains, Methods, and Mechanisms
Fillingim, R. B., Loeser, J. D., Baron, R., & Edwards, R. R. (2016) · Journal of Pain · doi:10.1016/j.jpain.2015.08.010 · Cited by 422
Cellular Circuits in the Brain and Their Modulation in Acute and Chronic Pain
Kuner, R., & Kuner, T. (2020) · Physiological Reviews · doi:10.1152/physrev.00040.2019 · Cited by 371
Brain changes associated with cognitive and emotional factors in chronic pain: A systematic review
Malfliet, A., Coppieters, I., Van Wilgen, P., Kregel, J., De Pauw, R., Dolphens, M., & Ickmans, K. (2017) · European Journal of Pain · doi:10.1002/ejp.1003 · Cited by 342
Brain imaging tests for chronic pain: medical, legal and ethical issues and recommendations
Davis, K. D., Flor, H., Greely, H. T., Iannetti, G. D., Mackey, S., Ploner, M., Pustilnik, A. C., Tracey, I., Treede, R., & Wager, T. D. (2017) · Nature Reviews Neurology · doi:10.1038/nrneurol.2017.122 · Cited by 321
Neuroplasticity Underlying the Comorbidity of Pain and Depression
Doan, L., Manders, T. R., & Wang, J. (2015) · Neural Plasticity · doi:10.1155/2015/504691 · Cited by 304
The anatomy of pain and suffering in the brain and its clinical implications
Ridder, D. D., Adhia, D. B., & Vanneste, S. (2021) · Neuroscience & Biobehavioral Reviews · doi:10.1016/j.neubiorev.2021.08.013 · Cited by 298
Genome-wide association study of multisite chronic pain in UK Biobank
Johnston, K. J. A., Adams, M. J., Nicholl, B. I., Ward, J., Strawbridge, R. J., Ferguson, A., McIntosh, A. M., Bailey, M. E. S., & Smıth, D. J. (2019) · PLoS Genetics · doi:10.1371/journal.pgen.1008164 · Cited by 270
Electroencephalographic Patterns in Chronic Pain: A Systematic Review of the Literature
Pinheiro, E. S. D. S., de Queirós, F. C., Montoya, P., Luz-Santos, C., do Nascimento, M. A., Ito, C. H., Silva, M. M. P., Santos, D. B. N., Benevides, S. D., Miranda, J. G. V., et al. (2016) · PLoS ONE · doi:10.1371/journal.pone.0149085 · Cited by 299
Sex and gender differences in pain
Osborne, N. R., & Davis, K. D. (2022) · International review of neurobiology · doi:10.1016/bs.irn.2022.06.013 · Cited by 261
Frontostriatal Gating of Tinnitus and Chronic Pain
Rauschecker, J. P., May, E. S., Maudoux, A., & Ploner, M. (2015) · Trends in Cognitive Sciences · doi:10.1016/j.tics.2015.08.002 · Cited by 261
Complex regional pain syndrome — phenotypic characteristics and potential biomarkers
Birklein, F., Ajit, S. K., Göebel, A., Perez, R. S. G. M., & Sommer, C. (2018) · Nature Reviews Neurology · doi:10.1038/nrneurol.2018.20 · Cited by 244
Hemington, K. S., Wu, Q., Kucyi, A., Inman, R. D., & Davis, K. D. (2016) · Brain Structure and Function · doi:10.1007/s00429-015-1161-1 · Cited by 220
Deciphering nociplastic pain: clinical features, risk factors and potential mechanisms
Kaplan, C. M., Kelleher, E. M., Irani, A., Schrepf, A., Clauw, D. J., & Harte, S. E. (2024) · Nature Reviews Neurology · doi:10.1038/s41582-024-00966-8 · Cited by 231
Burst and Tonic Spinal Cord Stimulation: Different and Common Brain Mechanisms
Ridder, D. D., & Vanneste, S. (2015) · Neuromodulation Technology at the Neural Interface · doi:10.1111/ner.12368 · Cited by 215
Pathology of pain and its implications for therapeutic interventions
Cao, B., Xu, Q., Shi, Y., Zhao, R., Li, H., Zheng, J., Liu, F., Wan, Y., & Wei, B. (2024) · Signal Transduction and Targeted Therapy · doi:10.1038/s41392-024-01845-w · Cited by 236
Animal models of chronic pain: Advances and challenges for clinical translation
Burma, N. E., Leduc‐Pessah, H., Fan, C. Y., & Trang, T. (2016) · Journal of Neuroscience Research · doi:10.1002/jnr.23768 · Cited by 198
Disruption of default mode network dynamics in acute and chronic pain states
Alshelh, Z., Marciszewski, K. K., Akhter, R., Pietro, F. D., Mills, E. P., Vickers, E. R., Peck, C. C., Murray, G. M., & Henderson, L. A. (2017) · NeuroImage Clinical · doi:10.1016/j.nicl.2017.10.019 · Cited by 182
Trouvin, A., & Perrot, S. (2019) · Best Practice & Research Clinical Rheumatology · doi:10.1016/j.berh.2019.04.007 · Cited by 176
Psychological Interventions for the Treatment of Chronic Pain in Adults
Driscoll, M. A., Edwards, R. R., Becker, W. C., Kaptchuk, T. J., & Kerns, R. D. (2021) · Psychological Science in the Public Interest · doi:10.1177/15291006211008157 · Cited by 176
A comprehensive literature review of chronic pain and memory
Mazza, S., Frot, M., & Rey, A. E. (2017) · Progress in Neuro-Psychopharmacology and Biological Psychiatry · doi:10.1016/j.pnpbp.2017.08.006 · Cited by 170
Pain and the Triple Network Model
Ridder, D. D., Vanneste, S., Smith, M. L., & Adhia, D. B. (2022) · Frontiers in Neurology · doi:10.3389/fneur.2022.757241 · Cited by 189
Soni, A., Wanigasekera, V., Mezue, M., Cooper, C. C., Javaid, M. K., Price, A. J., & Tracey, I. (2018) · Arthritis & Rheumatology · doi:10.1002/art.40749 · Cited by 173
The Neural Code for Pain: From Single-Cell Electrophysiology to the Dynamic Pain Connectome
Kucyi, A., & Davis, K. D. (2016) · The Neuroscientist · doi:10.1177/1073858416667716 · Cited by 152
Ng, S. K., Urquhart, D. M., Fitzgerald, P. B., Cicuttini, F., Hussain, S. M., & Fitzgibbon, B. M. (2017) · Clinical Journal of Pain · doi:10.1097/ajp.0000000000000534 · Cited by 150
Burning mouth syndrome: a systematic review of treatments
Liu, Y., Kim, Y., Yoo, T. T., Han, P., & Inman, J. C. (2017) · Oral Diseases · doi:10.1111/odi.12660 · Cited by 140
DaSilva, A. F. M., Truong, D. Q., DosSantos, M. F. H., Toback, R. L., Datta, A., & Bikson, M. (2015) · Frontiers in Neuroanatomy · doi:10.3389/fnana.2015.00089 · Cited by 133
Voltage-Gated Ion Channels in the PNS: Novel Therapies for Neuropathic Pain?
Tibbs, G. R., Posson, D. J., & Goldstein, P. A. (2016) · Trends in Pharmacological Sciences · doi:10.1016/j.tips.2016.05.002 · Cited by 122
Tu, Y., Jung, M., Gollub, R. L., Napadow, V., Gerber, J. A., Ortiz, A., Lang, C., Mawla, I., Shen, W., Chan, S., et al. (2019) · Pain · doi:10.1097/j.pain.0000000000001507 · Cited by 127
Network-level reorganisation of functional connectivity following arm amputation
Makin, T. R., Filippini, N., Duff, E. P., Slater, D. H., Tracey, I., & Johansen‐Berg, H. (2015) · NeuroImage · doi:10.1016/j.neuroimage.2015.02.067 · Cited by 123
Coppieters, I., Meeus, M., Kregel, J., Caeyenberghs, K., Pauw, R. D., Goubert, D., & Cagnie, B. J. (2016) · Journal of Pain · doi:10.1016/j.jpain.2016.04.005 · Cited by 124
The Co-occurrence of Pediatric Chronic Pain and Depression
Soltani, S., Kopala‐Sibley, D. C., & Noel, M. E. (2019) · Clinical Journal of Pain · doi:10.1097/ajp.0000000000000723 · Cited by 124
Chronic pain and psychedelics: a review and proposed mechanism of action
Castellanos, J. P., Woolley, C., Bruno, K. A., Zeidan, F. Z., Halberstadt, A. L., & Furnish, T. J. (2020) · Regional Anesthesia & Pain Medicine · doi:10.1136/rapm-2020-101273 · Cited by 130
Modulating the pain network—neurostimulation for central poststroke pain
Hosomi, K., Seymour, B., & Saitoh, Y. (2015) · Nature Reviews Neurology · doi:10.1038/nrneurol.2015.58 · Cited by 118
Cottam, W. J., Iwabuchi, S. J., Drabek, M. M., Reckziegel, D., & Auer, D. P. (2018) · Pain · doi:10.1097/j.pain.0000000000001209 · Cited by 110
Kim, J., Mawla, I., Kong, J., Lee, J., Gerber, J. A., Ortiz, A., Kim, H., Chan, S., Loggia, M. L., Wasan, A. D., et al. (2019) · Pain · doi:10.1097/j.pain.0000000000001541 · Cited by 120
Increased connectivity of pain matrix in chronic migraine: a resting-state functional MRI study
Lee, M. J., Park, B., Cho, S., Kim, S. T., Park, H., & Chung, C. (2019) · The Journal of Headache and Pain · doi:10.1186/s10194-019-0986-z · Cited by 116
Tu, Y., Fu, Z., Mao, C., Falahpour, M., Gollub, R. L., Park, J., Wilson, G., Napadow, V., Gerber, J. A., Chan, S., et al. (2020) · Nature Communications · doi:10.1038/s41467-020-17788-z · Cited by 116
Effects of stress on the corticolimbic system: implications for chronic pain
Vachon‐Presseau, É. (2017) · Progress in Neuro-Psychopharmacology and Biological Psychiatry · doi:10.1016/j.pnpbp.2017.10.014 · Cited by 123
Schrepf, A., Williams, D. A., Gallop, R., Naliboff, B. D., Basu, N., Kaplan, C. M., Harper, D., Landis, J. R., Clemens, J. Q., Strachan, E. D., et al. (2018) · Pain · doi:10.1097/j.pain.0000000000001299 · Cited by 113
Global disruption of degree rank order: a hallmark of chronic pain
Mansour, A. R., Baria, A. T., Tétreault, P., Vachon‐Presseau, É., Chang, P., Huang, L., Apkarian, A. V., & Baliki, M. N. (2016) · Scientific Reports · doi:10.1038/srep34853 · Cited by 107
Self-citationvan Ettinger-Veenstra, H., Lundberg, P., Alföldi, P., Södermark, M., Graven-Nielsen, T., Sjörs, A., Engström, M., & Gerdle, B. (2019) · Journal of Pain Research · doi:10.2147/jpr.s189443 · Cited by 97
Pathophysiology of primary burning mouth syndrome with special focus on taste dysfunction: a review
Kolkka, M., Jääskeläinen, S., Laine, M. A., Teerijoki‐Oksa, T., Sandell, M. A., & Forssell, H. (2015) · Oral Diseases · doi:10.1111/odi.12345 · Cited by 101
Pain in osteoarthritis. Implications for optimal management
Trouvin, A., & Perrot, S. (2017) · Joint Bone Spine · doi:10.1016/j.jbspin.2017.08.002 · Cited by 100
Case, M., Zhang, H., Mundahl, J., Datta, Y., Nelson, S. C., Gupta, K., & He, B. (2016) · NeuroImage Clinical · doi:10.1016/j.nicl.2016.12.024 · Cited by 96
Icenhour, A., Witt, S. T., Elsenbruch, S., Lowén, M., Engström, M., Tillisch, K., Mayer, E. A., & Walter, S. (2017) · NeuroImage Clinical · doi:10.1016/j.nicl.2017.06.001 · Cited by 92
Reckziegel, D., Vachon‐Presseau, É., Petre, B., Schnitzer, T. J., Baliki, M. N., & Apkarian, A. V. (2019) · Pain · doi:10.1097/j.pain.0000000000001529 · Cited by 89
Self-citationReorganization of brain connectivity in obesity
Geha, P., Cecchi, G., Constable, R. T., Abdallah, C. G., & Small, D. M. (2016) · Human Brain Mapping · doi:10.1002/hbm.23462 · Cited by 85
Clinical Concepts Emerging from fMRI Functional Connectomics
Matthews, P. M., & Hampshire, A. (2016) · Neuron · doi:10.1016/j.neuron.2016.07.031 · Cited by 83
Neonatal brain resting-state functional connectivity imaging modalities
Mohammadi‐Nejad, A., Mahmoudzadeh, M., Hassanpour, M. S., Wallois, F., Muzik, O., Papadelis, C. L., Hansen, A. R., Hamid Soltanian-zadeh, A., Gelovani, J. G., & Avanaki, K. (2018) · Photoacoustics · doi:10.1016/j.pacs.2018.01.003 · Cited by 88
Pharmacologic attenuation of cross-modal sensory augmentation within the chronic pain insula
Harte, S. E., Ichesco, E., Hampson, J. P., Peltier, S., Schmidt‐Wilcke, T., Clauw, D. J., & Harris, R. E. (2016) · Pain · doi:10.1097/j.pain.0000000000000593 · Cited by 84
Structural and Functional Brain Changes at Early and Late Stages of Complex Regional Pain Syndrome
Shokouhi, M., Clarke, C. F. M., Morley-Forster, P., Moulin, D. E., Davis, K. D., & Lawrence, K. S. (2017) · Journal of Pain · doi:10.1016/j.jpain.2017.09.007 · Cited by 83
Zorina-Lichtenwalter, K., Bango, C. I., Oudenhove, L. V., Čeko, M., Lindquist, M. A., Grotzinger, A. D., Keller, M. C., Friedman, N. P., & Wager, T. D. (2023) · Pain · doi:10.1097/j.pain.0000000000002922 · Cited by 88
Egorova, N., Gollub, R. L., & Kong, J. (2015) · NeuroImage Clinical · doi:10.1016/j.nicl.2015.09.012 · Cited by 82
Dynamic pain connectome functional connectivity and oscillations reflect multiple sclerosis pain
Bosma, R. L., Kim, J. A., Cheng, J. C., Rogachov, A., Hemington, K. S., Osborne, N. R., Oh, J., & Davis, K. D. (2018) · Pain · doi:10.1097/j.pain.0000000000001332 · Cited by 81
Default mode network changes in fibromyalgia patients are largely dependent on current clinical pain
Čeko, M., Frangos, E., Gracely, J. L., Richards, E. A., Wang, B., Schweinhardt, P., & Bushnell, M. C. (2020) · NeuroImage · doi:10.1016/j.neuroimage.2020.116877 · Cited by 85
Brain mechanisms of chronic pain: critical role of translational approach
Barroso, J., Branco, P., & Apkarian, A. V. (2021) · Translational research · doi:10.1016/j.trsl.2021.06.004 · Cited by 91
Self-citationComparison of gray matter volume between migraine and “strict-criteria” tension-type headache
Chen, W., Chou, K., Lee, P., Hsiao, F., Niddam, D. M., Lai, K., Fuh, J., Lin, C., & Wang, S. (2018) · The Journal of Headache and Pain · doi:10.1186/s10194-018-0834-6 · Cited by 80
Hemington, K. S., Rogachov, A., Cheng, J. C., Bosma, R. L., Kim, J. A., Osborne, N. R., Inman, R. D., & Davis, K. D. (2018) · Pain · doi:10.1097/j.pain.0000000000001252 · Cited by 78
Pain-Evoked Reorganization in Functional Brain Networks
Zheng, W., Woo, C., Yao, Z., Goldstein, P., Atlas, L. Y., Roy, M., Schmidt, L., Krishnan, A., Jepma, M., Hu, B., et al. (2019) · Cerebral Cortex · doi:10.1093/cercor/bhz276 · Cited by 81
Neurophysiological mechanisms of chiropractic spinal manipulation for spine pain
Gevers‐Montoro, C., Provencher, B., Descarreaux, M., Ortega, A., & Piché, M. (2021) · European Journal of Pain · doi:10.1002/ejp.1773 · Cited by 77
Shi, H., Yuan, C., Dai, Z., Ma, H., & Sheng, L. (2016) · Seminars in Arthritis and Rheumatism · doi:10.1016/j.semarthrit.2016.06.002 · Cited by 75
Mano, H., Kotecha, G. K., Leibnitz, K., Matsubara, T., Sprenger, C., Nakae, A., Shenker, N., Shibata, M., Voon, V., Yoshida, W., et al. (2018) · Wellcome Open Research · doi:10.12688/wellcomeopenres.14069.2 · Cited by 74
The Impact of Psychological Factors and Their Treatment on the Results of Total Knee Arthroplasty
Kazarian, G. S., Anthony, C. A., Lawrie, C. M., & Barrack, R. L. (2021) · Journal of Bone and Joint Surgery · doi:10.2106/jbjs.20.01479 · Cited by 74
Interictal brain activity differs in migraine with and without aura: resting state fMRI study
Faragó, P., Tuka, B., Tóth, E. M., Szabó, N., Király, A., Csete, G., Szok, D., Tajti, J., Párdutz, Á., Vécsei, L., et al. (2017) · The Journal of Headache and Pain · doi:10.1186/s10194-016-0716-8 · Cited by 72
Chronic pain and distorted body image: Implications for multisensory feedback interventions
Senkowski, D., & Heinz, A. (2016) · Neuroscience & Biobehavioral Reviews · doi:10.1016/j.neubiorev.2016.08.009 · Cited by 76
Dynamic Changes of Functional Pain Connectome in Women with Primary Dysmenorrhea
Wu, T.-H., Tu, C., Chao, H., Li, W., Low, I., Chuang, C.-Y., Yeh, T., Cheng, C.-M., Chou, C.-C., Chen, L., et al. (2016) · Scientific Reports · doi:10.1038/srep24543 · Cited by 70
The posterior medial cortex in urologic chronic pelvic pain syndrome
Martucci, K. T., Shirer, W. R., Bagarinao, E., Johnson, K. A., Farmer, M. A., Labus, J. S., Apkarian, A. V., DEUTSCH, G., Harris, R. E., Mayer, E. A., et al. (2015) · Pain · doi:10.1097/j.pain.0000000000000238 · Cited by 73
Self-citationNIRS measures in pain and analgesia: Fundamentals, features, and function
Karunakaran, K. D., Peng, K., Berry, D., Green, S. A., Labadie, R. F., Kussman, B. D., & Borsook, D. (2020) · Neuroscience & Biobehavioral Reviews · doi:10.1016/j.neubiorev.2020.10.023 · Cited by 69
Chronic Pain and Psychiatric Conditions
Johnston, K. J. A., & Huckins, L. M. (2022) · Complex Psychiatry · doi:10.1159/000527041 · Cited by 81
Li, H., Li, X., Feng, Y., Gao, F., Kong, Y., & Hu, L. (2020) · NeuroImage · doi:10.1016/j.neuroimage.2020.117186 · Cited by 64
Nishigami, T., Mibu, A., Tanaka, K., Yamashita, Y., Yamada, E., Wand, B. M., Catley, M. J., Stanton, T. R., & Moseley, G. L. (2017) · PLoS ONE · doi:10.1371/journal.pone.0179225 · Cited by 62
Migrainomics — identifying brain and genetic markers of migraine
Nyholt, D. R., Borsook, D., & Griffiths, L. R. (2017) · Nature Reviews Neurology · doi:10.1038/nrneurol.2017.151 · Cited by 61
Pinto, A. M., Luís, M., Geenen, R., Palavra, F., Lumley, M. A., Ablin, J. N., Amris, K., Branco, J., Buskila, D., Castelhano, J., et al. (2023) · Neuroscience & Biobehavioral Reviews · doi:10.1016/j.neubiorev.2023.105235 · Cited by 75
Overall comorbidities in functional neurological disorder: A narrative review
Carle, G., Goutte, J., Do-Quang-Cantagrel, N., Mouchabac, S., Joly, C., & Garcin, B. (2023) · L Encéphale · doi:10.1016/j.encep.2023.06.004 · Cited by 63
Nijs, J., Malfliet, A., Roose, E. C. S., Lahousse, A., Bogaert, W. V., Johansson, E., Runge, N., Goossens, Z., Labie, C., Bilterys, T., et al. (2024) · Journal of Clinical Medicine · doi:10.3390/jcm13030644 · Cited by 66
The influence of the descending pain modulatory system on infant pain-related brain activity
Goksan, S., Baxter, L., Moultrie, F., Duff, E. P., Hathway, G. J., Hartley, C., Tracey, I., & Slater, R. (2018) · eLife · doi:10.7554/elife.37125 · Cited by 60
The Current View on the Paradox of Pain in Autism Spectrum Disorders
Bogdanova, O. V., Bogdanov, V. B., Pizano, A., Bouvard, M. P., Cazalets, J., Mellen, N. M., & Amestoy, A. (2022) · Frontiers in Psychiatry · doi:10.3389/fpsyt.2022.910824 · Cited by 70
Birklein, F., Ibrahim, A. I., Schlereth, T., & Kingery, W. S. (2018) · Journal of Pain · doi:10.1016/j.jpain.2018.03.018 · Cited by 59
Implications of the putamen in pain and motor deficits in complex regional pain syndrome
Azqueta‐Gavaldon, M., Youssef, A. M., Storz, C., Lemme, J. D., Schulte-Göcking, H., Becerra, L. R., Azad, S. C., Reiners, A., Ertl-Wagner, B. B., Borsook, D., et al. (2019) · Pain · doi:10.1097/j.pain.0000000000001745 · Cited by 57
Gray Matter Abnormalities Associated With Chronic Back Pain
Yuan, C., Shi, H., Pan, P., Dai, Z., Zhong, J., Ma, H., & Sheng, L. (2017) · Clinical Journal of Pain · doi:10.1097/ajp.0000000000000489 · Cited by 59
Kim, J., Choi, S.-H., Jang, J. H., Lee, D.-H., Lee, K.-J., Lee, W. J., Moon, J. Y., Kim, Y. C., & Kang, D. (2017) · PLoS ONE · doi:10.1371/journal.pone.0180479 · Cited by 58
Disease-related differences in resting-state networks
Gupta, A., Rapkin, A. J., Gill, Z. S., Kilpatrick, L. A., Fling, C., Stains, J., Masghati, S., Tillisch, K., Mayer, E. A., & Labus, J. S. (2015) · Pain · doi:10.1097/01.j.pain.0000461289.65571.54 · Cited by 60
Tian, T., Guo, L., Xu, J., Zhang, S., Shi, J., Liu, C., Qin, Y., & Zhu, W. (2016) · Scientific Reports · doi:10.1038/srep36030 · Cited by 57
Tatu, K., Costa, T., Nani, A., Diano, M., Quarta, D. G., Duca, S., Apkarian, A. V., Fox, P. T., & Cauda, F. (2017) · NeuroImage Clinical · doi:10.1016/j.nicl.2017.12.029 · Cited by 58
Self-citationSchreiber, K. L., Loggia, M. L., Kim, J., Cahalan, C. M., Napadow, V., & Edwards, R. R. (2017) · The Journal of Pain · doi:10.1016/j.jpain.2017.02.437 · Cited by 54
Default mode network connectivity is related to pain frequency and intensity in adolescents
Jones, S. A., Morales, A. M., Holley, A. L., Wilson, A. C., & Nagel, B. J. (2020) · NeuroImage Clinical · doi:10.1016/j.nicl.2020.102326 · Cited by 55
Itoh, N., Mishima, H., Yoshida, Y., Yoshida, M., Oka, H., & Matsudaira, K. (2022) · JMIR mhealth and uhealth · doi:10.2196/35867 · Cited by 56
Isenburg, K., Mawla, I., Loggia, M. L., Ellingsen, D., Protsenko, E., Kowalski, M., Swensen, D., O'Dwyer-Swensen, D., Edwards, R. R., Napadow, V., et al. (2020) · Journal of Pain · doi:10.1016/j.jpain.2020.11.007 · Cited by 56
Topological Reorganization of the Default Mode Network in Irritable Bowel Syndrome
Qi, R., Ke, J., Schoepf, U. J., Varga‐Szemes, Á., Milliken, C. M., Liu, C., Xu, Q., Wang, F., Zhang, L. J., & Lu, G. (2015) · Molecular Neurobiology · doi:10.1007/s12035-015-9558-7 · Cited by 54
Sex differences in brain modular organization in chronic pain
Fauchon, C., David Meunier, A., Rogachov, A., Hemington, K. S., Cheng, J. C., Bosma, R. L., Osborne, N. R., Kim, J. A., Hung, P. S.-P., Inman, R. D., et al. (2020) · Pain · doi:10.1097/j.pain.0000000000002104 · Cited by 57
Metadata
- Authors
- Baliki, M. N., Mansour, A. R., Baria, A. T., & Apkarian, A. V.
- Affiliations
- Northwestern University (US)
- Corresponding author
- Apkarian, A. Vania
- Venue
- PLoS ONE
- Publisher
- Public Library of Science (PLoS)
- Published
- 2014-09-02
- Volume
- 9
- Issue
- 9
- Pages
- e106133
- ISSN
- 1932-6203 (ISSN-L)
- PMC
- PMC4152156
- OpenAlex
- W2045895137
- Cited by
- 532
- References
- 54
- Citations by year
- 2026: 36 · 2025: 42 · 2024: 48 · 2023: 45 · 2022: 57 · 2021: 39 · 2020: 56 · 2019: 43 · 2018: 47 · 2017: 50 · 2016: 42 · 2015: 24 · 2014: 2
- FWCI
- 21.93
- Type
- journal article
- Language
- en
- Open access
- gold
- doi.org
- Locations
- PLoS ONE (publishedVersion, cc-by)
- Europe PMC (PubMed Central) (publishedVersion, cc-by)
- PubMed Central (publishedVersion, cc-by)
- PubMed (publishedVersion)
- DOAJ (DOAJ: Directory of Open Access Journals) (submittedVersion, cc-by-sa)
- Figshare (submittedVersion, cc-by)
- Funders
- National Institutes of Health
- National Institute of Neurological Disorders and Stroke (NS35115, R01NS035115)
- Topics
- Life Sciences › Neuroscience › Cognitive Neuroscience › Functional Brain Connectivity Studies
- Health Sciences › Medicine › Physiology (medical) › Pain Mechanisms and Treatments
- Health Sciences › Medicine › Anesthesiology and Pain Medicine › Pain Management and Treatment
- Keywords
- chronic pain, default mode network, chronic back pain, complex regional pain syndrome, knee osteoarthritis, resting-state functional connectivity, medial prefrontal cortex, insula, high-frequency oscillations, phase locking, attention, pain duration, neuroplasticity
- MeSH terms
- Adult, Aged, Female, Humans, Male, Middle Aged, Nerve Net, Neural Pathways, Rest, Case-Control Studies, Prefrontal Cortex, Young Adult, Chronic Pain
About these checks
Registry, retraction, Cites and statistics results are computed, not judged, with one exception: a printed reference that no index lists is read once by a model before it counts as a citation error. Claims are extracted by a model and kept only when their quote appears verbatim in the text; each cited source is then checked, with a model’s help, for whether it says what the claim relies on. Those verdicts can be wrong — read the claim’s quote and the cited source before relying on one.
Statistics and arithmetic are recomputed, not judged.
Confidence bands are shown only for fields calibrated on our annotated test set. None is calibrated yet, so no band is shown.
What counts as a claim ›How we measure confidence ›How we check this ›
Are you an author, or do you see a problem with this page? Request a review
