

The DOI matches its Crossref record; 40 of the 40 references it cites were found in a registry or an index.
Dietary Patterns Differently Associate with Inflammation and Gut Microbiota in Overweight and Obese Subjects
Open accessAbstract
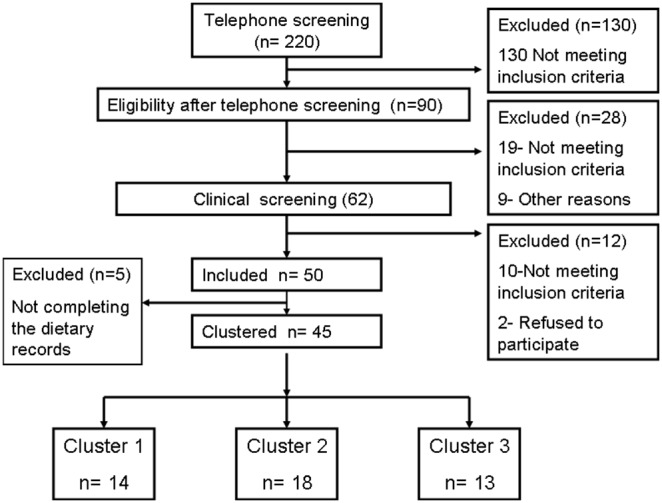
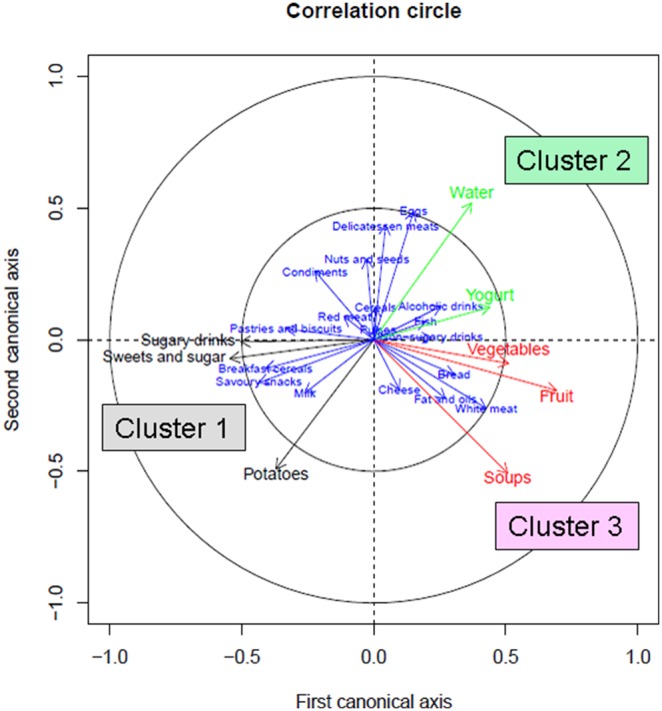
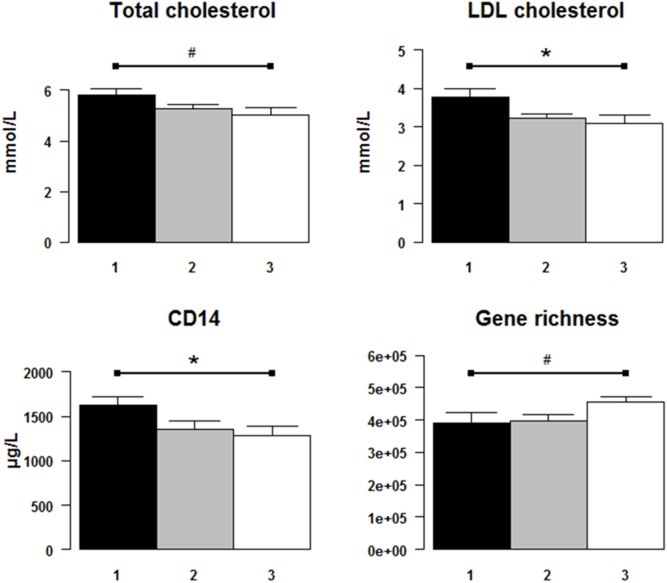
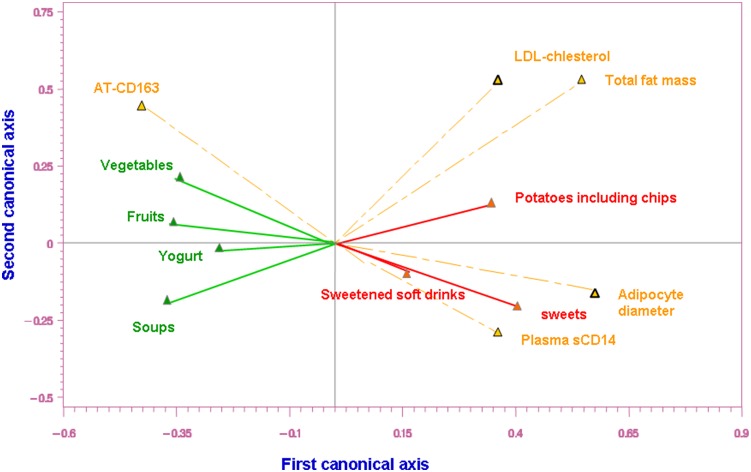
BACKGROUND: Associations between dietary patterns, metabolic and inflammatory markers and gut microbiota are yet to be elucidated. OBJECTIVES: We aimed to characterize dietary patterns in overweight and obese subjects and evaluate the different dietary patterns in relation to metabolic and inflammatory variables as well as gut microbiota. DESIGN: Dietary patterns, plasma and adipose tissue markers, and gut microbiota were evaluated in a group of 45 overweight and obese subjects (6 men and 39 women). A group of 14 lean subjects were also evaluated as a reference group. RESULTS: Three clusters of dietary patterns were identified in overweight/obese subjects. Cluster 1 had the least healthy eating behavior (highest consumption of potatoes, confectionary and sugary drinks, and the lowest consumption of fruits that was associated also with low consumption of yogurt, and water). This dietary pattern was associated with the highest LDL cholesterol, plasma soluble CD14 (p = 0.01) a marker of systemic inflammation but the lowest accumulation of CD163+ macrophages with anti-inflammatory profile in adipose tissue (p = 0.05). Cluster 3 had the healthiest eating behavior (lower consumption of confectionary and sugary drinks, and highest consumption of fruits but also yogurts and soups). Subjects in this Cluster had the lowest inflammatory markers (sCD14) and the highest anti-inflammatory adipose tissue CD163+ macrophages. Dietary intakes, insulin sensitivity and some inflammatory markers (plasma IL6) in Cluster 3 were close to those of lean subjects. Cluster 2 was in-between clusters 1 and 3 in terms of healthfulness. The 7 gut microbiota groups measured by qPCR were similar across the clusters. However, the healthiest dietary cluster had the highest microbial gene richness, as evaluated by quantitative metagenomics. CONCLUSION: A healthier dietary pattern was associated with lower inflammatory markers as well as greater gut microbiota richness in overweight and obese subjects. TRIAL REGISTRATION: ClinicalTrials.gov NCT01314690.
Overview
The claims and statistics of this paper haven’t been checked yet.
Run the check — free, no account needed. It reads the open-access text and checks the sources it cites.
Integrity signals
Registry
Cites
Statistics
Figures
Verification
Claims the paper makes
The claims and statistics of this paper haven’t been checked yet.
Run the check — free, no account needed. It reads the open-access text and checks the sources it cites.
Claims other papers make about this one
Each is checked against this paper’s own text: does it say what the citing paper says it does?
In the citing paper
“Fourth, the gut microbiota are affected by environmental factors37, 38 such as dietary intakes,39, 40, 41 which may, in turn, influence blood levels of TMAO and its precursors.4”
From Gut Microbiota Metabolites and Risk of Major Adverse Cardiovascular Disease Events and Death: A Systematic Review and Meta‐Analysis of Prospective Studies (2017) · cites this paper as [40]
Self-check
Percentages, sums and reported differences re-computed from the paper’s own numbers.
The self-check needs the paper’s full text.
Citations
Cites
A human gut microbial gene catalogue established by metagenomic sequencing
MetaHIT Consortium, Qin, J., Li, R., Raes, J., Arumugam, M., Burgdorf, K. S., Manichanh, C., Nielsen, T., Pons, N., Levenez, F., et al. (2010) · Nature · doi:10.1038/nature08821 · Cited by 11,624
Self-citationLinking long-term dietary patterns with gut microbial enterotypes
Wu, G. D., Chen, J., Hoffmann, C., Bittinger, K., Chen, Y.-Y., Keilbaugh, S. A., Bewtra, M., Knights, D., Walters, W. A., Knight, R., et al. (2011) · Science · doi:10.1126/science.1208344 · Cited by 6,513
Richness of human gut microbiome correlates with metabolic markers
Le Chatelier, E., Nielsen, T., Qin, J., Prifti, E., Hildebrand, F., Falony, G., Almeida, M., Arumugam, M., Batto, J.-M., Kennedy, S., et al. (2013) · Nature · doi:10.1038/nature12506 · Cited by 4,662
Self-citationFundamentals of Biostatistics.
(1969) · Annals of Internal Medicine · doi:10.7326/0003-4819-70-4-873 · Cited by 4,573
TLR4 links innate immunity and fatty acid-induced insulin resistance
Shi, H., Kokoeva, M. V., Inouye, K., Tzameli, I., Yin, H., & Flier, J. S. (2006) · Journal of Clinical Investigation · doi:10.1172/jci28898 · Cited by 3,690
The Effect of Diet on the Human Gut Microbiome: A Metagenomic Analysis in Humanized Gnotobiotic Mice
Turnbaugh, P. J., Ridaura, V. K., Faith, J. J., Rey, F. E., Knight, R., & Gordon, J. I. (2009) · Science Translational Medicine · doi:10.1126/scitranslmed.3000322 · Cited by 3,058 · cited 1×
“Interestingly, a rapid adaptation of gut microbiota could be observed after 24 h of switching from a low-fat, plant polysaccharide-rich diet to a high fat high sugar ‘‘western’’ diet [15], whereas the diversity of species within the gut microbiota organized into identifiable clusters or enterotypes are correlated with…”
BackgroundMacrophage-specific PPARγ controls alternative activation and improves insulin resistance
Odegaard, J. I., Ricardo-Gonzalez, R. R., Goforth, M. H., Morel, C. R., Subramanian, V., Mukundan, L., Eagle, A. R., Vats, D., Brombacher, F., Ferrante, A. W., et al. (2007) · Nature · doi:10.1038/nature05894 · Cited by 2,107 · cited 1×
“macrophage activation, are prone to diet-induced obesity and insulin resistance [40].”
BackgroundDietary intervention impact on gut microbial gene richness
Cotillard, A., Kennedy, S. P., Kong, L. C., Prifti, E., Pons, N., Le Chatelier, E., Almeida, M., Quinquis, B., Levenez, F., Galleron, N., et al. (2013) · Nature · doi:10.1038/nature12480 · Cited by 1,832
Self-citationHealth-promoting components of fruits and vegetables in the diet.
Liu, R. H. (2013) · Advances in Nutrition · doi:10.3945/an.112.003517 · Cited by 1,310
Differential Adaptation of Human Gut Microbiota to Bariatric Surgery–Induced Weight Loss
Furet, J.-P., Kong, L.-C., Tap, J., Poitou, C., Basdevant, A., Bouillot, J.-L., Mariat, D., Corthier, G., Doré, J., Henegar, C., et al. (2010) · Diabetes · doi:10.2337/db10-0253 · Cited by 1,173
Self-citation
Research works printed but not linked: 1
- Habi-Rachedi F, Rondeau P, Marque S, Holmes B (2012) A robust multivariate analysis to identify dietary patterns. Agrostat; 12th European symposium on statistical methods for the food industry. Paris. France 28/02-2/02.
Cited by
Sorted by citations
Dao, M. C., Everard, A., Aron-Wisnewsky, J., Sokolovska, N., Prifti, E., Verger, E. O., Kayser, B. D., Levenez, F., Chilloux, J., Hoyles, L., et al. (2016) · Gut · doi:10.1136/gutjnl-2014-308778 · Cited by 1,931
Self-citationEnergy balance and obesity: what are the main drivers?
On behalf of the IARC working group on Energy Balance and Obesity, Romieu, I., Dossus, L., Barquera, S., Blottière, H. M., Franks, P. W., Gunter, M. J., Hwalla, N. C., Hursting, S. D., Leitzmann, M. F., et al. (2017) · Cancer Causes & Control · doi:10.1007/s10552-017-0869-z · Cited by 818
Immune Dysfunction as a Cause and Consequence of Malnutrition
Bourke, C. D., Berkley, J. A., & Prendergast, A. J. (2016) · Trends in Immunology · doi:10.1016/j.it.2016.04.003 · Cited by 767
Wallace, T. C., Bailey, R. L., Blumberg, J. B., Burton-Freeman, B., Chen, C.-Y. O., Crowe-White, K. M., Drewnowski, A., Hooshmand, S., Johnson, E., Lewis, R., et al. (2020) · Critical Reviews in Food Science and Nutrition · doi:10.1080/10408398.2019.1632258 · Cited by 638
Heianza, Y., Ma, W., Manson, J. E., Rexrode, K. M., & Qi, L. (2017) · Journal of the American Heart Association · doi:10.1161/jaha.116.004947 · Cited by 544
Metadata
- Authors
- Kong, L. C., Holmes, B. A., Cotillard, A., Habi-Rachedi, F., Brazeilles, R., Gougis, S., Gausserès, N., Cani, P. D., Fellahi, S., Bastard, J.-P., Kennedy, S. P., Doré, J., Ehrlich, S. D., Zucker, J.-D., Rizkalla, S. W., & Clément, K.
- Affiliations
- Inserm (FR)
- Danone (France) (FR)
- Assistance Publique – Hôpitaux de Paris (FR)
- Walloon Excellence in Lifesciences and Biotechnology (BE)
- Microbiologie de l’alimentation au service de la santé (FR)
- Corresponding author
- Rizkalla, Salwa W.
- ORCID
- Venue
- PLoS ONE
- Publisher
- Public Library of Science (PLoS)
- Published
- 2014-10-20
- Volume
- 9
- Issue
- 10
- Pages
- e109434
- ISSN
- 1932-6203 (ISSN-L)
- PMC
- PMC4203727
- OpenAlex
- W2014388281
- Cited by
- 132
- References
- 40
- Citations by year
- 2026: 2 · 2025: 4 · 2024: 11 · 2023: 11 · 2022: 5 · 2021: 14 · 2020: 8 · 2019: 15 · 2018: 10 · 2017: 24 · 2016: 16 · 2015: 11 · 2014: 1
- FWCI
- 17.17
- Type
- journal article
- Language
- en
- Open access
- gold
- doi.org
- Locations
- PLoS ONE (publishedVersion, cc-by)
- Europe PMC (PubMed Central) (publishedVersion, cc-by)
- PubMed Central (publishedVersion, cc-by)
- PubMed (publishedVersion)
- HAL (submittedVersion, other-oa)
- HAL (submittedVersion, cc-by)
- Digital Access to Libraries (submittedVersion, other-oa)
- DOAJ (DOAJ: Directory of Open Access Journals) (submittedVersion, cc-by-sa)
- Figshare (submittedVersion, cc-by)
- Funders
- Danone
- European Commission (305312, 201052)
- Agence Nationale de la Recherche (ANR-10, ANR-10-IAHU-05)
- Fonds De La Recherche Scientifique - FNRS
- Topics
- Health Sciences › Medicine › Public Health, Environmental and Occupational Health › Nutritional Studies and Diet
- Life Sciences › Biochemistry, Genetics and Molecular Biology › Molecular Biology › Gut microbiota and health
- Health Sciences › Medicine › Endocrinology, Diabetes and Metabolism › Adipokines, Inflammation, and Metabolic Diseases
- Keywords
- dietary habits, obesity, overweight, gut microbiota, systemic inflammation, soluble CD14, CD163+ macrophages, adipose tissue, insulin sensitivity, interleukin-6, healthy eating habits, fruit and vegetable intake, sugar-sweetened beverages
- MeSH terms
- Adipose Tissue, Adult, Aged, Diet, Eating, Feces, Female, Humans, Inflammation, Intestines, Male, Middle Aged, Obesity, Cohort Studies, Biomarkers, Case-Control Studies, Polymerase Chain Reaction, High-Throughput Nucleotide Sequencing, Microbiota
About these checks
Registry, retraction, Cites and statistics results are computed, not judged, with one exception: a printed reference that no index lists is read once by a model before it counts as a citation error. Claims are extracted by a model and kept only when their quote appears verbatim in the text; each cited source is then checked, with a model’s help, for whether it says what the claim relies on. Those verdicts can be wrong — read the claim’s quote and the cited source before relying on one.
Statistics and arithmetic are recomputed, not judged.
Confidence bands are shown only for fields calibrated on our annotated test set. None is calibrated yet, so no band is shown.
What counts as a claim ›How we measure confidence ›How we check this ›
Are you an author, or do you see a problem with this page? Request a review
