

The Precision-Recall Plot Is More Informative than the ROC Plot When Evaluating Binary Classifiers on Imbalanced Datasets
Open accessThe DOI matches its Crossref record; 55 of the 56 references it cites were found in a registry or an index.
Abstract
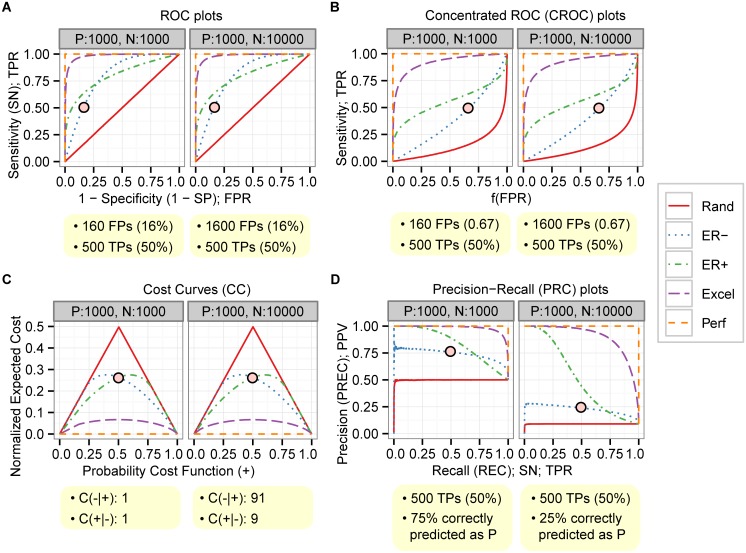
Binary classifiers are routinely evaluated with performance measures such as sensitivity and specificity, and performance is frequently illustrated with Receiver Operating Characteristics (ROC) plots. Alternative measures such as positive predictive value (PPV) and the associated Precision/Recall (PRC) plots are used less frequently. Many bioinformatics studies develop and evaluate classifiers that are to be applied to strongly imbalanced datasets in which the number of negatives outweighs the number of positives significantly. While ROC plots are visually appealing and provide an overview of a classifier's performance across a wide range of specificities, one can ask whether ROC plots could be misleading when applied in imbalanced classification scenarios. We show here that the visual interpretability of ROC plots in the context of imbalanced datasets can be deceptive with respect to conclusions about the reliability of classification performance, owing to an intuitive but wrong interpretation of specificity. PRC plots, on the other hand, can provide the viewer with an accurate prediction of future classification performance due to the fact that they evaluate the fraction of true positives among positive predictions. Our findings have potential implications for the interpretation of a large number of studies that use ROC plots on imbalanced datasets.
Overview
The claims and statistics of this paper haven’t been checked yet.
Free: it reads the open-access text and checks the first 5 claims that cite a source we can check. Create a free account to check every claim.
Integrity signals
Registry
Cites
Statistics
Figures

Verification
Claims the paper makes
The claims and statistics of this paper haven’t been checked yet.
Free: it reads the open-access text and checks the first 5 claims that cite a source we can check. Create a free account to check every claim.
Claims other papers make about this one
Each is checked against this paper’s own text: does it say what the citing paper says it does?
The cited source says what the claim attributes to it.
In the citing paper
“which is a more informative measure than ROC analysis in imbalanced scenarios59.”
From K-STAMM: a knowledge-enhanced spatial - temporal attention model with multimodal fusion for pneumonia prediction (2026) · cites this paper as [59]
The cited source says what the claim attributes to it.
In the citing paper
“When dealing with highly imbalanced data as is the case with fraud detection, AUC (and ROC curves) may be too optimistic and the Area under the Precision-Recall Curve (AUPRC) gives a more informative picture of a classifier's performance (Davis and Goadrich, 2006; Saito and Rehmsmeier, 2015; Fern´ andez et al., 2018).”
From Data engineering for fraud detection (2021) · cites this paper as Saito and Rehmsmeier, 2015
The cited source says what the claim attributes to it.
In the citing paper
“When dealing with highly imbalanced data as is the case with fraud detection, AUC (and ROC curves) may be too optimistic and the Area under the Precision-Recall Curve (AUPRC) gives a more informative picture of a classifier's performance (Davis and Goadrich, 2006; Saito and Rehmsmeier, 2015; Fern´ andez et al., 2018).”
From Data engineering for fraud detection (2021) · cites this paper as Saito and Rehmsmeier, 2015
The cited source says what the claim attributes to it.
In the citing paper
“Because extreme prediction is by definition an imbalanced classification problem, we base our analysis on precision-recall plots which are well-suited for this case [42].”
From Learning skillful medium-range global weather forecasting (2023) · cites this paper as [42]
In the citing paper
“Furthermore, careful consideration should be given when selecting evaluation metrics, as the precision-recall curve is more informative for imbalanced datasets than the most commonly used receiver-operating characteristic curve (true positive rate vs. false positive rate) (Fig. 5C).115”
From Use of artificial intelligence for liver diseases: A survey from the EASL congress 2024 (2024) · cites this paper as [115]
1 more claim about this paper
Create a free account to see every claim other papers make about this one.
Self-check
Percentages, sums and reported differences re-computed from the paper’s own numbers.
The self-check needs the paper’s full text.
Citations
Cites
LIBSVM: A library for support vector machines
Chang, C.-C., & Lin, C.-J. (2011) · ACM Transactions on Intelligent Systems and Technology · doi:10.1145/1961189.1961199 · Cited by 40,918
Bartel (2004) · doi:10.1016/s0092-8674(04)00045-5 · Cited by 34,714
SMOTE synthetic minority over-sampling technique
Chawla, N. V., Bowyer, K. W., Hall, L. O., & Kegelmeyer, W. P. (2002) · Journal of Artificial Intelligence Research · doi:10.1613/jair.953 · Cited by 32,865
An introduction to ROC analysis
Fawcett, T. (2006) · Pattern Recognition Letters · doi:10.1016/j.patrec.2005.10.010 · Cited by 21,879 · cited 3×
“Here, we review the theoretical background of commonly used evaluation measures, specifically ROC [24, 25], PRC [26], concentrated ROC (CROC) [27], and Cost Curves (CC) [28].”
BackgroundMethodThe meaning and use of the area under a receiver operating characteristic (ROC) curve.
Hanley, J. A., & McNeil, B. J. (1982) · Radiology · doi:10.1148/radiology.143.1.7063747 · Cited by 21,856
The WEKA data mining software: an update
Hall, M., Frank, E., Holmes, G., Pfahringer, B., Reutemann, P., & Witten, I. H. (2009) · ACM SIGKDD Explorations Newsletter · doi:10.1145/1656274.1656278 · Cited by 17,750
Bioconductor: open software development for computational biology and bioinformatics
Gentleman, R. C., Carey, V. J., Bates, D. M., Bolstad, B., Dettling, M., Dudoit, S., Ellis, B., Gautier, L., Ge, Y., Gentry, J., et al. (2004) · Genome Biology · doi:10.1186/gb-2004-5-10-r80 · Cited by 12,172 · cited 1×
“Several integrated machine learning and bioinformatics platforms such as WEKA [34] and Bioconductor [42, 43] also have basic functions or libraries for making ROC and PRC plots.”
MethodA training algorithm for optimal margin classifiers
Boser, B. E., Guyon, I. M., & Vapnik, V. N. (1992) · Proceedings of the fifth annual workshop on Computational learning theory · doi:10.1145/130385.130401 · Cited by 11,992
R: A Language for Data Analysis and Graphics
Ihaka, R., & Gentleman, R. (1996) · Journal of Computational and Graphical Statistics · doi:10.1080/10618600.1996.10474713 · Cited by 11,220
He, H., & Garcia, E. A. (2009) · IEEE Transactions on Knowledge and Data Engineering · doi:10.1109/tkde.2008.239 · Cited by 10,359
Measuring the Accuracy of Diagnostic Systems
Swets, J. A. (1988) · Science · doi:10.1126/science.3287615 · Cited by 10,058 · cited 1×
“Here, we review the theoretical background of commonly used evaluation measures, specifically ROC [24, 25], PRC [26], concentrated ROC (CROC) [27], and Cost Curves (CC) [28].”
MethodThe relationship between Precision-Recall and ROC curves
Davis, J., & Goadrich, M. (2006) · Proceedings of the 23rd international conference on Machine learning - ICML '06 · doi:10.1145/1143844.1143874 · Cited by 6,559
miRBase: integrating microRNA annotation and deep-sequencing data
Kozomara, A., & Griffiths-Jones, S. (2011) · Nucleic Acids Research · doi:10.1093/nar/gkq1027 · Cited by 3,634
The class imbalance problem: A systematic study1
Japkowicz, N., & Stephen, S. (2002) · Intelligent Data Analysis · doi:10.3233/ida-2002-6504 · Cited by 3,295
ROCR: visualizing classifier performance in R
Sing, T., Sander, O., Beerenwinkel, N., & Lengauer, T. (2005) · Bioinformatics · doi:10.1093/bioinformatics/bti623 · Cited by 3,200
Genome-wide association studies for common diseases and complex traits
Hirschhorn, J. N., & Daly, M. J. (2005) · Nature Reviews Genetics · doi:10.1038/nrg1521 · Cited by 2,863 · cited 1×
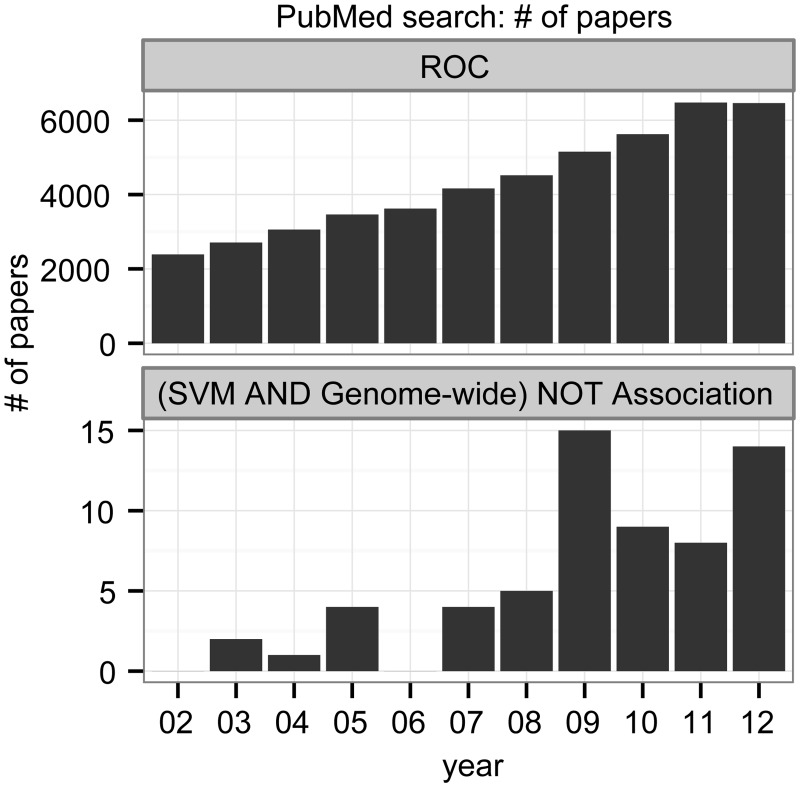
“We also added “ NOT Association ” to exclude Ge-nome-Wide Association Studies (GWAS) [44].”
MethodFast folding and comparison of RNA secondary structures
Hofacker, I. L., Fontana, W., Stadler, P. F., Bonhoeffer, L. S., Tacker, M., & Schuster, P. (1994) · Monatshefte f�r Chemie Chemical Monthly · doi:10.1007/bf00818163 · Cited by 2,306 · cited 2×
“From the seven additional tools evaluated in the MiRFinder study, we selected for our analysis the three tools that can produce scores and for which source code was available, namely miPred [47], RNAmicro [48], and ProMir [49], and added RNAfold [50] as a fourth tool.”
MethodA Probabilistic Interpretation of Precision, Recall and F-Score, with Implication for Evaluation
Goutte, C., & Gaussier, E. (2005) · Lecture Notes in Computer Science · doi:10.1007/978-3-540-31865-1_25 · Cited by 2,285
Addressing the Curse of Imbalanced Training Sets: One-Sided Selection.
Kubát, M., & Matwin, S. (1997) · Cited by 2,230
Assessing the accuracy of prediction algorithms for classification: an overview
Baldi, P., Brunak, S., Chauvin, Y., Andersen, C. A. F., & Nielsen, H. (2000) · Bioinformatics · doi:10.1093/bioinformatics/16.5.412 · Cited by 2,111
Editorial: special issue on learning from imbalanced data sets
Chawla, N. V., Japkowicz, N., & Kotcz, A. (2004) · ACM SIGKDD Explorations Newsletter · doi:10.1145/1007730.1007733 · Cited by 2,063 · cited 1×
“Class imbalance — a difference in the numbers of positive and negative instances, usually with the negatives outnumbering the positives — occurs in a wide range of scientific areas, including the life sciences, where unequal class distributions arise naturally [6 – 9].”
BackgroundStatistics Notes: Diagnostic tests 1: sensitivity and specificity
Altman, D. G., & Bland, J. M. (1994) · BMJ · doi:10.1136/bmj.308.6943.1552 · Cited by 2,061
The foundations of cost-sensitive learning
Elkan, C. (2001) · Cited by 1,945
Cost-sensitive boosting for classification of imbalanced data
Sun, Y., Kamel, M. S., Wong, A. K. C., & Wang, Y. (2007) · Pattern Recognition · doi:10.1016/j.patcog.2007.04.009 · Cited by 1,423
Small sample size effects in statistical pattern recognition: Recommendations for practitioners
Raudys, S. J., & Jain, A. K. (1991) · IEEE Transactions on Pattern Analysis and Machine Intelligence · doi:10.1109/34.75512 · Cited by 1,384 · cited 1×
“%) since the approaches to solve imbalance problems with small sized data can be different from those of medium and large sized data [5, 52].”
BackgroundMachine Learning for the Detection of Oil Spills in Satellite Radar Images
Kubat, M., Holte, R. C., & Matwin, S. (1998) · Machine Learning · doi:10.1023/a:1007452223027 · Cited by 1,243
A Multiple Resampling Method for Learning from Imbalanced Data Sets
Estabrooks, A., Jo, T., & Japkowicz, N. (2004) · Computational Intelligence · doi:10.1111/j.0824-7935.2004.t01-1-00228.x · Cited by 1,014 · cited 1×
“Despite the development of state-of-the-art solutions for the building of classifiers with imbalanced data [5, 11, 20], selecting a suitable performance evaluation method is often underestimated.”
BackgroundEvaluating Virtual Screening Methods: Good and Bad Metrics for the “Early Recognition” Problem
Truchon, J.-F., & Bayly, C. I. (2007) · Journal of Chemical Information and Modeling · doi:10.1021/ci600426e · Cited by 874
What Are Artificial Neural Networks?
Krogh, A. (2008) · Nature Biotechnology · doi:10.1038/nbt1386 · Cited by 844
A User’s Guide to Support Vector Machines
Ben-Hur, A., & Weston, J. (2010) · Methods in Molecular Biology · doi:10.1007/978-1-60327-241-4_13 · Cited by 822
Experimental perspectives on learning from imbalanced data
Van Hulse, J., Khoshgoftaar, T. M., & Napolitano, A. (2007) · Proceedings of the 24th international conference on Machine learning · doi:10.1145/1273496.1273614 · Cited by 786
Support Vector Machines and Kernels for Computational Biology
Ben-Hur, A., Ong, C. S., Sonnenburg, S., Schölkopf, B., & Rätsch, G. (2008) · PLoS Computational Biology · doi:10.1371/journal.pcbi.1000173 · Cited by 702
Data mining for direct marketing: problems and solutions
Ling, C. X., & Cheng-hui, L. (1998) · Cited by 661
Machine learning and its applications to biology
Tarca, A. L., Carey, V. J., Chen, X.-W., Romero, R., & Drăghici, S. (2007) · PLoS Computational Biology · doi:10.1371/journal.pcbi.0030116 · Cited by 656
Learning from imbalanced data sets with boosting and data generation: the DataBoost-IM approach
Guo, H., & Viktor, H. L. (2004) · ACM SIGKDD Explorations Newsletter · doi:10.1145/1007730.1007736 · Cited by 605
Meyer, P. E., Lafitte, F., & Bontempi, G. (2008) · BMC Bioinformatics · doi:10.1186/1471-2105-9-461 · Cited by 510 · cited 1×
“Several integrated machine learning and bioinformatics platforms such as WEKA [34] and Bioconductor [42, 43] also have basic functions or libraries for making ROC and PRC plots.”
MethodJiang, P., Wu, H., Wang, W., Ma, W., Sun, X., & Lu, Z. (2007) · Nucleic Acids Research · doi:10.1093/nar/gkm368 · Cited by 492
Use of receiver operating characteristic (ROC) analysis to evaluate sequence matching
Gribskov, M., & Robinson, N. L. (1996) · Computers & Chemistry · doi:10.1016/s0097-8485(96)80004-0 · Cited by 468
Class-Boundary Alignment for Imbalanced Dataset Learning
Wu, G., & Chang, E. Y. (2003) · Cited by 427
Machine Learning from Imbalanced Data Sets 101
Provost, F. J. (2008) · Faculty Digital Archive (New York University Florence) · Cited by 378
Søreide, K. (2009) · Journal of Clinical Pathology · doi:10.1136/jcp.2008.061010 · Cited by 300
RNAz 2.0: improved noncoding RNA detection.
Gruber, A. R., Findeiß, S., Stefan Washietl, A., Hofacker, I. L., & Stadler, P. F. (2010) · PubMed · Cited by 237
Human microRNA prediction through a probabilistic co-learning model of sequence and structure
Nam, J.-W. (2005) · Nucleic Acids Research · doi:10.1093/nar/gki668 · Cited by 220
Hairpins in a Haystack: recognizing microRNA precursors in comparative genomics data
Hertel, J., & Stadler, P. F. (2006) · Bioinformatics · doi:10.1093/bioinformatics/btl257 · Cited by 201
The Area under the ROC Curve and Its Competitors
Hilden, J. (1991) · Medical Decision Making · doi:10.1177/0272989x9101100204 · Cited by 185 · cited 1×
“2A) is useful for evaluating a fraction of the data with high-ranked instances [36, 37].”
BackgroundExplicitly representing expected cost: an alternative to ROC representation
Drummond, C., & Holte, R. C. (2000) · Proceedings of the sixth ACM SIGKDD international conference on Knowledge discovery and data mining · doi:10.1145/347090.347126 · Cited by 181
A Kernel-Based Two-Class Classifier for Imbalanced Data Sets
Hong, X., Chen, S., & Harris, C. J. (2007) · IEEE Transactions on Neural Networks · doi:10.1109/tnn.2006.882812 · Cited by 161
Huang, T., Fan, B., Rothschild, M. F., Hu, Z., Li, K., & Zhao, S. (2007) · BMC Bioinformatics · doi:10.1186/1471-2105-8-341 · Cited by 143 · cited 3×
“In addition, we re-analyse classifier performance from a previously published study, on a popular microRNA gene discovery algorithm called MiRFinder [30].”
MethodCaveats and pitfalls of ROC analysis in clinical microarray research (and how to avoid them)
Berrar, D., & Flach, P. (2012) · Briefings in Bioinformatics · doi:10.1093/bib/bbr008 · Cited by 136
A CROC stronger than ROC: measuring, visualizing and optimizing early retrieval
Swamidass, S. J., Azencott, C., Daily, K., & Baldi, P. (2010) · Bioinformatics · doi:10.1093/bioinformatics/btq140 · Cited by 115
Data mining for improved cardiac care
Rao, R. B., Krishnan, S., & Niculescu, R. S. (2006) · ACM SIGKDD Explorations Newsletter · doi:10.1145/1147234.1147236 · Cited by 114 · cited 1×
“The rapid expansion in high-throughput biological experiments produces a number of large-sized datasets, and the majority of such datasets can be expected to be imbalanced [8, 22, 23].”
BackgroundA Review of Computational Tools in microRNA Discovery
Gomes, C. P. C., Cho, J., Hood, L., Franco, O. L., Pereira, R. W., & Wang, K. (2013) · Frontiers in Genetics · doi:10.3389/fgene.2013.00081 · Cited by 113
The problem of bias in training data in regression problems in medical decision support
Namee, B. M., Cunningham, P., Byrne, S., & Corrigan, O. I. (2002) · Artificial Intelligence in Medicine · doi:10.1016/s0933-3657(01)00092-6 · Cited by 90
Confidence Bands for ROC Curves: Methods and an Empirical Study
Macskassy, S. A., & Provost, F. J. (2004) · Faculty Digital Archive (New York University Florence) · Cited by 70
Confidence Bands for ROC Curves
Macskassy, S. A., Provost, F. J., & Littman, M. L. (2003) · Defense Technical Information Center (DTIC) · doi:10.21236/ada453849 · Cited by 43
Cited by
High-performance medicine: the convergence of human and artificial intelligence
Topol, E. J. (2019) · Nature Medicine · doi:10.1038/s41591-018-0300-7 · Cited by 10,450
Chicco, D., & Jurman, G. (2020) · BMC Genomics · doi:10.1186/s12864-019-6413-7 · Cited by 6,143
Hannun, A. Y., Rajpurkar, P., Haghpanahi, M., Tison, G. H., Bourn, C., Turakhia, M. P., & Ng, A. Y. (2019) · Nature Medicine · doi:10.1038/s41591-018-0268-3 · Cited by 3,148
Key challenges for delivering clinical impact with artificial intelligence
Kelly, C. J., Karthikesalingam, A., Suleyman, M., Corrado, G., & King, D. (2019) · BMC Medicine · doi:10.1186/s12916-019-1426-2 · Cited by 3,136
Classification assessment methods
Tharwat, A. (2021) · Applied Computing and Informatics · doi:10.1016/j.aci.2018.08.003 · Cited by 2,417
Metadata
- Authors
- Saito, T., & Rehmsmeier, M.
- Affiliations
- University of Bergen (NO)
- Corresponding author
- Saito, Takaya
- Rehmsmeier, Marc
- Venue
- PLOS ONE
- Publisher
- Public Library of Science (PLoS)
- Published
- 2015-03-04
- Volume
- 10
- Issue
- 3
- Pages
- e0118432
- ISSN
- 1932-6203 (ISSN-L)
- PMC
- PMC4349800
- OpenAlex
- W1966716734
- Cited by
- 5,309
- References
- 56
- Citations by year
- 2026: 1482 · 2025: 762 · 2024: 528 · 2023: 505 · 2022: 551 · 2021: 563 · 2020: 402 · 2019: 283 · 2018: 133 · 2017: 64 · 2016: 27 · 2015: 3
- FWCI
- 74.84
- Type
- journal article
- Language
- en
- Open access
- gold
- doi.org
- Licence
- Locations
- PLoS ONE (publishedVersion, cc-by)
- Europe PMC (PubMed Central) (publishedVersion, cc-by)
- PubMed Central (publishedVersion, cc-by)
- PubMed (publishedVersion)
- RePEc: Research Papers in Economics (submittedVersion)
- DOAJ (DOAJ: Directory of Open Access Journals) (submittedVersion, cc-by-sa)
- Funders
- Universitetet i Bergen
- Topics
- Physical Sciences › Computer Science › Artificial Intelligence › Imbalanced Data Classification Techniques
- Physical Sciences › Computer Science › Artificial Intelligence › Machine Learning and Data Classification
- Physical Sciences › Mathematics › Statistics and Probability › Statistical Methods in Epidemiology
- Keywords
- class imbalance, binary classification, classifier evaluation, specificity, positive predictive value, sensitivity, bioinformatics classification, visual interpretability
- MeSH terms
- Classification, ROC Curve, Datasets as Topic
About these checks
Registry, retraction, Cites and statistics results are computed, not judged, with one exception: a printed reference that no index lists is read once by a model before it counts as a citation error. Claims are extracted by a model and kept only when their quote appears verbatim in the text; each cited source is then checked, with a model’s help, for whether it says what the claim relies on. Those verdicts can be wrong — read the claim’s quote and the cited source before relying on one.
Statistics and arithmetic are recomputed, not judged.
Confidence bands are shown only for fields calibrated on our annotated test set. None is calibrated yet, so no band is shown.
What counts as a claim ›How we measure confidence ›How we check this ›
Are you an author, or do you see a problem with this page? Request a review
Data sources
Bibliographic data: Semantic Scholar, OpenAlex, Crossref.
Contains information from the Semantic Scholar Academic Graph Datasets, made available under the ODC Attribution License (ODC-BY 1.0).
Semantic Scholar’s data is described in: Kinney, R., et al. (2023). The Semantic Scholar Open Data Platform. arXiv:2301.10140.
