

The DOI matches its Crossref record; 73 of the 73 references it cites were found in a registry or an index.
Characterizing Newly Repopulated Microglia in the Adult Mouse: Impacts on Animal Behavior, Cell Morphology, and Neuroinflammation
Open accessAbstract
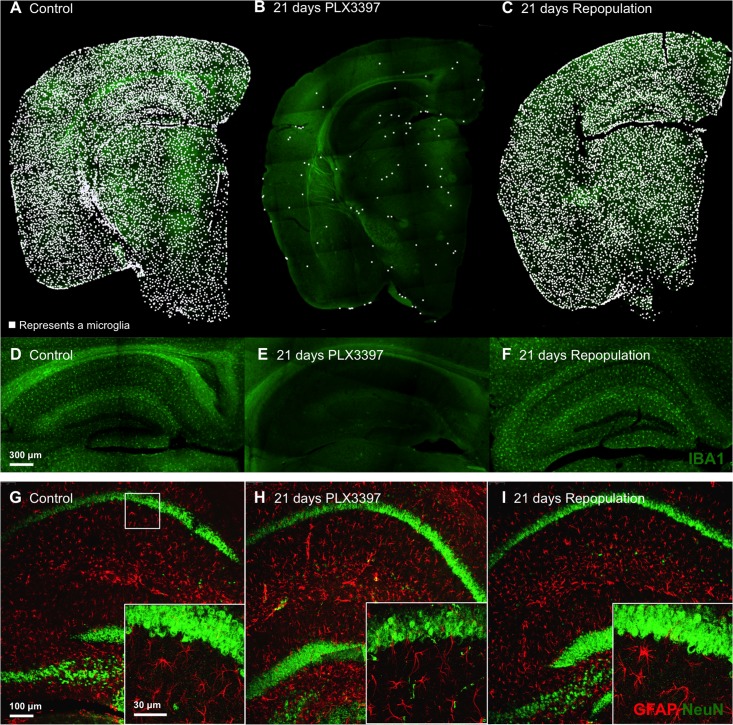
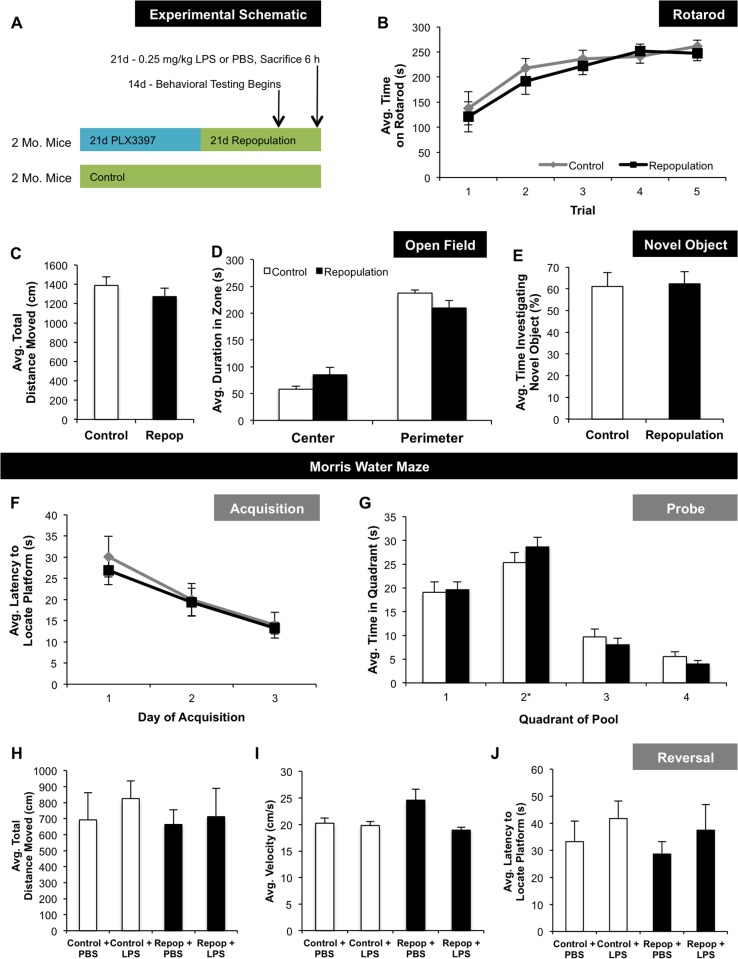
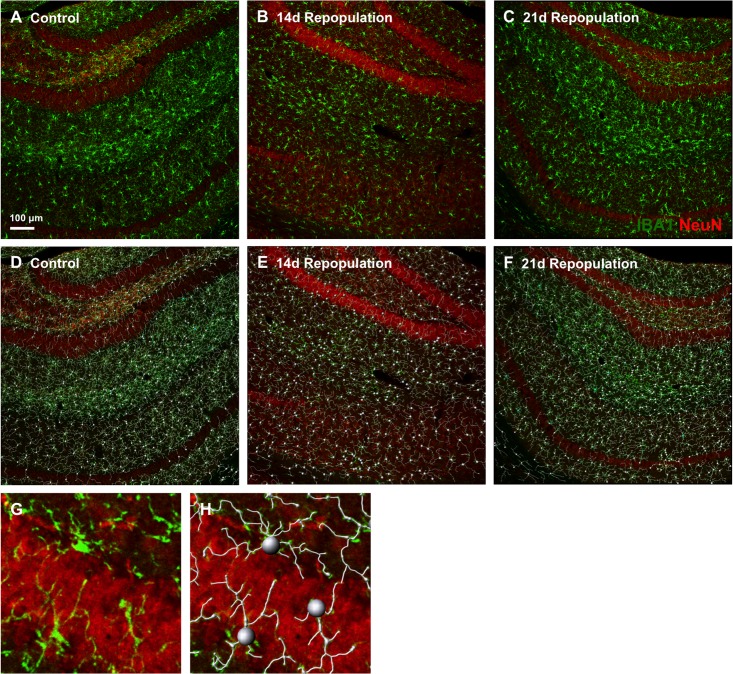
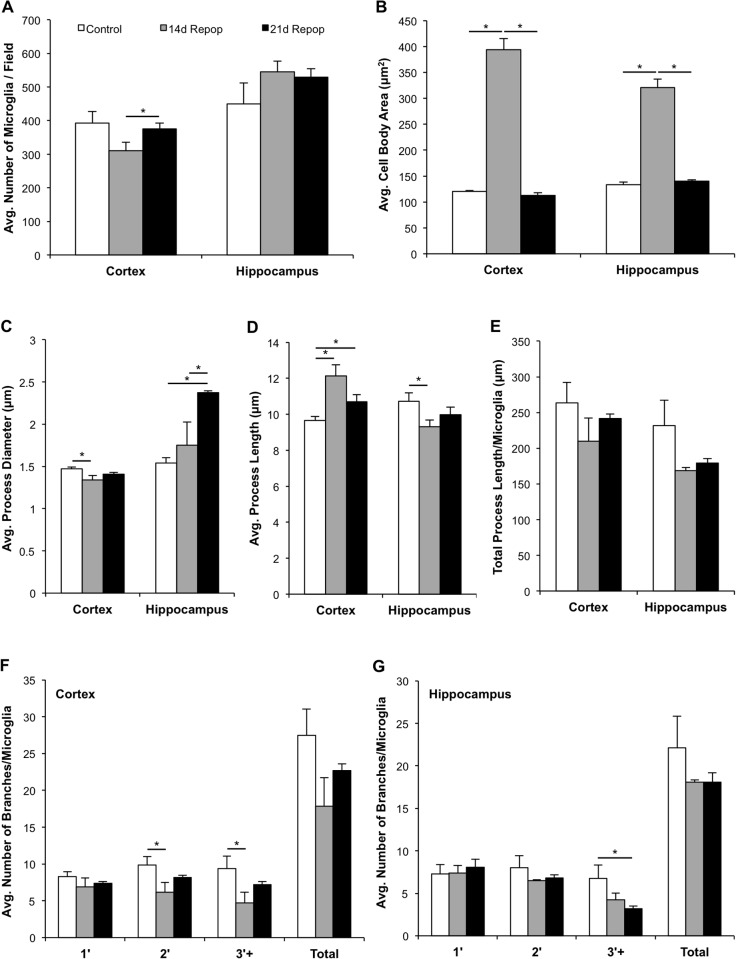
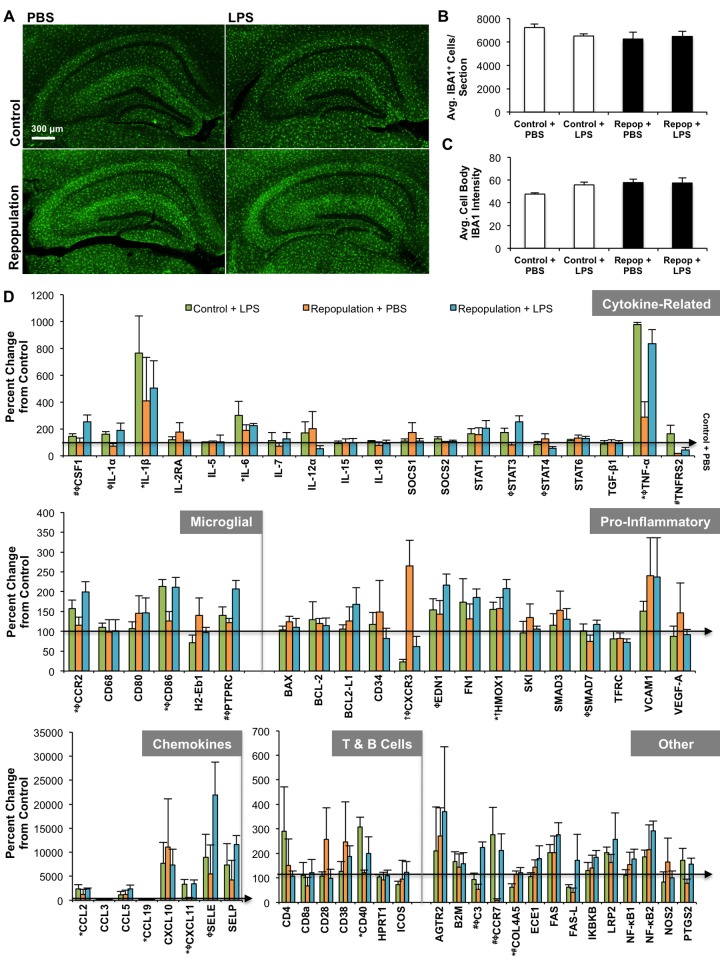
Microglia are the primary immune cell in the brain and are postulated to play important roles outside of immunity. Administration of the dual colony-stimulating factor 1 receptor (CSF1R)/c-Kit kinase inhibitor, PLX3397, to adult mice results in the elimination of ~99% of microglia, which remain eliminated for as long as treatment continues. Upon removal of the inhibitor, microglia rapidly repopulate the entire adult brain, stemming from a central nervous system (CNS) resident progenitor cell. Using this method of microglial elimination and repopulation, the role of microglia in both healthy and diseased states can be explored. Here, we examine the responsiveness of newly repopulated microglia to an inflammatory stimulus, as well as determine the impact of these cells on behavior, cognition, and neuroinflammation. Two month-old wild-type mice were placed on either control or PLX3397 diet for 21 d to eliminate microglia. PLX3397 diet was then removed in a subset of animals to allow microglia to repopulate and behavioral testing conducted beginning at 14 d repopulation. Finally, inflammatory profiling of the microglia-repopulated brain in response to lipopolysaccharide (LPS; 0.25 mg/kg) or phosphate buffered saline (PBS) was determined 21 d after inhibitor removal using quantitative real time polymerase chain reaction (RT-PCR), as well as detailed analyses of microglial morphologies. We find mice with repopulated microglia to perform similarly to controls by measures of behavior, cognition, and motor function. Compared to control/resident microglia, repopulated microglia had larger cell bodies and less complex branching in their processes, which resolved over time after inhibitor removal. Inflammatory profiling revealed that the mRNA gene expression of repopulated microglia was similar to normal resident microglia and that these new cells appear functional and responsive to LPS. Overall, these data demonstrate that newly repopulated microglia function similarly to the original resident microglia without any apparent adverse effects in healthy adult mice.
Overview
The claims and statistics of this paper haven’t been checked yet.
Run the check — free, no account needed. It reads the open-access text and checks the sources it cites.
Integrity signals
Registry
Cites
Statistics
Figures
Verification
Claims the paper makes
The claims and statistics of this paper haven’t been checked yet.
Run the check — free, no account needed. It reads the open-access text and checks the sources it cites.
Claims other papers make about this one
Each is checked against this paper’s own text: does it say what the citing paper says it does?
In the citing paper
“EGFP+Iba1+ cells were once again abundant throughout analyzed BG nuclei, similar to repopulation dynamics reported in other brain regions (Elmore et al., 2015)”
From Local cues establish and maintain region-specific phenotypes of basal ganglia microglia (2017) · cites this paper as Elmore et al., 2015
Self-check
Percentages, sums and reported differences re-computed from the paper’s own numbers.
The self-check needs the paper’s full text.
Citations
Cites
Analysis of Relative Gene Expression Data Using Real-Time Quantitative PCR and the 2−ΔΔCT Method
Livak, K. J., & Schmittgen, T. D. (2001) · Methods · doi:10.1006/meth.2001.1262 · Cited by 180,860
Polazzi, E., Mengoni, I., Caprini, M., Peña‐Altamira, E., Kurtys, E., & Monti, B. (2012) · Neurosignals · doi:10.1159/000337115 · Cited by 9,023
Glutamate neurotoxicity and diseases of the nervous system
Choi, D. W. (1988) · Neuron · doi:10.1016/0896-6273(88)90162-6 · Cited by 8,188
From inflammation to sickness and depression: when the immune system subjugates the brain
Dantzer, R., O'Connor, J. C., Freund, G. G., Johnson, R. W., & Kelley, K. W. (2008) · Nature Reviews Neuroscience · doi:10.1038/nrn2297 · Cited by 7,395
Developments of a water-maze procedure for studying spatial learning in the rat
Morris, R. (1984) · Journal of Neuroscience Methods · doi:10.1016/0165-0270(84)90007-4 · Cited by 7,180
Fate Mapping Analysis Reveals That Adult Microglia Derive from Primitive Macrophages
Ginhoux, F., Greter, M., Leboeuf, M., Nandi, S., See, P., Gokhan, S., Mehler, M. F., Conway, S. J., Ng, L. G., Stanley, E. R., et al. (2010) · Science · doi:10.1126/science.1194637 · Cited by 5,175
Morris water maze: procedures for assessing spatial and related forms of learning and memory
Vorhees, C. V., & Williams, M. T. (2006) · Nature Protocols · doi:10.1038/nprot.2006.116 · Cited by 4,629
Synaptic Pruning by Microglia Is Necessary for Normal Brain Development
Paolicelli, R. C., Bolasco, G., Pagani, F., Maggi, L., Scianni, M., Panzanelli, P., Giustetto, M., Ferreira, T. A., Guiducci, E., Dumas, L., et al. (2011) · Science · doi:10.1126/science.1202529 · Cited by 4,244
Mutation of the mouse klotho gene leads to a syndrome resembling ageing
Kuro-o, M., Matsumura, Y., Aizawa, H., Kawaguchi, H., Suga, T., Utsugi, T., Ohyama, Y., Kurabayashi, M., Kaname, T., Kume, E., et al. (1997) · Nature · doi:10.1038/36285 · Cited by 3,837
Microglia: Active sensor and versatile effector cells in the normal and pathologic brain
Hanisch, U.-K., & Kettenmann, H. (2007) · Nature Neuroscience · doi:10.1038/nn1997 · Cited by 3,676
Cited by
Sorted by citations
Items 201–227 of 227
Родина, А. В., Zhirnik, A. S., Semochkina, Y. P., Смирнова, О. Д., Ratushnyak, M. G., Шапошникова, Д. А., & Moskaleva, E. Y. (2023) · Pharmaceutical Chemistry Journal · doi:10.1007/s11094-023-02908-y
Microglia facilitate and stabilize the response to general anesthesiaPreprint
He, Y., Liu, T., He, Q., Ke, W., Li, X., Du, J., Deng, S., Shu, Z., Wu, J. S., Yang, B., et al. (2023) · eLife · doi:10.1101/2023.10.06.561235
Le, L., Eliseeva, S. I., Kara-Pabani, K., Li, H., Yarovinsky, F., & Majewska, A. K. (2024) · SSRN Electronic Journal · doi:10.2139/ssrn.4795163
Neuroinflammation: Microgliosis and astrocytosis in the days of microscopic omics
Saido, T. C. (2024) · Elsevier eBooks · doi:10.1016/b978-0-443-28979-8.00020-6
Strackeljan, L., Baidoe‐Ansah, D., Mirzapourdelavar, H., Kaushik, R., Cangalaya, C., & Dityatev, A. E. (2024) · Research Square · doi:10.21203/rs.3.rs-4859575/v1
Sensory neurostimulation promotes stress resilience with frequency-specificityPreprint
Franklin, T., Bitarafan, S., King, A. T., Goodson, M. C., Rutledge, C., Gajelli, T., Prichard, A., Zepeda-López, H. M., Kye, N., Sloan, S. A., et al. (2025) · bioRxiv (Cold Spring Harbor Laboratory) · doi:10.1101/2025.07.12.664223
CSF1R-Dependent Microglial Repopulation and Contact-Dependent Inhibition of Proliferation In Vitro
Nakai, R., Kohyama, K., Nishito, Y., & Sakuma, H. (2025) · Brain Sciences · doi:10.3390/brainsci15080825
Cainzos, S. I., Quandt, F., Borggrewe, M., Altjohann, H.-M., Magnus, T. U., & Biskamp, J. (2025) · bioRxiv (Cold Spring Harbor Laboratory) · doi:10.1101/2025.11.07.687313
Jiang, Q., Wei, X., Pan, X., Xue, S., Jiang, Q., Yan, X., Xu, X., Hu, D., & Fu, H. (2025) · Glia · doi:10.1002/glia.70117
Carroll, J. A., Race, B., Williams, K., Striebel, J. F., & Chesebro, B. W. (2020) · Figshare · doi:10.6084/m9.figshare.12269870
Carroll, J. A., Race, B., Williams, K., Striebel, J. F., & Chesebro, B. W. (2020) · Figshare · doi:10.6084/m9.figshare.12269843
Additional file 1 of Functional role of brain-engrafted macrophages against brain injuries
Feng, X., Frias, E. S., Paladini, M. S., Chen, D., Boosalis, Z., Becker, M., Gupta, S., Liu, S., Gupta, N., & Rosi, S. (2021) · Figshare · doi:10.6084/m9.figshare.16821703
Carroll, J. A., Race, B., Williams, K., Striebel, J. F., & Chesebro, B. W. (2020) · Figshare · doi:10.6084/m9.figshare.12269852
Hohsfield, L. A., Najafi, A. R., Ghorbanian, Y., Soni, N., Hingco, E. E., Kim, S. J., Jue, A. D., Swarup, V., Inlay, M. A., & Green, K. N. (2020) · Figshare · doi:10.6084/m9.figshare.12981238
Schiel, V., Bhattacharya, R., Gupta, A., Eftekharian, K., Xia, A., & Maria, P. L. S. (2024) · Figshare · doi:10.6084/m9.figshare.27020767
Carroll, J. A., Race, B., Williams, K., Striebel, J. F., & Chesebro, B. W. (2020) · Figshare · doi:10.6084/m9.figshare.12269858
Carroll, J. A., Race, B., Williams, K., Striebel, J. F., & Chesebro, B. W. (2020) · Figshare · doi:10.6084/m9.figshare.12269864
Dynamics and Impact of Repopulating Microglia Following Oligodendroglial Damage
Pietro, A. A. D., Thomas, L., & Pasquini, L. A. (2026) · Journal of Neurochemistry · doi:10.1111/jnc.70369
Involvement of microglial aging in neurodegenerative diseases: a focus on Parkinson’s disease
Ballotto, L., Kaur, G., Bubacco, L., Civiero, L., & Greggio, E. (2026) · Elsevier eBooks · doi:10.1016/b978-0-443-27340-7.00006-1 · Cited by 1
Montay‐Gruel, P. (2018) · theses.fr (ABES) · doi:10.70675/3690e256zd419z424fzb04dzc2086b30b220
Bringuier, C. M. (2020) · theses.fr (ABES) · doi:10.70675/e40cbaaazaec8z46aazaf4fz41b8415fd687
Impact cérébral précoce de l'inhalation chez le rat, le tungstène comme contaminant émergent
Macé, L. (2021) · theses.fr (ABES) · doi:10.70675/c7da5a7czefe9z4aa7zaa25z91a53cbb43b9
MafB and c-Maf transcriptional control of macrophage self-renewal and activation
Huang, H. (2021) · theses.fr (ABES) · doi:10.70675/e3a80f7dz82c4z4f22z8b5eze5bb96e6bf01
Wang, E. Y., Chen, H. S., Yang, Y. L., Wu, C. M., Chang, Y., & Lai, T. W. (2026) · Neuroreport · doi:10.1097/wnr.0000000000002286
Chokr, S. M., Jimenez, G., Hoang, J., Mai, D., Liang, H. Y., & Cramer, K. S. (2026) · Hearing Research · doi:10.1016/j.heares.2026.109715
Metadata
- Authors
- Elmore, M. R. P., Lee, R. J., West, B. L., & Green, K. N.
- Affiliations
- University of California, Irvine (US)
- Plexxikon (United States) (US)
- Corresponding author
- Green, Kim N.
- Venue
- PLoS ONE
- Publisher
- Public Library of Science (PLoS)
- Published
- 2015-04-07
- Volume
- 10
- Issue
- 4
- Pages
- e0122912
- ISSN
- 1932-6203 (ISSN-L)
- PMC
- PMC4388515
- OpenAlex
- W2169700519
- Cited by
- 228
- References
- 73
- Citations by year
- 2026: 10 · 2025: 20 · 2024: 19 · 2023: 19 · 2022: 23 · 2021: 32 · 2020: 26 · 2019: 28 · 2018: 23 · 2017: 18 · 2016: 6 · 2015: 4
- FWCI
- 9.07
- Type
- journal article
- Language
- en
- Open access
- gold
- doi.org
- Licence
- Locations
- PLoS ONE (publishedVersion, cc-by)
- PubMed Central (publishedVersion, cc-by)
- PubMed (publishedVersion)
- DOAJ (DOAJ: Directory of Open Access Journals) (submittedVersion, cc-by-sa)
- eScholarship (California Digital Library) (submittedVersion)
- Funders
- Plexxikon
- National Institute on Aging (T32AG000096)
- National Institute of Neurological Disorders and Stroke (R01NS083801)
- Topics
- Life Sciences › Neuroscience › Neurology › Neuroinflammation and Neurodegeneration Mechanisms
- Life Sciences › Neuroscience › Developmental Neuroscience › Neurogenesis and neuroplasticity mechanisms
- Life Sciences › Neuroscience › Biological Psychiatry › Tryptophan and brain disorders
- Keywords
- microglia, microglial repopulation, PLX3397, CSF1R inhibition, lipopolysaccharide response, neuroinflammation, microglial morphology, cognitive function, motor function, brain immune cells
- MeSH terms
- Animals, Brain, Cells, Cultured, Central Nervous System Diseases, Cognition, Female, Inflammation, Lipopolysaccharides, Male, Mice, Inbred C57BL, Motor Activity, Nerve Regeneration, Microglia, Maze Learning, Rotarod Performance Test, Cell Shape
About these checks
Registry, retraction, Cites and statistics results are computed, not judged, with one exception: a printed reference that no index lists is read once by a model before it counts as a citation error. Claims are extracted by a model and kept only when their quote appears verbatim in the text; each cited source is then checked, with a model’s help, for whether it says what the claim relies on. Those verdicts can be wrong — read the claim’s quote and the cited source before relying on one.
Statistics and arithmetic are recomputed, not judged.
Confidence bands are shown only for fields calibrated on our annotated test set. None is calibrated yet, so no band is shown.
What counts as a claim ›How we measure confidence ›How we check this ›
Are you an author, or do you see a problem with this page? Request a review
