

The DOI matches its Crossref record; 2 of the 2 references it cites were found in a registry or an index.
Deep Phylogenetic Analysis of Haplogroup G1 Provides Estimates of SNP and STR Mutation Rates on the Human Y-Chromosome and Reveals Migrations of Iranic Speakers
Overview
The claims and statistics of this paper haven’t been checked yet.
Run the check — free, no account needed. It reads the open-access text and checks the sources it cites.
Integrity signals
Registry
Cites
Statistics
Figures
Verification
Claims the paper makes
The claims and statistics of this paper haven’t been checked yet.
Run the check — free, no account needed. It reads the open-access text and checks the sources it cites.
Claims other papers make about this one
Each is checked against this paper’s own text: does it say what the citing paper says it does?
In the citing paper
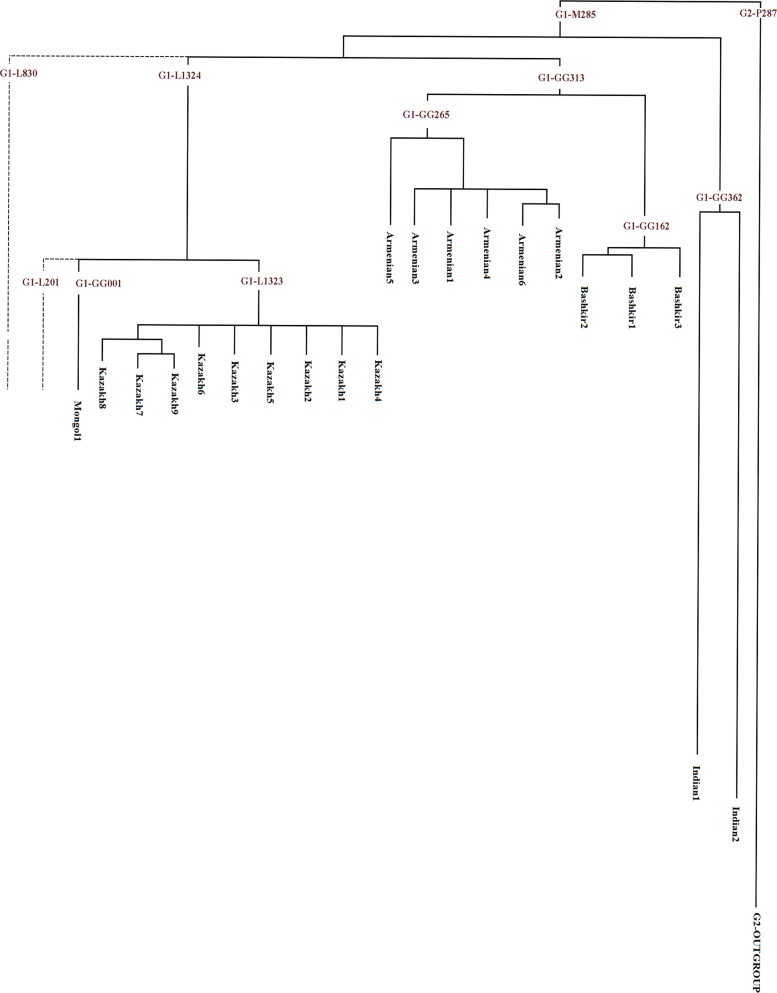
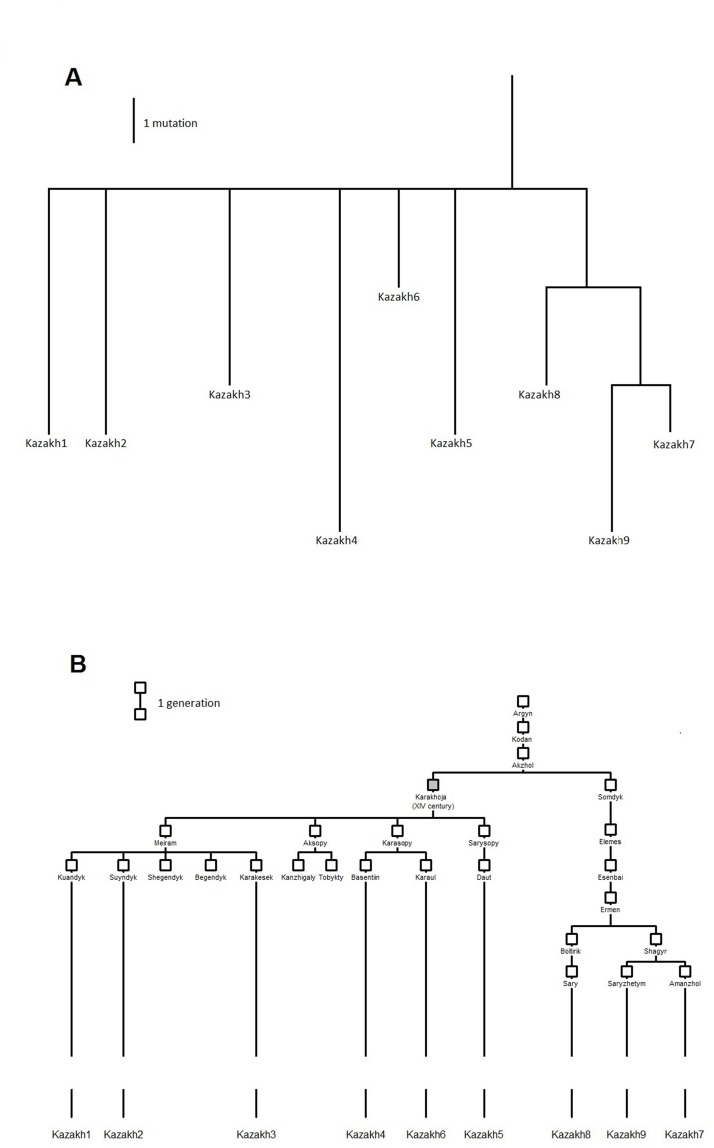
“mini-cluster G1 (ε2) has related haplotypes among the Kazakh tribe Argyn33”
From The Connection of the Genetic, Cultural and Geographic Landscapes of Transoxiana (2017) · cites this paper as [33]
Self-check
Percentages, sums and reported differences re-computed from the paper’s own numbers.
The self-check needs the paper’s full text.
Citations
Cites
The Genetic Legacy of the Mongols
Zerjal, T., Xue, Y., Bertorelle, G., Wells, R. S., Bao, W., Zhu, S., Qamar, R., Ayub, Q., Mohyuddin, A., Fu, S., et al. (2003) · The American Journal of Human Genetics · doi:10.1086/367774 · Cited by 563
Self-citationFenner, J. N. (2005) · American Journal of Physical Anthropology · doi:10.1002/ajpa.20188 · Cited by 508
Research works printed but not linked: 45
- KK Abu-Amero, 2009, Saudi Arabian Y-Chromosome diversity and its relationship with nearby regions, BMC genetics, 10, 59, 10.1186/1471-2156-10-59 · DOI · Paper page
- O Balanovsky, 2011, Parallel evolution of genes and languages in the Caucasus region, Molecular biology and evolution, 28, 2905, 10.1093/molbev/msr126 · DOI
- O Balanovsky, 2008, Two sources of the Russian patrilineal heritage in their Eurasian context, Am J Hum Genet, 82, 236, 10.1016/j.ajhg.2007.09.019 · DOI
- H-J Bandelt, 1995, Mitochondrial Portraits of Human Populations Using Median Networks, Genetics, 41, 743, 10.1093/genetics/141.2.743 · DOI
- AZ Biro, 2009, A Y-chromosomal comparison of the Madjars (Kazakhstan) and the Magyars (Hungary), American journal of physical anthropology, 139, 305, 10.1002/ajpa.20984 · DOI
- A Boattini, 2013, Uniparental markers in Italy reveal a sex-biased genetic structure and different historical strata, PloS one, 8, e65441, 10.1371/journal.pone.0065441 · DOI
- AM Cadenas, 2008, Y-chromosome diversity characterizes the Gulf of Oman, European journal of human genetics: EJHG, 16, 374, 10.1038/sj.ejhg.5201934 · DOI
- S Chennakrishnaiah, 2013, Indigenous and foreign Y-chromosomes characterize the Lingayat and Vokkaliga populations of Southwest India, Gene, 526, 96, 10.1016/j.gene.2013.04.074 · DOI
- C Cinnioglu, 2004, Excavating Y-chromosome haplotype strata in Anatolia, Human genetics, 114, 127, 10.1007/s00439-003-1031-4 · DOI · Paper page
- J Di Cristofaro, 2013, Afghan Hindu Kush: where Eurasian sub-continent gene flows converge, PloS one, 8, e76748, 10.1371/journal.pone.0076748 · DOI · Paper page
- AJ Drummond, 2012, Bayesian phylogenetics with BEAUti and the BEAST 1.7, Molecular biology and evolution, 29, 1969, 10.1093/molbev/mss075 · DOI
- M Eaaswarkhanth, 2010, Traces of sub-Saharan and Middle Eastern lineages in Indian Muslim populations, European journal of human genetics: EJHG, 18, 354, 10.1038/ejhg.2009.168 · DOI
- L Excoffier, 2010, Arlequin suite ver 3.5: a new series of programs to perform population genetics analyses under Linux and Windows, Molecular ecology resources, 10, 564, 10.1111/j.1755-0998.2010.02847.x · DOI
- P Forster, 1996, Origin and Evolution of Native American mtDNA variation: A Reappraisal, Am J Hum Genet, 59, 935
- P Forster, 2001, Phylogenetic Star Contraction Applied to Asian and Papuan mtDNA Evolution, Molecular biology and evolution, 18, 1864, 10.1093/oxfordjournals.molbev.a003728 · DOI
- P Francalacci, 2013, Low-Pass DNA Sequencing of 1200 Sardinians Reconstructs European Y-Chromosome Phylogeny, Science, 341, 565, 10.1126/science.1237947 · DOI
- J Ge, 2009, Mutation rates at Y chromosome short tandem repeats in Texas populations, Forensic science international Genetics, 3, 179, 10.1016/j.fsigen.2009.01.007 · DOI
- PA Goloboff, 2008, TNT, a free program for phylogenetic analysis, Cladistics, 24, 774, 10.1111/j.1096-0031.2008.00217.x · DOI · Paper page
- V Grugni, 2012, Ancient migratory events in the Middle East: new clues from the Y-chromosome variation of modern Iranians, PloS one, 7, e41252, 10.1371/journal.pone.0041252 · DOI
- L Gusmao, 2005, Mutation rates at Y chromosome specific microsatellites, Human mutation, 26, 520, 10.1002/humu.20254 · DOI
- M Haber, 2012, Afghanistan's ethnic groups share a Y-chromosomal heritage structured by historical events, PloS one, 7, e34288, 10.1371/journal.pone.0034288 · DOI · Paper page
- M Haber, 2011, Influences of history, geography, and religion on genetic structure: the Maronites in Lebanon, European journal of human genetics: EJHG, 19, 334, 10.1038/ejhg.2010.177 · DOI · Paper page
- Heath T. Understanding the importance of taxonomic sampling for large-scale phylogenetic analyses by simulating evolutionary processes under complex models [Doctoral thesis,]. Ausyin2008.
- KJ Herrera, 2012, Neolithic patrilineal signals indicate that the Armenian plateau was repopulated by agriculturalists, European journal of human genetics: EJHG, 20, 313, 10.1038/ejhg.2011.192 · DOI
- T Karafet, 2001, Paternal Population History of East Asia: Sources, Patterns, and Microevolutionary Processes, Am J Hum Genet, 69, 615, 10.1086/323299 · DOI
- TM Karafet, 2008, New binary polymorphisms reshape and increase resolution of the human Y chromosomal haplogroup tree, Genome Res, 18, 830, 10.1101/gr.7172008 · DOI · Paper page
- L Khachikyan, 1969, Pages from the history of Hamshen Armenians, Bulletin of Yerevan State University, 2, 115
- T Kivisild, 2003, The Genetic Heritage of the Earliest Settlers Persists Both in Indian Tribal and Caste Populations, Am J Hum Genet, 72, 313, 10.1086/346068 · DOI
- Z Lashgary, 2011, Y chromosome diversity among the Iranian religious groups: a reservoir of genetic variation, Ann Hum Biol, 38, 364, 10.3109/03014460.2010.535562 · DOI
- A Margaryan, 2012, Paternal lineage analysis supports an Armenian rather than a Central Asian genetic origin of the Hamshenis, Hum Biol, 84, 405, 10.3378/027.084.0404 · DOI
- FL Mendez, 2013, An African American paternal lineage adds an extremely ancient root to the human Y chromosome phylogenetic tree, Am J Hum Genet, 92, 454, 10.1016/j.ajhg.2013.02.002 · DOI
- T Polzin, 2003, On Steiner trees and minimum spanning trees in hypergraphs, Operations Research Letters, 31, 12, 10.1016/S0167-6377(02)00185-2 · DOI
- GD Poznik, 2013, Sequencing Y chromosomes resolves discrepancy in time to common ancestor of males versus females, Science, 341, 562, 10.1126/science.1237619 · DOI · Paper page
- M Regueiro, 2006, Iran: tricontinental nexus for Y-chromosome driven migration, Hum Hered, 61, 132, 10.1159/000093774 · DOI
- S Rootsi, 2013, Phylogenetic applications of whole Y-chromosome sequences and the Near Eastern origin of Ashkenazi Levites, Nat Commun, 4, 2928, 10.1038/ncomms3928 · DOI
- S Rootsi, 2012, Distinguishing the co-ancestries of haplogroup G Y-chromosomes in the populations of Europe and the Caucasus, European journal of human genetics: EJHG, 20, 1275, 10.1038/ejhg.2012.86 · DOI · Paper page
- J Saillard, 2000, mtDNA Variation among Greenland Eskimos: The Edge of the Beringian Expansion, Am J Hum Genet, 67, 718, 10.1086/303038 · DOI · Paper page
- P Sanchez-Diz, 2008, Population and segregation data on 17 Y-STRs: results of a GEP-ISFG collaborative study, International journal of legal medicine, 122, 529, 10.1007/s00414-008-0265-z · DOI
- S Sengupta, 2006, Polarity and Temporality of High-Resolution Y-Chromosome Distributions in India Identify Both Indigenous and Exogenous Expansions and Reveal Minor Genetic Influence of Central Asian Pastoralists, Am J Hum Genet, 78, 203, 10.1086/499411 · DOI · Paper page
- W Wei, 2013, A calibrated human Y-chromosomal phylogeny based on resequencing, Genome Res, 23, 388, 10.1101/gr.143198.112 · DOI
- Y Xue, 2009, Human Y chromosome base-substitution mutation rate measured by direct sequencing in a deep-rooting pedigree, Curr Biol, 19, 1453, 10.1016/j.cub.2009.07.032 · DOI
- Y Xue, 2006, Male demography in East Asia: a north-south contrast in human population expansion times, Genetics, 172, 2431, 10.1534/genetics.105.054270 · DOI
- B Yunusbayev, 2012, The Caucasus as an asymmetric semipermeable barrier to ancient human migrations, Molecular biology and evolution, 29, 359, 10.1093/molbev/msr221 · DOI
- LA Zhivotovsky, 2004, The Effective Mutation Rate at Y Chromosome Short Tandem Repeats, with Application to Human Population-Divergence Time, Am J Hum Genet, 74, 50, 10.1086/380911 · DOI
- H Zhong, 2010, Global distribution of Y-chromosome haplogroup C reveals the prehistoric migration routes of African exodus and early settlement in East Asia, J Hum Genet, 55, 428, 10.1038/jhg.2010.40 · DOI · Paper page
Cited by
Punctuated bursts in human male demography inferred from 1,244 worldwide Y-chromosome sequences
The 1000 Genomes Project Consortium, Poznik, G. D., Xue, Y., Mendez, F. L., Willems, T. F., Massaia, A., Wilson Sayres, M. A., Ayub, Q., McCarthy, S. A., Narechania, A., et al. (2016) · Nature Genetics · doi:10.1038/ng.3559 · Cited by 331
Self-citationThe Connection of the Genetic, Cultural and Geographic Landscapes of Transoxiana
Zhabagin, M., Balanovska, E., Sabitov, Z., Kuznetsova, M., Agdzhoyan, A., Balaganskaya, O., Chukhryaeva, M., Markina, N., Romanov, A., Skhalyakho, R., et al. (2017) · Scientific Reports · doi:10.1038/s41598-017-03176-z · Cited by 39
Self-citationZhabagin, M., Wei, L.-H., Sabitov, Z., Ma, P.-C., Sun, J., Dyussenova, Z., Balanovska, E., Li, H., & Ramankulov, Y. (2022) · Genes · doi:10.3390/genes13101776 · Cited by 17
Self-citationMedieval Super-Grandfather founder of Western Kazakh Clans from Haplogroup C2a1a2-M48
Zhabagin, M., Sabitov, Z., Tazhigulova, I., Alborova, I., Agdzhoyan, A., Wei, L.-H., Urasin, V., Koshel, S., Mustafin, K., Akilzhanova, A., et al. (2021) · Journal of Human Genetics · doi:10.1038/s10038-021-00901-5 · Cited by 16
Self-citationGenetic polymorphism of Y-chromosome in Kazakh populations from Southern Kazakhstan
Ashirbekov, Y., Seidualy, M., Abaildayev, A., Maxutova, A., Zhunussova, A., Akilzhanova, A., Sharipov, K., Sabitov, Z., & Zhabagin, M. (2023) · BMC Genomics · doi:10.1186/s12864-023-09753-z · Cited by 12
Self-citation
Metadata
- Authors
- Balanovsky, O., Zhabagin, M., Agdzhoyan, A., Chukhryaeva, M., Zaporozhchenko, V., Utevska, O., Highnam, G., Sabitov, Z., Greenspan, E., Dibirova, K., Skhalyakho, R., Kuznetsova, M., Koshel, S., Yusupov, Y., Nymadawa, P., Zhumadilov, Z., Pocheshkhova, E., Haber, M., A. Zalloua, P., Yepiskoposyan, L., Dybo, A., Tyler-Smith, C., & Balanovska, E.
- Venue
- PLOS ONE
- Publisher
- Public Library of Science (PLoS)
- Published
- 2015-04-07
- Volume
- 10
- Issue
- 4
- Pages
- e0122968
- ISSN
- 1932-6203
- PMC
- PMC4388827
- Cited by
- 40
- References
- 2
- Language
- en
About these checks
Registry, retraction, Cites and statistics results are computed, not judged, with one exception: a printed reference that no index lists is read once by a model before it counts as a citation error. Claims are extracted by a model and kept only when their quote appears verbatim in the text; each cited source is then checked, with a model’s help, for whether it says what the claim relies on. Those verdicts can be wrong — read the claim’s quote and the cited source before relying on one.
Statistics and arithmetic are recomputed, not judged.
Confidence bands are shown only for fields calibrated on our annotated test set. None is calibrated yet, so no band is shown.
What counts as a claim ›How we measure confidence ›How we check this ›
Are you an author, or do you see a problem with this page? Request a review
How to cite
Cite CoChat for the checks on this page, and the paper for its own findings.
- This page
- CoChat. (2026). Citation check: Deep Phylogenetic Analysis of Haplogroup G1 Provides Estimates of SNP and STR Mutation Rates on the Human Y-Chromosome and Reveals Migrations of Iranic Speakers. https://app.cochat.ai/papers/10.1371/journal.pone.0122968
- The paper
- Balanovsky, O., Zhabagin, M., Agdzhoyan, A., Chukhryaeva, M., Zaporozhchenko, V., Utevska, O., Highnam, G., Sabitov, Z., Greenspan, E., Dibirova, K., Skhalyakho, R., Kuznetsova, M., Koshel, S., Yusupov, Y., Nymadawa, P., Zhumadilov, Z., Pocheshkhova, E., Haber, M., A. Zalloua, P., . . . Balanovska, E. (2015). Deep Phylogenetic Analysis of Haplogroup G1 Provides Estimates of SNP and STR Mutation Rates on the Human Y-Chromosome and Reveals Migrations of Iranic Speakers. PLOS ONE. https://doi.org/10.1371/journal.pone.0122968
