

The DOI matches its Crossref record; 77 of the 77 references it cites were found in a registry or an index.
MicroRNA Profiling of CSF Reveals Potential Biomarkers to Detect Alzheimer`s Disease
Open accessAbstract
The miRBase-21 database currently lists 1881 microRNA (miRNA) precursors and 2585 unique mature human miRNAs. Since their discovery, miRNAs have proved to present a new level of epigenetic post-transcriptional control of protein synthesis. Initial results point to a possible involvement of miRNA in Alzheimer's disease (AD). We applied OpenArray technology to profile the expression of 1178 unique miRNAs in cerebrospinal fluid (CSF) samples of AD patients (n = 22) and controls (n = 28). Using a Cq of 34 as cut-off, we identified positive signals for 441 miRNAs, while 729 miRNAs could not be detected, indicating that at least 37% of miRNAs are present in the brain. We found 74 miRNAs being down- and 74 miRNAs being up-regulated in AD using a 1.5 fold change threshold. By applying the new explorative "Measure of relevance" method, 6 reliable and 9 informative biomarkers were identified. Confirmatory MANCOVA revealed reliable miR-100, miR-146a and miR-1274a as differentially expressed in AD reaching Bonferroni corrected significance. MANCOVA also confirmed differential expression of informative miR-103, miR-375, miR-505#, miR-708, miR-4467, miR-219, miR-296, miR-766 and miR-3622b-3p. Discrimination analysis using a combination of miR-100, miR-103 and miR-375 was able to detect AD in CSF by positively classifying controls and AD cases with 96.4% and 95.5% accuracy, respectively. Referring to the Ingenuity database we could identify a set of AD associated genes that are targeted by these miRNAs. Highly predicted targets included genes involved in the regulation of tau and amyloid pathways in AD like MAPT, BACE1 and mTOR.
Overview
The claims and statistics of this paper haven’t been checked yet.
Run the check — free, no account needed. It reads the open-access text and checks the sources it cites.
Integrity signals
Registry
Cites
Statistics
Figures
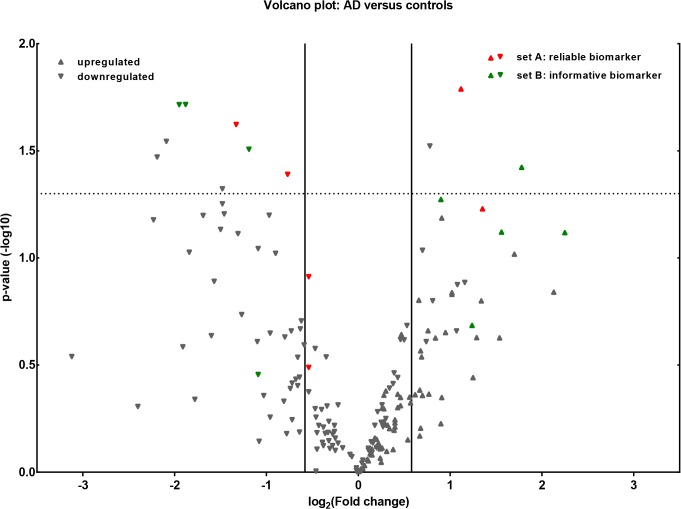
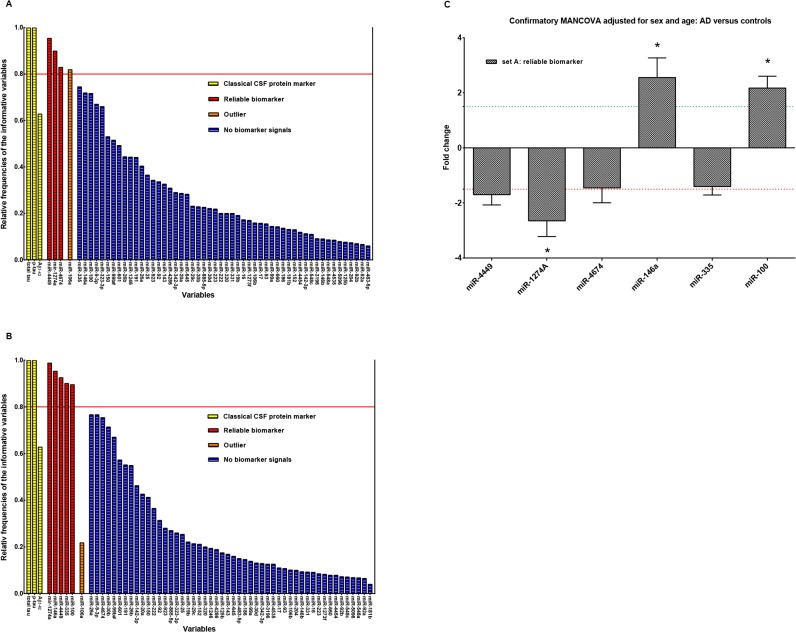
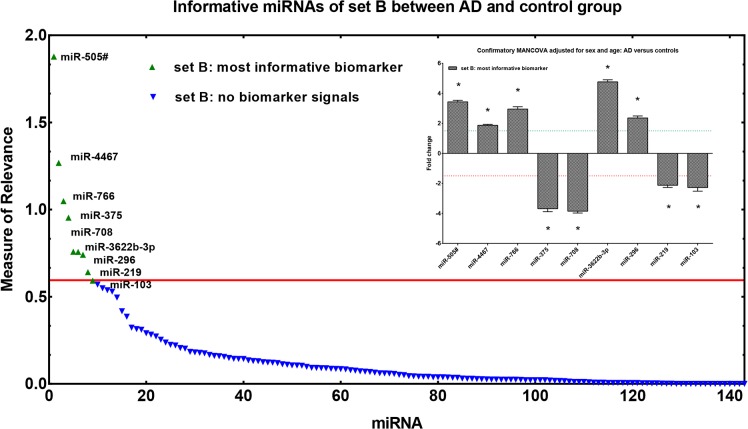
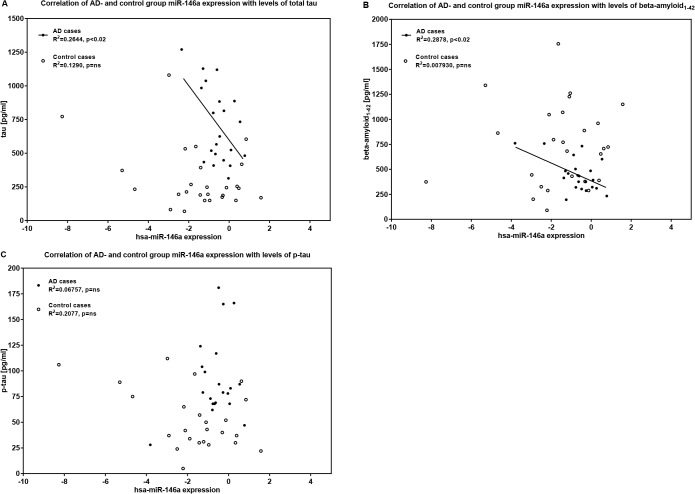
Verification
Claims the paper makes
The claims and statistics of this paper haven’t been checked yet.
Run the check — free, no account needed. It reads the open-access text and checks the sources it cites.
Claims other papers make about this one
Each is checked against this paper’s own text: does it say what the citing paper says it does?
The cited source says what the claim attributes to it.
In the citing paper
“However, there has been a lack of consistent findings among CSF microRNAs studies.”
From Intra- and Inter-individual Variability of microRNA Levels in Human Cerebrospinal Fluid: Critical Implications for Biomarker Discovery (2017) · cites this paper as [12]
Self-check
Percentages, sums and reported differences re-computed from the paper’s own numbers.
The self-check needs the paper’s full text.
Citations
Cites
Analysis of Relative Gene Expression Data Using Real-Time Quantitative PCR and the 2−ΔΔCT Method
Livak, K. J., & Schmittgen, T. D. (2001) · Methods · doi:10.1006/meth.2001.1262 · Cited by 180,860
McKhann, G. M., Knopman, D. S., Chertkow, H., Hyman, B. T., Jack, C. R., Kawas, C. H., Klunk, W. E., Koroshetz, W. J., Manly, J. J., Mayeux, R., et al. (2011) · Alzheimer's & Dementia · doi:10.1016/j.jalz.2011.03.005 · Cited by 18,657
The MIQE guidelines: minimum information for publication of quantitative real-time PCR experiments
Bustin, S. A., Benes, V., Garson, J. A., Hellemans, J., Huggett, J., Kubista, M., Mueller, R., Nolan, T., Pfaffl, M. W., Shipley, G. L., et al. (2009) · Clinical Chemistry · doi:10.1373/clinchem.2008.112797 · Cited by 16,303
Albert, M. S., DeKosky, S. T., Dickson, D., Dubois, B., Feldman, H. H., Fox, N. C., Gamst, A., Holtzman, D. M., Jagust, W. J., Petersen, R. C., et al. (2011) · Alzheimer's & Dementia · doi:10.1016/j.jalz.2011.03.008 · Cited by 10,152
Mild cognitive impairment as a diagnostic entity
Petersen, R. C. (2004) · Journal of Internal Medicine · doi:10.1111/j.1365-2796.2004.01388.x · Cited by 7,864
Sperling, R. A., Aisen, P. S., Beckett, L. A., Bennett, D. A., Craft, S., Fagan, A. M., Iwatsubo, T., Jack, C. R., Kaye, J., Montine, T. J., et al. (2011) · Alzheimer's & Dementia · doi:10.1016/j.jalz.2011.03.003 · Cited by 7,155
Alzheimer's Disease: Genes, Proteins, and Therapy
Selkoe, D. J. (2001) · Physiological Reviews · doi:10.1152/physrev.2001.81.2.741 · Cited by 6,063
Sensitivity of revised diagnostic criteria for the behavioural variant of frontotemporal dementia
Rascovsky, K., Hodges, J. R., Knopman, D., Mendez, M. F., Kramer, J. H., Neuhaus, J., van Swieten, J. C., Seelaar, H., Dopper, E. G. P., Onyike, C. U., et al. (2011) · Brain · doi:10.1093/brain/awr179 · Cited by 5,221
(2008) · doi:10.1038/nrg2290 · Cited by 5,199
Classification of primary progressive aphasia and its variants
Gorno-Tempini, M. L., Hillis, A. E., Weintraub, S., Kertesz, A., Mendez, M., Cappa, S. F., Ogar, J. M., Rohrer, J. D., Black, S., Boeve, B. F., et al. (2011) · Neurology · doi:10.1212/wnl.0b013e31821103e6 · Cited by 5,141
Cited by
Sorted by citations
Are circulating microRNAs peripheral biomarkers for Alzheimer's disease?
Kumar, S., & Reddy, P. H. (2016) · Biochimica et Biophysica Acta (BBA) - Molecular Basis of Disease · doi:10.1016/j.bbadis.2016.06.001 · Cited by 292
Circulating microRNAs as potential biomarkers for psychiatric and neurodegenerative disorders
van den Berg, M. M. J., Krauskopf, J., Ramaekers, J. G., Kleinjans, J. C. S., Prickaerts, J., & Briedé, J. J. (2019) · Progress in Neurobiology · doi:10.1016/j.pneurobio.2019.101732 · Cited by 260
Advances in the development of new biomarkers for Alzheimer’s disease
Klyucherev, T. O., Olszewski, P., Shalimova, A. A., Chubarev, V. N., Tarasov, V. V., Attwood, M. M., Syvänen, S., & Schiöth, H. B. (2022) · Translational Neurodegeneration · doi:10.1186/s40035-022-00296-z · Cited by 241
Biomarkers for the Early Detection and Progression of Alzheimer's Disease
Counts, S. E., Ikonomovic, M. D., Mercado, N., Vega, I. E., & Mufson, E. J. (2017) · Neurotherapeutics · doi:10.1007/s13311-016-0481-z · Cited by 224
miR-21 and miR-146a: The microRNAs of inflammaging and age-related diseases
Olivieri, F., Prattichizzo, F., Giuliani, A., Matacchione, G., Rippo, M. R., Sabbatinelli, J., & Bonafè, M. (2021) · Ageing Research Reviews · doi:10.1016/j.arr.2021.101374 · Cited by 228
Metadata
- Authors
- Denk, J., Boelmans, K., Siegismund, C., Lassner, D., Arlt, S., & Jahn, H.
- Affiliations
- University Medical Center Hamburg-Eppendorf (DE)
- Institut Kardiale Diagnostik und Therapie (DE)
- Corresponding author
- Jahn, Holger
- Venue
- PLOS ONE
- Publisher
- Public Library of Science (PLoS)
- Published
- 2015-05-20
- Volume
- 10
- Issue
- 5
- Pages
- e0126423
- ISSN
- 1932-6203 (ISSN-L)
- PMC
- PMC4439119
- OpenAlex
- W1487838396
- Cited by
- 236
- References
- 77
- Citations by year
- 2026: 5 · 2025: 11 · 2024: 15 · 2023: 15 · 2022: 18 · 2021: 44 · 2020: 22 · 2019: 24 · 2018: 24 · 2017: 30 · 2016: 21 · 2015: 7
- FWCI
- 9.04
- Type
- journal article
- Language
- en
- Open access
- gold
- doi.org
- Licence
- Locations
- PLoS ONE (publishedVersion, cc-by)
- Europe PMC (PubMed Central) (publishedVersion, cc-by)
- PubMed Central (publishedVersion, cc-by)
- PubMed (publishedVersion)
- DOAJ (DOAJ: Directory of Open Access Journals) (submittedVersion, cc-by-sa)
- Figshare (submittedVersion, cc-by)
- Topics
- Life Sciences › Biochemistry, Genetics and Molecular Biology › Cancer Research › MicroRNA in disease regulation
- Life Sciences › Neuroscience › Cellular and Molecular Neuroscience › Alzheimer's disease research and treatments
- Health Sciences › Medicine › Psychiatry and Mental health › Dementia and Cognitive Impairment Research
- Keywords
- Alzheimer's disease, miRNA expression profiling, cerebrospinal fluid, biomarkers, miR-100, miR-103, miR-375, miR-146a, microRNA expression, OpenArray, disease diagnosis, MAPT, BACE1, mTOR
- MeSH terms
- Aged, Alzheimer Disease, Female, Humans, Male, Middle Aged, Signal Transduction, Biomarkers, Discriminant Analysis, Aspartic Acid Endopeptidases, tau Proteins, Oligonucleotide Array Sequence Analysis, Gene Expression Profiling, MicroRNAs, Epigenesis, Genetic, Amyloid Precursor Protein Secretases, TOR Serine-Threonine Kinases
About these checks
Registry, retraction, Cites and statistics results are computed, not judged, with one exception: a printed reference that no index lists is read once by a model before it counts as a citation error. Claims are extracted by a model and kept only when their quote appears verbatim in the text; each cited source is then checked, with a model’s help, for whether it says what the claim relies on. Those verdicts can be wrong — read the claim’s quote and the cited source before relying on one.
Statistics and arithmetic are recomputed, not judged.
Confidence bands are shown only for fields calibrated on our annotated test set. None is calibrated yet, so no band is shown.
What counts as a claim ›How we measure confidence ›How we check this ›
Are you an author, or do you see a problem with this page? Request a review
