

The DOI matches its Crossref record; 59 of the 60 references it cites were found in a registry or an index; none of the 35 sources its claims cite is checked for support yet.
Can DNA-Based Ecosystem Assessments Quantify Species Abundance? Testing Primer Bias and Biomass—Sequence Relationships with an Innovative Metabarcoding Protocol
Open accessAbstract
Metabarcoding is an emerging genetic tool to rapidly assess biodiversity in ecosystems. It involves high-throughput sequencing of a standard gene from an environmental sample and comparison to a reference database. However, no consensus has emerged regarding laboratory pipelines to screen species diversity and infer species abundances from environmental samples. In particular, the effect of primer bias and the detection limit for specimens with a low biomass has not been systematically examined, when processing samples in bulk. We developed and tested a DNA metabarcoding protocol that utilises the standard cytochrome c oxidase subunit I (COI) barcoding fragment to detect freshwater macroinvertebrate taxa. DNA was extracted in bulk, amplified in a single PCR step, and purified, and the libraries were directly sequenced in two independent MiSeq runs (300-bp paired-end reads). Specifically, we assessed the influence of specimen biomass on sequence read abundance by sequencing 31 specimens of a stonefly species with known haplotypes spanning three orders of magnitude in biomass (experiment I). Then, we tested the recovery of 52 different freshwater invertebrate taxa of similar biomass using the same standard barcoding primers (experiment II). Each experiment was replicated ten times to maximise statistical power. The results of both experiments were consistent across replicates. We found a distinct positive correlation between species biomass and resulting numbers of MiSeq reads. Furthermore, we reliably recovered 83% of the 52 taxa used to test primer bias. However, sequence abundance varied by four orders of magnitudes between taxa despite the use of similar amounts of biomass. Our metabarcoding approach yielded reliable results for high-throughput assessments. However, the results indicated that primer efficiency is highly species-specific, which would prevent straightforward assessments of species abundance and biomass in a sample. Thus, PCR-based metabarcoding assessments of biodiversity should rely on presence-absence metrics.
Overview
AI snapshot
Written from the paper’s full text.
TL;DR
This study developed and tested a replicated COI metabarcoding protocol for freshwater macroinvertebrates, using bulk DNA extraction and Illumina MiSeq sequencing. It found a strong biomass–read relationship within a single species, but strong species-specific primer bias across taxa, concluding that PCR-based metabarcoding cannot reliably quantify species abundance or biomass and should be used for presence–absence assessments.
Key findings
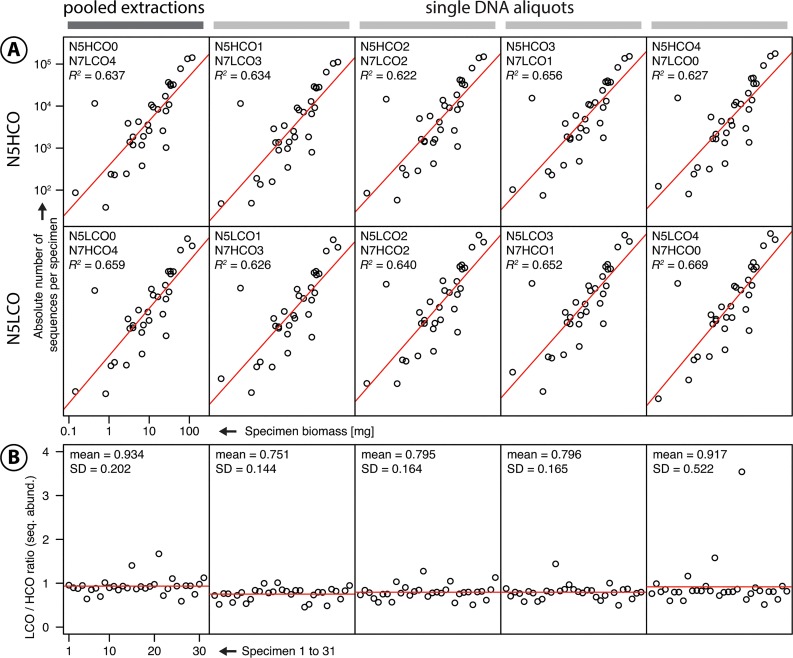
- In experiment I, all 31 *Dinocras cephalotes* specimens were recovered across ten replicates, including the smallest specimen at 0.023% (0.145 mg) of total biomass; specimen biomass and sequence abundance showed a highly significant positive linear correlation in all ten replicates (p<0.001, R² = 0.65).
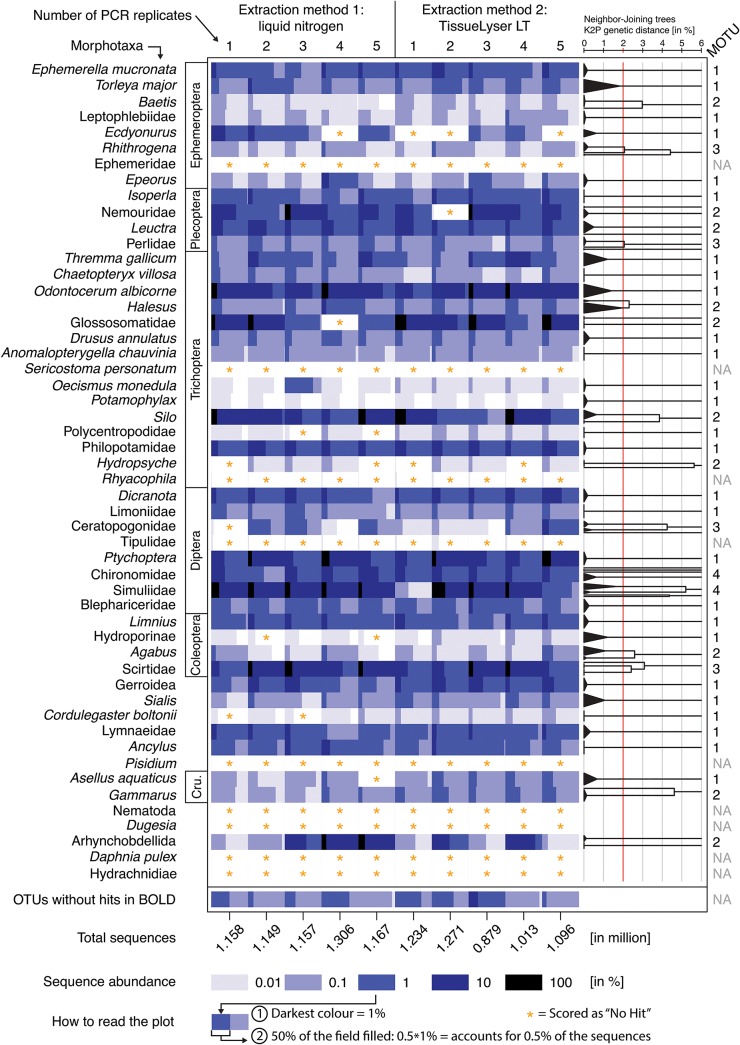
- In experiment II, 83% (43/52) of taxa were reliably recovered; 34 taxa were recovered in all ten replicates. Recovery by group was Ephemeroptera 7/8 (88%), Plecoptera 4/4 (100%), Trichoptera 13/15 (86%), Diptera 7/8 (88%), and Others 12/17 (71%).
- Despite similar biomass, sequence abundance varied by four orders of magnitude among taxa, and there was no correlation between taxon biomass and number of recovered sequences. Primer efficiency was highly species-specific, preventing straightforward abundance or biomass inference.
- LCO and HCO sequencing direction had small effects on final sequence abundance (2.7% and 4.4% differences in experiments I and II), though LCO was 34% more frequent in experiment I (p = 0.006) and no primer bias was detected in experiment II (p = 0.41).
Methods
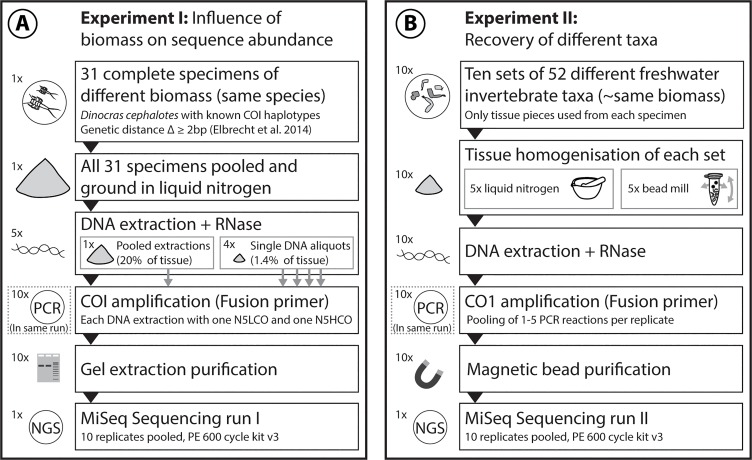
- Two controlled experiments with ten replicates each were sequenced on two independent MiSeq runs using 300-bp paired-end reads; experiment I used 31 *D. cephalotes* stonefly specimens spanning three orders of magnitude in biomass, and experiment II used 52 freshwater invertebrate taxa with similar tissue biomass.
- DNA was extracted in bulk, amplified in a single PCR step with tagged fusion primers based on standard COI LCO1490/HCO2198, purified, and directly sequenced; experiment I used 1.4% and 20% tissue aliquots, while experiment II pooled roughly equal tissue amounts per taxon.
- Bioinformatic analysis used demultiplexing, cutadapt primer removal, read concatenation, blastn against reference haplotypes for experiment I, and UPARSE OTU clustering at 97% identity with BOLD identification for experiment II; sequence counts were normalised to total sequence abundance and tissue weight.
Limitations
- The paper states that PCR-based metabarcoding cannot accurately estimate species biomass or even abundance in diverse environmental samples because primer efficiency is highly species-specific; it recommends presence–absence metrics and notes that PCR-free approaches are needed for biomass estimates.
- The paper states that only 83% of taxa were recovered with one universal COI primer pair, that barcode reference databases remain incomplete, that DNA-based assessments cannot assign biological traits, and that PCR replication effects were not evaluated due to a small number of replicates.
- Evident from the text: the experiments are limited to freshwater macroinvertebrates from western Germany and a specific MiSeq/COI Folmer protocol; some morphotaxa were identified only to family or order and contained multiple MOTUs, so species-level amplification behaviour may be more variable than the morphotaxon-level summaries suggest.
Model-written summary. Check it against the paper before relying on it.
Integrity signals
Registry
Cites
Statistics
Figures
Verification
Claims the paper makes
44 Own result · 24 Own interpretation · 22 Not checked yet · 8 No basis given · 5 Own method
A result the paper reports from its own data — it cites no other source for it, so there is none to check. The quote shows it is in the paper.
In the paper
“However, sequence abundance varied by four orders of magnitudes between taxa despite the use of similar amounts of biomass.”
§ Can DNA-Based Ecosystem Assessments Quantify Species Abundance? Testing Primer Bias and Biomass—Sequence Relationships with an Innovative Metabarcoding Protocol > Abstract
plain- Asserted: passes — The authors put it forward as true.
- Checkable: passes — It can be checked against evidence.
- Load-bearing: passes — The paper’s conclusions depend on it.
- Based: passes — The paper gives a reason why it holds.
A result the paper reports from its own data — it cites no other source for it, so there is none to check. The quote shows it is in the paper.
In the paper
“we found significant differences between the LCO and HCO primers with respect to the number of reads with no hits in experiment I (t-test, p = 0.01, S3A Fig) and final hits in experiment II (t-test, p = 0.01, S3B Fig).”
§ Can DNA-Based Ecosystem Assessments Quantify Species Abundance? Testing Primer Bias and Biomass—Sequence Relationships with an Innovative Metabarcoding Protocol > Results > Sequencing success and statistics
plain- Asserted: passes — The authors put it forward as true.
- Checkable: passes — It can be checked against evidence.
- Load-bearing: unclear — It is unclear whether the paper’s conclusions depend on it.
- Based: passes — The paper gives a reason why it holds.
A result the paper reports from its own data — it cites no other source for it, so there is none to check. The quote shows it is in the paper.
In the paper
“We detected few outliers and low standard deviations for the ratio of LCO- to HCO-based haplotype read abundance for each of the five DNA extractions (Fig 2B and S8 Fig).”
§ Can DNA-Based Ecosystem Assessments Quantify Species Abundance? Testing Primer Bias and Biomass—Sequence Relationships with an Innovative Metabarcoding Protocol > Results > Experiment I
plain- Asserted: passes — The authors put it forward as true.
- Checkable: passes — It can be checked against evidence.
- Load-bearing: unclear — It is unclear whether the paper’s conclusions depend on it.
- Based: passes — The paper gives a reason why it holds.
A result the paper reports from its own data — it cites no other source for it, so there is none to check. The quote shows it is in the paper.
In the paper
“The sequencing results for the ten replicates were highly reproducible.”
§ Can DNA-Based Ecosystem Assessments Quantify Species Abundance? Testing Primer Bias and Biomass—Sequence Relationships with an Innovative Metabarcoding Protocol > Results > Experiment I
boosted- Asserted: passes — The authors put it forward as true.
- Checkable: passes — It can be checked against evidence.
- Load-bearing: passes — The paper’s conclusions depend on it.
- Based: passes — The paper gives a reason why it holds.
A result the paper reports from its own data — it cites no other source for it, so there is none to check. The quote shows it is in the paper.
In the paper
“We did not observe significant differences in sequence abundance among the replicates using different amounts of extracted tissue as a template.”
§ Can DNA-Based Ecosystem Assessments Quantify Species Abundance? Testing Primer Bias and Biomass—Sequence Relationships with an Innovative Metabarcoding Protocol > Results > Experiment I
plain- Asserted: passes — The authors put it forward as true.
- Checkable: passes — It can be checked against evidence.
- Load-bearing: passes — The paper’s conclusions depend on it.
- Based: passes — The paper gives a reason why it holds.
A result the paper reports from its own data — it cites no other source for it, so there is none to check. The quote shows it is in the paper.
In the paper
“From the DNA extractions performed with the TissueLyser LT, six more specimens (2.31%) were recovered than when DNA was extracted with liquid nitrogen.”
§ Can DNA-Based Ecosystem Assessments Quantify Species Abundance? Testing Primer Bias and Biomass—Sequence Relationships with an Innovative Metabarcoding Protocol > Results > Experiment II
plaindirectn = 6- Asserted: passes — The authors put it forward as true.
- Checkable: passes — It can be checked against evidence.
- Load-bearing: unclear — It is unclear whether the paper’s conclusions depend on it.
- Based: passes — The paper gives a reason why it holds.
A result the paper reports from its own data — it cites no other source for it, so there is none to check. The quote shows it is in the paper.
In the paper
“Sequences starting with the LCO primer for the first read were significantly overrepresented in experiment I (34% more frequent than sequences beginning with the HCO primer, t-test, p = 0.006, S4A Fig).”
§ Can DNA-Based Ecosystem Assessments Quantify Species Abundance? Testing Primer Bias and Biomass—Sequence Relationships with an Innovative Metabarcoding Protocol > Results > Sequencing success and statistics
plaincorrelationaln = 31- Asserted: passes — The authors put it forward as true.
- Checkable: passes — It can be checked against evidence.
- Load-bearing: unclear — It is unclear whether the paper’s conclusions depend on it.
- Based: passes — The paper gives a reason why it holds.
A result the paper reports from its own data — it cites no other source for it, so there is none to check. The quote shows it is in the paper.
In the paper
“A much higher per-site nucleotide diversity was observed using the consensus sequences of the 31 unique Dinocras cephalotes COI haplotypes (see experiment I below) (S2 Fig). Fewer peaks of low diversity (only up to 70% identical bases) were detected using both primers than using one primer at a time (100% identical bases).”
§ Can DNA-Based Ecosystem Assessments Quantify Species Abundance? Testing Primer Bias and Biomass—Sequence Relationships with an Innovative Metabarcoding Protocol > Materials and Methods > Primer design and sequencing strategy
plaindirect- Asserted: passes — The authors put it forward as true.
- Checkable: passes — It can be checked against evidence.
- Load-bearing: passes — The paper’s conclusions depend on it.
- Based: passes — The paper gives a reason why it holds.
A result the paper reports from its own data — it cites no other source for it, so there is none to check. The quote shows it is in the paper.
In the paper
“In experiment II, we did not detect primer bias (t-test, p = 0.41, S4B Fig).”
§ Can DNA-Based Ecosystem Assessments Quantify Species Abundance? Testing Primer Bias and Biomass—Sequence Relationships with an Innovative Metabarcoding Protocol > Results > Sequencing success and statistics
plain- Asserted: passes — The authors put it forward as true.
- Checkable: passes — It can be checked against evidence.
- Load-bearing: unclear — It is unclear whether the paper’s conclusions depend on it.
- Based: passes — The paper gives a reason why it holds.
A result the paper reports from its own data — it cites no other source for it, so there is none to check. The quote shows it is in the paper.
In the paper
“Specimens with a low biomass tend to show relatively high variation in sequence abundance among the ten replicates.”
§ Can DNA-Based Ecosystem Assessments Quantify Species Abundance? Testing Primer Bias and Biomass—Sequence Relationships with an Innovative Metabarcoding Protocol > Results > Experiment I
hedgedcorrelationaln = 31- Asserted: passes — The authors put it forward as true.
- Checkable: passes — It can be checked against evidence.
- Load-bearing: passes — The paper’s conclusions depend on it.
- Based: passes — The paper gives a reason why it holds.
- Probably not a substantial claim. 23
- It may state two separate claims as one. 23
A result the paper reports from its own data — it cites no other source for it, so there is none to check. The quote shows it is in the paper.
In the paper
“The two independent weight measurements differed in mean by 0.1 mg (SD = 0.03).”
§ Can DNA-Based Ecosystem Assessments Quantify Species Abundance? Testing Primer Bias and Biomass—Sequence Relationships with an Innovative Metabarcoding Protocol > Results > Experiment I
plainn = 31- Asserted: passes — The authors put it forward as true.
- Checkable: passes — It can be checked against evidence.
- Load-bearing: fails — The paper’s conclusions may not depend on it.
- Based: passes — The paper gives a reason why it holds.
Probably not a substantial claim. The paper’s conclusions may not depend on it.
A result the paper reports from its own data — it cites no other source for it, so there is none to check. The quote shows it is in the paper.
In the paper
“The MiSeq runs of experiments I and II yielded 9.63 and 14.07 Gb of read data, respectively.”
§ Can DNA-Based Ecosystem Assessments Quantify Species Abundance? Testing Primer Bias and Biomass—Sequence Relationships with an Innovative Metabarcoding Protocol > Results > Sequencing success and statistics
plain- Asserted: passes — The authors put it forward as true.
- Checkable: passes — It can be checked against evidence.
- Load-bearing: fails — The paper’s conclusions may not depend on it.
- Based: passes — The paper gives a reason why it holds.
Probably not a substantial claim. The paper’s conclusions may not depend on it. It may state two separate claims as one.
A result the paper reports from its own data — it cites no other source for it, so there is none to check. The quote shows it is in the paper.
In the paper
“In all 10 replicates, we recovered all 31 D. cephalotes specimens based on their unique haplotypes, including the smallest specimens, which only made up 0.023% (0.145 mg) of the total specimen biomass (Fig 2A).”
§ Can DNA-Based Ecosystem Assessments Quantify Species Abundance? Testing Primer Bias and Biomass—Sequence Relationships with an Innovative Metabarcoding Protocol > Results > Experiment I
plainn = 31- Asserted: passes — The authors put it forward as true.
- Checkable: passes — It can be checked against evidence.
- Load-bearing: passes — The paper’s conclusions depend on it.
- Based: passes — The paper gives a reason why it holds.
It may state two separate claims as one.
A result the paper reports from its own data — it cites no other source for it, so there is none to check. The quote shows it is in the paper.
In the paper
“The mean normalised sequence abundances had low standard deviations and the linear model fit well (p<0.001, R 2 = 0.65, S8 Fig).”
§ Can DNA-Based Ecosystem Assessments Quantify Species Abundance? Testing Primer Bias and Biomass—Sequence Relationships with an Innovative Metabarcoding Protocol > Results > Experiment I
plaincorrelational- Asserted: passes — The authors put it forward as true.
- Checkable: passes — It can be checked against evidence.
- Load-bearing: passes — The paper’s conclusions depend on it.
- Based: passes — The paper gives a reason why it holds.
It may state two separate claims as one.
The paper states this without a source or data behind it here, so there is nothing to check it against. The quote shows it is in the paper.
In the paper
“For two specimens, we recovered sequence artefacts (see S6 Fig); these did not affect further analyses.”
§ Can DNA-Based Ecosystem Assessments Quantify Species Abundance? Testing Primer Bias and Biomass—Sequence Relationships with an Innovative Metabarcoding Protocol > Results > Experiment I
plainn = 2- Asserted: passes — The authors put it forward as true.
- Checkable: passes — It can be checked against evidence.
- Load-bearing: fails — The paper’s conclusions may not depend on it.
- Based: passes — The paper gives a reason why it holds.
Probably not a substantial claim. The paper’s conclusions may not depend on it. It may state two separate claims as one.
A result the paper reports from its own data — it cites no other source for it, so there is none to check. The quote shows it is in the paper.
In the paper
“Both MiSeq runs showed good read quality (sequences with Q30 ≥ 85.3% and 83.3%).”
§ Can DNA-Based Ecosystem Assessments Quantify Species Abundance? Testing Primer Bias and Biomass—Sequence Relationships with an Innovative Metabarcoding Protocol > Results > Sequencing success and statistics
plain- Asserted: passes — The authors put it forward as true.
- Checkable: passes — It can be checked against evidence.
- Load-bearing: fails — The paper’s conclusions may not depend on it.
- Based: passes — The paper gives a reason why it holds.
Probably not a substantial claim. The paper’s conclusions may not depend on it. It may state two separate claims as one.
A result the paper reports from its own data — it cites no other source for it, so there is none to check. The quote shows it is in the paper.
In the paper
“Sequences that did not match the target species were similar to sequences derived from a variety of benthic organisms, but also fungi and plants.”
§ Can DNA-Based Ecosystem Assessments Quantify Species Abundance? Testing Primer Bias and Biomass—Sequence Relationships with an Innovative Metabarcoding Protocol > Results > Experiment II
plain- Asserted: passes — The authors put it forward as true.
- Checkable: passes — It can be checked against evidence.
- Load-bearing: unclear — It is unclear whether the paper’s conclusions depend on it.
- Based: passes — The paper gives a reason why it holds.
It may state two separate claims as one.
The paper states this without a source or data behind it here, so there is nothing to check it against. The quote shows it is in the paper.
In the paper
“Using our protocol, it is possible to assess community compositions within a week, from sampling to species identification.”
§ Can DNA-Based Ecosystem Assessments Quantify Species Abundance? Testing Primer Bias and Biomass—Sequence Relationships with an Innovative Metabarcoding Protocol > Discussion > Implications for large-scale monitoring and future challenges
hedgeddirect- Asserted: passes — The authors put it forward as true.
- Checkable: passes — It can be checked against evidence.
- Load-bearing: fails — The paper’s conclusions may not depend on it.
- Based: fails — The paper may give no reason why it holds.
Probably not a substantial claim. The paper’s conclusions may not depend on it. The paper may give no reason why it holds.
In the paper
“Furthermore, we used a universal COI primer with a broad target range [41], and only 17% of taxa went undetected.”
§ Can DNA-Based Ecosystem Assessments Quantify Species Abundance? Testing Primer Bias and Biomass—Sequence Relationships with an Innovative Metabarcoding Protocol > Discussion > Implications for large-scale monitoring and future challenges
What the sources say
- Not checked yetcites [41] O Folmer, 1994, DNA primers for amplification of mitochondrial cytochrome c oxidase subunit I from diverse metazoan invertebrates, Mol Marine Biol Biotechnol
plain- Asserted: passes — The authors put it forward as true.
- Checkable: passes — It can be checked against evidence.
- Load-bearing: unclear — It is unclear whether the paper’s conclusions depend on it.
- Based: passes — The paper gives a reason why it holds.
It may state two separate claims as one.
A result the paper reports from its own data — it cites no other source for it, so there is none to check. The quote shows it is in the paper.
In the paper
“Of all recovered 213 OTUs, 31 could not be identified using the BOLD database (S9B Fig).”
§ Can DNA-Based Ecosystem Assessments Quantify Species Abundance? Testing Primer Bias and Biomass—Sequence Relationships with an Innovative Metabarcoding Protocol > Results > Experiment II
plain- Asserted: passes — The authors put it forward as true.
- Checkable: passes — It can be checked against evidence.
- Load-bearing: fails — The paper’s conclusions may not depend on it.
- Based: passes — The paper gives a reason why it holds.
Probably not a substantial claim. The paper’s conclusions may not depend on it.
A result the paper reports from its own data — it cites no other source for it, so there is none to check. The quote shows it is in the paper.
In the paper
“We detected a slightly different sequencing efficiency between forward and reverse primers, but this only affected total sequence abundance and did not systematically alter the inferences from the data.”
§ Can DNA-Based Ecosystem Assessments Quantify Species Abundance? Testing Primer Bias and Biomass—Sequence Relationships with an Innovative Metabarcoding Protocol > Discussion > Experiment I: Relationship between specimen biomass and sequence abundance
plaindirect- Asserted: passes — The authors put it forward as true.
- Checkable: passes — It can be checked against evidence.
- Load-bearing: unclear — It is unclear whether the paper’s conclusions depend on it.
- Based: passes — The paper gives a reason why it holds.
It may state two separate claims as one.
The paper states this without a source or data behind it here, so there is nothing to check it against. The quote shows it is in the paper.
In the paper
“Our parallel sequencing strategy leads to an increase in per-site sequence diversity and read quality.”
§ Can DNA-Based Ecosystem Assessments Quantify Species Abundance? Testing Primer Bias and Biomass—Sequence Relationships with an Innovative Metabarcoding Protocol > Discussion > Implications for large-scale monitoring and future challenges
plaindirect- Asserted: passes — The authors put it forward as true.
- Checkable: passes — It can be checked against evidence.
- Load-bearing: fails — The paper’s conclusions may not depend on it.
- Based: fails — The paper may give no reason why it holds.
Probably not a substantial claim. The paper’s conclusions may not depend on it. The paper may give no reason why it holds. It may state two separate claims as one.
None of the sources cited for this claim have been checked yet.
In the paper
“different species within a genus or subfamily can have different ecological preferences and stress tolerances and belong to different functional feeding groups [11,12] see [13] for review.”
§ Can DNA-Based Ecosystem Assessments Quantify Species Abundance? Testing Primer Bias and Biomass—Sequence Relationships with an Innovative Metabarcoding Protocol > Introduction
What the sources say
- Not checked yetcites [11] Merritt RW, Berg MB, Cummins KW. An Introduction to the Aquatic Insects of North America. 2009.
- Not checked yetcites [12] SU Pauls, 2008, Grazers, shredders and filtering carnivores—The evolution of feeding ecology in Drusinae (Trichoptera: Limnephilidae): Insights from a molecular phylogeny, Mol Phylogenet Evol source
- Not checked yetcites [13] FC Jones, 2008, Taxonomic sufficiency: The influence of taxonomic resolution on freshwater bioassessments using benthic macroinvertebrates, Environ Rev source
plaincorrelational- Asserted: passes — The authors put it forward as true.
- Checkable: passes — It can be checked against evidence.
- Load-bearing: passes — The paper’s conclusions depend on it.
- Based: passes — The paper gives a reason why it holds.
It may state two separate claims as one.
What the paper did — it cites no source for this, so there is none to check. The quote shows it is in the paper.
In the paper
“The same PCR master mix was used for all reactions to ensure identical PCR conditions for all replicates.”
§ Can DNA-Based Ecosystem Assessments Quantify Species Abundance? Testing Primer Bias and Biomass—Sequence Relationships with an Innovative Metabarcoding Protocol > Materials and Methods > Experiment I: Relationship between specimen biomass and sequence abundance
plain- Asserted: passes — The authors put it forward as true.
- Checkable: passes — It can be checked against evidence.
- Load-bearing: fails — The paper’s conclusions may not depend on it.
- Based: passes — The paper gives a reason why it holds.
Probably not a substantial claim. The paper’s conclusions may not depend on it.
In the paper
“many benthic invertebrate larvae are difficult to identify at the species level, and thus the most practical taxonomic level for the identification of these organisms is often only the genus or family [10].”
§ Can DNA-Based Ecosystem Assessments Quantify Species Abundance? Testing Primer Bias and Biomass—Sequence Relationships with an Innovative Metabarcoding Protocol > Introduction
What the sources say
- Not checked yetcites [10] P Haase, 2010, First audit of macroinvertebrate samples from an EU Water Framework Directive monitoring program: human error greatly lowers precision of assessment results, J North Am Benthol Soc source
plaindirect- Asserted: passes — The authors put it forward as true.
- Checkable: passes — It can be checked against evidence.
- Load-bearing: passes — The paper’s conclusions depend on it.
- Based: passes — The paper gives a reason why it holds.
It may state two separate claims as one.
What the paper did — it cites no source for this, so there is none to check. The quote shows it is in the paper.
In the paper
“To ensure reliable hits, only sequences that had a maximum of five mismatches and gaps were included in the analysis.”
§ Can DNA-Based Ecosystem Assessments Quantify Species Abundance? Testing Primer Bias and Biomass—Sequence Relationships with an Innovative Metabarcoding Protocol > Materials and Methods > Experiment I: Relationship between specimen biomass and sequence abundance
plain- Asserted: passes — The authors put it forward as true.
- Checkable: passes — It can be checked against evidence.
- Load-bearing: passes — The paper’s conclusions depend on it.
- Based: passes — The paper gives a reason why it holds.
Probably not a substantial claim.
A conclusion the paper draws from its own results — it cites no other source for it, so there is none to check. The quote shows it is in the paper.
In the paper
“The parallel sequencing approach thus substantially reduced regions of low per-site diversity, improving read quality.”
§ Can DNA-Based Ecosystem Assessments Quantify Species Abundance? Testing Primer Bias and Biomass—Sequence Relationships with an Innovative Metabarcoding Protocol > Materials and Methods > Primer design and sequencing strategy
plaindirect- Asserted: passes — The authors put it forward as true.
- Checkable: passes — It can be checked against evidence.
- Load-bearing: unclear — It is unclear whether the paper’s conclusions depend on it.
- Based: passes — The paper gives a reason why it holds.
It may state two separate claims as one.
None of the sources cited for this claim have been checked yet.
In the paper
“DNA barcoding allows for standardized and accurate species identification [15–18].”
§ Can DNA-Based Ecosystem Assessments Quantify Species Abundance? Testing Primer Bias and Biomass—Sequence Relationships with an Innovative Metabarcoding Protocol > Introduction
What the sources say
- Not checked yetcites [15] PDN Hebert, 2003, Barcoding animal life: cytochrome c oxidase subunit 1 divergences among closely related species, Proc R Soc Lond B Biol Sci source
- Not checked yetcites [16] X Zhou, 2009, Towards a comprehensive barcode library for arctic life—Ephemeroptera, Plecoptera, and Trichoptera of Churchill, Manitoba, Canada, Front Zool source
- Not checked yetcites [17] X Zhou, 2010, Ephemeroptera, Plecoptera, and Trichoptera fauna of Churchill (Manitoba, Canada): insights into biodiversity patterns from DNA barcoding, J North Am Benthol Soc source
- Not checked yetcites [18] BW Sweeney, 2011, Can DNA barcodes of stream macroinvertebrates improve descriptions of community structure and water quality?, J North Am Benthol Soc source
plaindirect- Asserted: passes — The authors put it forward as true.
- Checkable: passes — It can be checked against evidence.
- Load-bearing: fails — The paper’s conclusions may not depend on it.
- Based: passes — The paper gives a reason why it holds.
Probably not a substantial claim. The paper’s conclusions may not depend on it. It may state two separate claims as one.
In the paper
“frequent identification errors occur and many specimens are not detected in samples [10]”
§ Can DNA-Based Ecosystem Assessments Quantify Species Abundance? Testing Primer Bias and Biomass—Sequence Relationships with an Innovative Metabarcoding Protocol > Introduction
What the sources say
- Not checked yetcites [10] P Haase, 2010, First audit of macroinvertebrate samples from an EU Water Framework Directive monitoring program: human error greatly lowers precision of assessment results, J North Am Benthol Soc source
plain- Asserted: passes — The authors put it forward as true.
- Checkable: passes — It can be checked against evidence.
- Load-bearing: passes — The paper’s conclusions depend on it.
- Based: passes — The paper gives a reason why it holds.
It may state two separate claims as one.
What the paper did — it cites no source for this, so there is none to check. The quote shows it is in the paper.
In the paper
“All analyses were performed with ten replicates to improve statistical robustness.”
- Also stated in: § Abstract · plain
“Each experiment was replicated ten times to maximise statistical power.”
§ Can DNA-Based Ecosystem Assessments Quantify Species Abundance? Testing Primer Bias and Biomass—Sequence Relationships with an Innovative Metabarcoding Protocol > Introduction
plaindirect- Asserted: passes — The authors put it forward as true.
- Checkable: passes — It can be checked against evidence.
- Load-bearing: fails — The paper’s conclusions may not depend on it.
- Based: passes — The paper gives a reason why it holds.
Probably not a substantial claim. The paper’s conclusions may not depend on it.
- Also stated in: § Abstract · plain
In the paper
“Stein and co-authors showed that ten of 16 assessment metrics had higher statistical power using DNA barcoding than morphological assessment [14].”
§ Can DNA-Based Ecosystem Assessments Quantify Species Abundance? Testing Primer Bias and Biomass—Sequence Relationships with an Innovative Metabarcoding Protocol > Introduction
What the sources say
- Not checked yetcites [14] ED Stein, 2014, Is DNA Barcoding Actually Cheaper and Faster than Traditional Morphological Methods: Results from a Survey of Freshwater Bioassessment Efforts in the United States?, PLoS ONE source
plaincorrelational- Asserted: passes — The authors put it forward as true.
- Checkable: passes — It can be checked against evidence.
- Load-bearing: fails — The paper’s conclusions may not depend on it.
- Based: passes — The paper gives a reason why it holds.
Probably not a substantial claim. The paper’s conclusions may not depend on it.
In the paper
“For animals, a 658-bp standardized fragment of the mitochondrial gene COI (cytochrome c oxidase subunit 1) is typically used [19].”
§ Can DNA-Based Ecosystem Assessments Quantify Species Abundance? Testing Primer Bias and Biomass—Sequence Relationships with an Innovative Metabarcoding Protocol > Introduction
What the sources say
- Not checked yetcites [19] PDN Hebert, 2003, Biological identifications through DNA barcodes, Proc R Soc Lond B Biol Sci source
plain- Asserted: passes — The authors put it forward as true.
- Checkable: passes — It can be checked against evidence.
- Load-bearing: fails — The paper’s conclusions may not depend on it.
- Based: passes — The paper gives a reason why it holds.
Probably not a substantial claim. The paper’s conclusions may not depend on it.
A conclusion the paper draws from its own results — it cites no other source for it, so there is none to check. The quote shows it is in the paper.
In the paper
“Presumably, these morphotaxa contained several taxonomically distant species, which are unequally well amplified with the Folmer primers.”
§ Can DNA-Based Ecosystem Assessments Quantify Species Abundance? Testing Primer Bias and Biomass—Sequence Relationships with an Innovative Metabarcoding Protocol > Discussion > Experiment II: Primer amplification bias between species
hedgedcorrelational- Asserted: passes — The authors put it forward as true.
- Checkable: passes — It can be checked against evidence.
- Load-bearing: fails — The paper’s conclusions may not depend on it.
- Based: passes — The paper gives a reason why it holds.
Probably not a substantial claim. The paper’s conclusions may not depend on it. It may state two separate claims as one.
What the paper did — it cites no source for this, so there is none to check. The quote shows it is in the paper.
In the paper
“We used a highly replicated and standardised approach for species detection using DNA metabarcoding”
§ Can DNA-Based Ecosystem Assessments Quantify Species Abundance? Testing Primer Bias and Biomass—Sequence Relationships with an Innovative Metabarcoding Protocol > Discussion > Implications for large-scale monitoring and future challenges
plain- Asserted: passes — The authors put it forward as true.
- Checkable: passes — It can be checked against evidence.
- Load-bearing: fails — The paper’s conclusions may not depend on it.
- Based: passes — The paper gives a reason why it holds.
Probably not a substantial claim. The paper’s conclusions may not depend on it.
A conclusion the paper draws from its own results — it cites no other source for it, so there is none to check. The quote shows it is in the paper.
In the paper
“show that several technical and logistic problems have to be overcome before this protocol can be used for large-scale monitoring.”
§ Can DNA-Based Ecosystem Assessments Quantify Species Abundance? Testing Primer Bias and Biomass—Sequence Relationships with an Innovative Metabarcoding Protocol > Discussion > Implications for large-scale monitoring and future challenges
plain- Asserted: passes — The authors put it forward as true.
- Checkable: passes — It can be checked against evidence.
- Load-bearing: passes — The paper’s conclusions depend on it.
- Based: passes — The paper gives a reason why it holds.
Probably not a substantial claim.
A conclusion the paper draws from its own results — it cites no other source for it, so there is none to check. The quote shows it is in the paper.
In the paper
“However, our results indicate that the amount of tissue used in the DNA extraction was sufficient and did not lead to the systematic exclusion of small specimens as long as tissues are well ground and specimens have similar amplification efficiencies.”
§ Can DNA-Based Ecosystem Assessments Quantify Species Abundance? Testing Primer Bias and Biomass—Sequence Relationships with an Innovative Metabarcoding Protocol > Discussion > Experiment I: Relationship between specimen biomass and sequence abundance
hedgedn = 31- Asserted: passes — The authors put it forward as true.
- Checkable: passes — It can be checked against evidence.
- Load-bearing: passes — The paper’s conclusions depend on it.
- Based: passes — The paper gives a reason why it holds.
It may state two separate claims as one.
A conclusion the paper draws from its own results — it cites no other source for it, so there is none to check. The quote shows it is in the paper.
In the paper
“However degraded DNA and contamination as in eDNA studies with amplicons is not a concern for organisms collected directly from streams.”
§ Can DNA-Based Ecosystem Assessments Quantify Species Abundance? Testing Primer Bias and Biomass—Sequence Relationships with an Innovative Metabarcoding Protocol > Discussion > Implications for large-scale monitoring and future challenges
plain- Asserted: passes — The authors put it forward as true.
- Checkable: passes — It can be checked against evidence.
- Load-bearing: fails — The paper’s conclusions may not depend on it.
- Based: fails — The paper may give no reason why it holds.
Probably not a substantial claim. The paper’s conclusions may not depend on it. The paper may give no reason why it holds.
None of the sources cited for this claim have been checked yet.
In the paper
“Several studies show that DNA-based assessments are superior to morphological assessments in freshwater ecosystems (e.g., [14,25,33])”
§ Can DNA-Based Ecosystem Assessments Quantify Species Abundance? Testing Primer Bias and Biomass—Sequence Relationships with an Innovative Metabarcoding Protocol > Discussion
What the sources say
- Not checked yetcites [14] ED Stein, 2014, Is DNA Barcoding Actually Cheaper and Faster than Traditional Morphological Methods: Results from a Survey of Freshwater Bioassessment Efforts in the United States?, PLoS ONE source
- Not checked yetcites [25] JK Jackson, 2014, Cryptic biodiversity in streams: a comparison of macroinvertebrate communities based on morphological and DNA barcode identifications, Freshw Sci source
- Not checked yetcites [33] Zimmermann J, Glöckner G, Jahn R, Enke N, Gemeinholzer B. Metabarcoding vs. morphological identification to assess diatom diversity in environmental studies. Mol Ecol Resour. 2014; 1–17. <comment>doi: 10.1111/1755-0998.12336</comment> source
plaincorrelational- Asserted: passes — The authors put it forward as true.
- Checkable: passes — It can be checked against evidence.
- Load-bearing: fails — The paper’s conclusions may not depend on it.
- Based: passes — The paper gives a reason why it holds.
Probably not a substantial claim. The paper’s conclusions may not depend on it.
A conclusion the paper draws from its own results — it cites no other source for it, so there is none to check. The quote shows it is in the paper.
In the paper
“but not its abundance because many small organisms generate the same number of sequence reads as a few large organisms.”
§ Can DNA-Based Ecosystem Assessments Quantify Species Abundance? Testing Primer Bias and Biomass—Sequence Relationships with an Innovative Metabarcoding Protocol > Discussion > Implications for large-scale monitoring and future challenges
plain- Asserted: passes — The authors put it forward as true.
- Checkable: passes — It can be checked against evidence.
- Load-bearing: passes — The paper’s conclusions depend on it.
- Based: passes — The paper gives a reason why it holds.
It may state two separate claims as one.
A conclusion the paper draws from its own results — it cites no other source for it, so there is none to check. The quote shows it is in the paper.
In the paper
“Thus, it is not possible to accurately estimate species biomass or even abundance in diverse environmental samples using amplification-based sequencing protocols.”
§ Can DNA-Based Ecosystem Assessments Quantify Species Abundance? Testing Primer Bias and Biomass—Sequence Relationships with an Innovative Metabarcoding Protocol > Discussion > Implications for large-scale monitoring and future challenges
plain- Asserted: passes — The authors put it forward as true.
- Checkable: passes — It can be checked against evidence.
- Load-bearing: passes — The paper’s conclusions depend on it.
- Based: passes — The paper gives a reason why it holds.
It may state two separate claims as one.
In the paper
“The efforts of large national and international barcoding consortia (BOLD, iBOL, and GBOL) have contributed to a substantial increase in both the size and quality of reference databases [56]”
§ Can DNA-Based Ecosystem Assessments Quantify Species Abundance? Testing Primer Bias and Biomass—Sequence Relationships with an Innovative Metabarcoding Protocol > Discussion > Implications for large-scale monitoring and future challenges
What the sources say
- Not checked yetcites [56] P Taberlet, 2012, Towards next-generation biodiversity assessment using DNA metabarcoding, Mol Ecol source
plaindirect- Asserted: passes — The authors put it forward as true.
- Checkable: passes — It can be checked against evidence.
- Load-bearing: fails — The paper’s conclusions may not depend on it.
- Based: passes — The paper gives a reason why it holds.
Probably not a substantial claim. The paper’s conclusions may not depend on it.
None of the sources cited for this claim have been checked yet.
In the paper
“we are confident that metabarcoding will widely replace present biomonitoring methods over time because 1) it has a higher taxonomic resolution [14], 2) it is cost efficient and fast and, most importantly, 3) it reduces human bias enabling comparisons among studies [57].”
§ Can DNA-Based Ecosystem Assessments Quantify Species Abundance? Testing Primer Bias and Biomass—Sequence Relationships with an Innovative Metabarcoding Protocol > Discussion > Implications for large-scale monitoring and future challenges
What the sources say
- Not checked yetcites [14] ED Stein, 2014, Is DNA Barcoding Actually Cheaper and Faster than Traditional Morphological Methods: Results from a Survey of Freshwater Bioassessment Efforts in the United States?, PLoS ONE source
- Not checked yetcites [57] Y Ji, 2013, Reliable, verifiable and efficient monitoring of biodiversity via metabarcoding, Ecol Lett source
boosteddirect- Asserted: passes — The authors put it forward as true.
- Checkable: fails — It may be too vague to check against evidence.
- Load-bearing: fails — The paper’s conclusions may not depend on it.
- Based: passes — The paper gives a reason why it holds.
Probably not a substantial claim. It may be too vague to check against evidence. The paper’s conclusions may not depend on it. It may state two separate claims as one.
A conclusion the paper draws from its own results — it cites no other source for it, so there is none to check. The quote shows it is in the paper.
In the paper
“We provide a highly reproducible laboratory protocol for processing macroinvertebrate samples in bulk and identified species using metabarcoding with the standard COI region.”
§ Can DNA-Based Ecosystem Assessments Quantify Species Abundance? Testing Primer Bias and Biomass—Sequence Relationships with an Innovative Metabarcoding Protocol > Conclusions
boosted- Asserted: passes — The authors put it forward as true.
- Checkable: passes — It can be checked against evidence.
- Load-bearing: passes — The paper’s conclusions depend on it.
- Based: passes — The paper gives a reason why it holds.
It may state two separate claims as one.
In the paper
“Piñol et al. [39] proposed a relationship between biomass and sequence reads, but did not systematically examine this hypothesis.”
§ Can DNA-Based Ecosystem Assessments Quantify Species Abundance? Testing Primer Bias and Biomass—Sequence Relationships with an Innovative Metabarcoding Protocol > Discussion > Experiment I: Relationship between specimen biomass and sequence abundance
What the sources say
- Not checked yetcites [39] Piñol J, Mir G, Gomez-Polo P, Agustí N. Universal and blocking primer mismatches limit the use of high-throughput DNA sequencing for the quantitative metabarcoding of arthropods. Mol Ecol Resour. 2014; 1–12. <comment>doi: 10.1111/1755-0998.12355</comment> source
plaincorrelational- Asserted: passes — The authors put it forward as true.
- Checkable: passes — It can be checked against evidence.
- Load-bearing: fails — The paper’s conclusions may not depend on it.
- Based: passes — The paper gives a reason why it holds.
Probably not a substantial claim. The paper’s conclusions may not depend on it. It may state two separate claims as one.
A conclusion the paper draws from its own results — it cites no other source for it, so there is none to check. The quote shows it is in the paper.
In the paper
“This is consistent with the primer bias which we already observed between morphotaxa and support the overall findings of strong taxon-specific amplification bias.”
§ Can DNA-Based Ecosystem Assessments Quantify Species Abundance? Testing Primer Bias and Biomass—Sequence Relationships with an Innovative Metabarcoding Protocol > Discussion > Experiment II: Primer amplification bias between species
boostedcorrelational- Asserted: passes — The authors put it forward as true.
- Checkable: passes — It can be checked against evidence.
- Load-bearing: passes — The paper’s conclusions depend on it.
- Based: passes — The paper gives a reason why it holds.
It may state two separate claims as one.
A conclusion the paper draws from its own results — it cites no other source for it, so there is none to check. The quote shows it is in the paper.
In the paper
“The methods developed in this study can easily be adapted to assess the communities of other ecosystems.”
§ Can DNA-Based Ecosystem Assessments Quantify Species Abundance? Testing Primer Bias and Biomass—Sequence Relationships with an Innovative Metabarcoding Protocol > Discussion > Implications for large-scale monitoring and future challenges
plain- Asserted: passes — The authors put it forward as true.
- Checkable: fails — It may be too vague to check against evidence.
- Load-bearing: fails — The paper’s conclusions may not depend on it.
- Based: fails — The paper may give no reason why it holds.
Probably not a substantial claim. It may be too vague to check against evidence. The paper’s conclusions may not depend on it. The paper may give no reason why it holds.
In the paper
“However, while this approach could have comparable taxonomic resolution as the COI barcode, it is currently limited by the lack of reference databases [55].”
§ Can DNA-Based Ecosystem Assessments Quantify Species Abundance? Testing Primer Bias and Biomass—Sequence Relationships with an Innovative Metabarcoding Protocol > Discussion > Implications for large-scale monitoring and future challenges
What the sources say
- Not checked yetcites [55] LJ Clarke, 2014, Environmental metabarcodes for insects: in silicoPCR reveals potential for taxonomic bias, Mol Ecol Resour source
hedgeddirect- Asserted: passes — The authors put it forward as true.
- Checkable: passes — It can be checked against evidence.
- Load-bearing: unclear — It is unclear whether the paper’s conclusions depend on it.
- Based: passes — The paper gives a reason why it holds.
It may state two separate claims as one.
A conclusion the paper draws from its own results — it cites no other source for it, so there is none to check. The quote shows it is in the paper.
In the paper
“A combination of both data types, i.e., DNA species barcodes and ecological traits, will maximise the power of metabarcoding for the reliable assessment of ecosystem responses under stress and for biomonitoring.”
§ Can DNA-Based Ecosystem Assessments Quantify Species Abundance? Testing Primer Bias and Biomass—Sequence Relationships with an Innovative Metabarcoding Protocol > Discussion > Implications for large-scale monitoring and future challenges
plaindirect- Asserted: passes — The authors put it forward as true.
- Checkable: fails — It may be too vague to check against evidence.
- Load-bearing: passes — The paper’s conclusions depend on it.
- Based: passes — The paper gives a reason why it holds.
Probably not a substantial claim. It may be too vague to check against evidence.
- Rests on an assumption: DNA-based assessments cannot assign biological traits to species.
The paper relies on this without support.
Precise estimates of biomass with respect to specimen recovery and primer bias have not been performed.
“Precise estimates of biomass with respect to specimen recovery and primer bias have not been performed.”
The paper relies on this without support.
COI amplicons are typically similar in base composition.
“COI amplicons are typically similar in base composition; therefore, three strategies were used to increase sequence diversity.”
The paper relies on this without support.
Sanger sequencing requires that each specimen is processed individually in the laboratory, which is costly and extremely time-consuming for routine community assessments involving hundreds or thousands of specimens per sample.
“However, Sanger sequencing requires that each specimen is processed individually in the laboratory, which is costly and extremely time-consuming for routine community assessments involving hundreds or thousands of specimens per sample.”
The paper relies on this without support.
Benthic indicator organisms vary in biomass, and this variation depends on taxonomic group and life stage.
“Benthic indicator organisms vary in biomass, and this variation depends on taxonomic group and life stage.”
The paper relies on this without support.
Morphotaxa could often only be identified at family or order level, and several species per morphotaxon may occur in the sampled aquatic habitats even at the same habitat patch.
“This was expected, as morphotaxa could often only be identified at family or order level, and several species per morphotaxon may occur in the sampled aquatic habitats even at the same habitat patch.”
The paper relies on this without support.
Stochastic effects increase with reduced specimen biomass.
“This result is expected because stochastic effects increase with reduced specimen biomass.”
The paper relies on this without support.
Currently, the monitoring of freshwater ecosystems is based on abundance metrics, which cannot be generated using the metabarcoding solutions currently available.
“Currently, the monitoring of freshwater ecosystems is based on abundance metrics, which cannot be generated using the metabarcoding solutions currently available.”
The paper relies on this without support.
All assessment protocols rely on reference catalogues against which inventory data of a species from an ecosystem are compared.
“All assessment protocols rely on reference catalogues against which inventory data of a species from an ecosystem are compared.”
The paper relies on this without support.
Changes in species traits in a community (e.g. functional feeding groups, tolerance against pollution) are used as indicator values to evaluate the biological significance of inferred community changes.
“In particular, changes in species traits in a community (e.g. functional feeding groups, tolerance against pollution) are used as indicator values to evaluate the biological significance of inferred community changes.”
The paper relies on this without support.
DNA-based assessments cannot assign biological traits to species.
“However, DNA-based assessments cannot assign biological traits to species.”
Claims other papers make about this one
Each is checked against this paper’s own text: does it say what the citing paper says it does?
In the citing paper
“This was done to increase the likelihood of detecting small-bodied and rare species in samples, as individuals with a larger biomass provide disproportionate amounts of DNA and can therefore be over-represented when metabarcoding bulk samples65.”
From Soundscapes and deep learning enable tracking biodiversity recovery in tropical forests (2023) · cites this paper as [65]
Self-check
Percentages, sums and reported differences re-computed from the paper’s own numbers.
Each contradiction between two passages listed here was confirmed by an independent check.
Rated minor: it would not touch a result — a value no result rests on, a p-value that stays on the same side of the significance level, or a conflict that is clerical, resolved elsewhere in the paper, or outside its own findings.
In the paper
§ Can DNA-Based Ecosystem Assessments Quantify Species Abundance? Testing Primer Bias and Biomass—Sequence Relationships with an Innovative Metabarcoding Protocol > Results > Experiment II
“We were able to reliably assign OTUs to all 52 taxa included in the extraction.”
§ Can DNA-Based Ecosystem Assessments Quantify Species Abundance? Testing Primer Bias and Biomass—Sequence Relationships with an Innovative Metabarcoding Protocol > Discussion > Implications for large-scale monitoring and future challenges
“Furthermore, we used a universal COI primer with a broad target range [41], and only 17% of taxa went undetected.”
Citations
Cites
R: A Language and Environment for Statistical Computing
R Core Team (2000) · doi:10.32614/r.manuals · Cited by 355,893
QIIME allows analysis of high-throughput community sequencing data
Caporaso, J. G., Kuczynski, J., Stombaugh, J., Bittinger, K., Bushman, F. D., Costello, E. K., Fierer, N., Peña, A. G., Goodrich, J. K., Gordon, J. I., et al. (2010) · Nature Methods · doi:10.1038/nmeth.f.303 · Cited by 34,887
Cutadapt removes adapter sequences from high-throughput sequencing reads
Martin, M. (2011) · EMBnet.journal · doi:10.14806/ej.17.1.200 · Cited by 33,889
BLAST+: architecture and applications
Camacho, C., Coulouris, G., Avagyan, V., Ma, N., Papadopoulos, J., Bealer, K., & Madden, T. L. (2009) · BMC Bioinformatics · doi:10.1186/1471-2105-10-421 · Cited by 22,074
Schloss, P. D., Westcott, S. L., Ryabin, T., Hall, J. R., Hartmann, M., Hollister, E. B., Lesniewski, R. A., Oakley, B. B., Parks, D. H., Robinson, C. J., et al. (2009) · Applied and Environmental Microbiology · doi:10.1128/aem.01541-09 · Cited by 19,549
UPARSE: highly accurate OTU sequences from microbial amplicon reads
Edgar, R. C. (2013) · Nature Methods · doi:10.1038/nmeth.2604 · Cited by 16,770
Folmer, O., Black, M., Hoeh, W., Lutz, R., & Vrijenhoek, R. (1994) · PubMed · doi:10.5281/zenodo.15145663 · Cited by 15,546
Biological identifications through DNA barcodes
Hebert, P. D. N., Cywinska, A., Ball, S. L., & deWaard, J. R. (2003) · Proceedings of the Royal Society of London. Series B: Biological Sciences · doi:10.1098/rspb.2002.2218 · Cited by 13,376
A safe operating space for humanity
Rockström, J., Steffen, W., Noone, K., Persson, Å., Chapin, F. S., Lambin, E. F., Lenton, T. M., Scheffer, M., Folke, C., Schellnhuber, H. J., et al. (2009) · Nature · doi:10.1038/461472a · Cited by 13,333
Ecosystems and Human Well-being: Synthesis
Assessment, M. E. (2005) · Island Press · doi:10.5281/zenodo.18167309 · Cited by 10,665
Cited by
Sorted by citations
Environmental DNA metabarcoding: Transforming how we survey animal and plant communities
Deiner, K., Bik, H. M., Mächler, E., Seymour, M., Lacoursière‐Roussel, A., Altermatt, F., Creer, S., Bista, I., Lodge, D. M., de Vere, N., et al. (2017) · Molecular Ecology · doi:10.1111/mec.14350 · Cited by 2,075
“Selected strategies include filtering based on a lower Phred score cut-off, usually set at least above 20 or 30 (Bista (Continues) et al., 2017; Elbrecht & Leese, 2015; H€anfling et al., 2016).”
BackgroundMethodTaberlet, P., Bonin, A., Zinger, L., & Coissac, É. (2018) · doi:10.1093/oso/9780198767220.001.0001 · Cited by 1,146
Counting with DNA in metabarcoding studies: How should we convert sequence reads to dietary data?
Deagle, B. E., Thomas, A. C., McInnes, J. C., Clarke, L. J., Vesterinen, E. J., Clare, E. L., Kartzinel, T. R., & Eveson, J. P. (2018) · Molecular Ecology · doi:10.1111/mec.14734 · Cited by 884
“Many studies have sequenced DNA from insect mock communities; however, rather than considering if read counts are proxies for input biomass, the focus of these studies has generally been to test if taxa can be detected (Alberdi et al. 2017; Clarke et al. 2014; Elbrecht & Leese 2015; Yu et al. 2012).”
BackgroundBeng, K. C., & Corlett, R. T. (2020) · Biodiversity and Conservation · doi:10.1007/s10531-020-01980-0 · Cited by 769
Environmental DNA reveals that rivers are conveyer belts of biodiversity information
Deiner, K., Fronhofer, E. A., Mächler, E., Walser, J., & Altermatt, F. (2016) · Nature Communications · doi:10.1038/ncomms12544 · Cited by 700
Cryptic species as a window into the paradigm shift of the species concept
Fišer, C., Robinson, C. T., & Malard, F. (2018) · Molecular Ecology · doi:10.1111/mec.14486 · Cited by 591
“However, applying this approach to conservation biology (Asmyhr, Linke, Hose, & Nipperess, 2014) and local community ecology (Elbrecht & Leese, 2015; Jones, Ghoorah, & Blaxter, 2011) can be risky.”
MethodPawlowski, J. W., Kelly‐Quinn, M., Altermatt, F., Apothéloz‐Perret‐Gentil, L., Beja, P. R., Boggero, A., Borja, Á., Bouchez, A., Cordier, T., Domaizon, I., et al. (2018) · The Science of The Total Environment · doi:10.1016/j.scitotenv.2018.05.002 · Cited by 597
Self-citationStat, M., Huggett, M. J., Bernasconi, R., DiBattista, J. D., Berry, T. E., Newman, S. J., Harvey, E. S., & Bunce, M. (2017) · Scientific Reports · doi:10.1038/s41598-017-12501-5 · Cited by 571
Deep learning and computer vision will transform entomology
Høye, T. T., Ärje, J., Bjerge, K., Hansen, O. L. P., Iosifidis, A., Leese, F., Mann, H. M. R., Meissner, K. K., Melvad, C., & Raitoharju, J. (2021) · Proceedings of the National Academy of Sciences · doi:10.1073/pnas.2002545117 · Cited by 491
Self-citationElbrecht, V., & Leese, F. (2017) · Frontiers in Environmental Science · doi:10.3389/fenvs.2017.00011 · Cited by 495
“Amplification success of the BF/BR primers was evaluated using 10 mock communities, each containing a set of 52 different freshwater invertebrates also used in previous studies (Elbrecht and Leese, 2015; Elbrecht et al., 2016).”
InfluentialSelf-citationHering, D., Borja, Á., Jones, J. I., Pont, D., Boets, P., Bouchez, A., Bruce, K., Drakare, S., Hänfling, B., Kahlert, M., et al. (2018) · Water Research · doi:10.1016/j.watres.2018.03.003 · Cited by 475
Self-citationHow quantitative is metabarcoding: A meta‐analytical approach
Lamb, P. D., Hunter, E., Pinnegar, J. K., Creer, S., Davies, R. G., & Taylor, M. I. (2018) · Molecular Ecology · doi:10.1111/mec.14920 · Cited by 488
“…& Faecal Fish 16s Diaz‐Real, Serrano, Piriz, and Jovani (2015) 3 454 Individuals Feather mites COI Egge et al. (2013) 11 454 DNA/RNA Haptophytes 18s Elbrecht and Leese (2015) 52 Illumina Biomass Macroinvertebrates (freshwater) COI Elbrecht et al. (2016) 52 Illumina Individuals…”
Elbrecht, V., Vamos, E. E., Meissner, K., Aroviita, J., & Leese, F. (2017) · Methods in Ecology and Evolution · doi:10.1111/2041-210x.12789 · Cited by 385
“DNA metabarcoding can provide much more accurate taxonomic identification than morphology-based methods, and can even be used to detect cryptic species (Elbrecht & Leese 2015).”
BackgroundMethodInfluentialSelf-citationValidation of COI metabarcoding primers for terrestrial arthropods
Elbrecht, V., Braukmann, T., Ivanova, N. V., Prosser, S. W. J., Hajibabaei, M., Wright, M., Zakharov, E., Hebert, P. D. N., & Steinke, D. (2019) · PeerJ · doi:10.7717/peerj.7745 · Cited by 346
“…in-line tags of different length to shift PeerJ reviewing PDF | (2019:07:39441:1:0:NEW 19 Aug 2019) 157 amplicons against each other and sequenced half of the samples in reverse orientation by swapping 158 the Illumina P5 and P7 sequencing adapters on the fusion primers (Elbrecht & Leese 2015).”
BackgroundMethodSelf-citationEstimating and mitigating amplification bias in qualitative and quantitative arthropod metabarcoding
Krehenwinkel, H., Wolf, M., Lim, J. Y., Rominger, A. J., Simison, W. B., & Gillespie, R. G. (2017) · Scientific Reports · doi:10.1038/s41598-017-17333-x · Cited by 310
Scaling up: A guide to high‐throughput genomic approaches for biodiversity analysis
Porter, T. M., & Hajibabaei, M. (2018) · Molecular Ecology · doi:10.1111/mec.14478 · Cited by 332
“…in copy number, as well as variation in biomass and density among organisms, it has been suggested that a conservative approach is to treat DNA metabarcoding data as presence–absence data only (Elbrecht & Leese, 2015; Hajibabaei, Spall, Shokralla, & van Konynenburg, 2012; Hajibabaei et al., 2011).”
BackgroundUnderstanding PCR Processes to Draw Meaningful Conclusions from Environmental DNA Studies
Kelly, R. P., Shelton, A. O., & Gallego, R. (2019) · Scientific Reports · doi:10.1038/s41598-019-48546-x · Cited by 316
“Taken together, along with other recent work such as [23] and [21], a common 411 understanding of the processes underlying PCR-based studies appears to be coalescing.”
BackgroundResultAncient plant DNA in lake sediments
Parducci, L., Bennett, K. D., Ficetola, G. F., Alsos, I. G., Suyama, Y., Wood, J. R., & Pedersen, M. W. (2017) · New Phytologist · doi:10.1111/nph.14470 · Cited by 291
Cordier, T., Alonso‐Sáez, L., Apothéloz‐Perret‐Gentil, L., Aylagas, E., Bohan, D. A., Bouchez, A., Chariton, A. A., Creer, S., Frühe, L., Keck, F., et al. (2020) · Molecular Ecology · doi:10.1111/mec.15472 · Cited by 297
“…and the variable number of copies of the targeted marker in the genome (Bik et al., 2013; Větrovský & Baldrian 2013), in addition to variations in DNA extractability and primer-specific amplification bias (Elbrecht & Leese, 2015; Krehenwinkel et al., 2017; Piñol, Mir, Gomez-Polo, & Agustí, 2015).”
BackgroundSelf-citationPiñol, J., Senar, M. À., & Symondson, W. O. C. (2018) · Molecular Ecology · doi:10.1111/mec.14776 · Cited by 262
“Consequently, some species are better amplified than others and the proportions in the final mixture do not reflect the original proportion of each species (Elbrecht and Leese, 2015; Leray et al., 2013; Bista et al., 2018).”
BackgroundSrivathsan, A., Lee, L., Katoh, K., Hartop, E., Kutty, S. N., Wong, J., Yeo, D. C. J., & Meier, R. (2021) · BMC Biology · doi:10.1186/s12915-021-01141-x · Cited by 269
“ing samples consisting of hundreds or thousands of specimens [74, 75], large-scale barcoding of individual specimens remains essential for discovering and describing species.”
BackgroundProspects and challenges of environmental DNA (eDNA) monitoring in freshwater ponds
Harper, L. R., Buxton, A. S., Rees, H. C., Bruce, K., Brys, R., Halfmaerten, D., Read, D. S., Watson, H. V., Sayer, C. D., Jones, E. P., et al. (2018) · Hydrobiologia · doi:10.1007/s10750-018-3750-5 · Cited by 268
Benchmarking DNA Metabarcoding for Biodiversity-Based Monitoring and Assessment
Aylagas, E., Borja, Á., Irigoien, X., & Rodríguez‐Ezpeleta, N. (2016) · Frontiers in Marine Science · doi:10.3389/fmars.2016.00096 · Cited by 284
“The abovementioned biases inherent to PCR-based analyses can lead to greater recovery of sequences of some species and the exclusion of others (Elbrecht and Leese, 2015; Piñol et al., 2015).”
BackgroundInfluentialDeep-Sea, Deep-Sequencing: Metabarcoding Extracellular DNA from Sediments of Marine Canyons
Guardiola, M., Uriz, M. J., Taberlet, P., Coissac, É., Wangensteen, O. S., & Turón, X. (2015) · PLoS ONE · doi:10.1371/journal.pone.0139633 · Cited by 255
“Quantitative inference using number of reads of a given MOTU is controversial [5, 65, 66] and it has been suggested that relative abundances, rather than absolute values, are more reliably obtained from metabarcoding data [6, 13].”
BackgroundThomas, A. C., Deagle, B. E., Eveson, J. P., Harsch, C. H., & Trites, A. W. (2015) · Molecular Ecology Resources · doi:10.1111/1755-0998.12490 · Cited by 248
“In those circumstances, it is likely unrealistic to expect accurate estimates of species proportion based on DNA sequence read abundances (e.g. Clarke et al. 2014; Elbrecht & Leese 2015), and correction factors are likely not worth pursuing in that stage of methodological development.”
BackgroundMinimizing polymerase biases in metabarcoding
Nichols, R. V., Vollmers, C., Newsom, L. A., Wang, Y., Heintzman, P. D., Leighton, M., Green, R. E., & Shapiro, B. (2018) · Molecular Ecology Resources · doi:10.1111/1755-0998.12895 · Cited by 245
Quantitative monitoring of multispecies fish environmental DNA using high-throughput sequencing
Ushio, M., Murakami, H., Masuda, R., Sado, T., Miya, M. U., Sakurai, S., Yamanaka, H., Minamoto, T., & Kondoh, M. (2018) · Metabarcoding and Metagenomics · doi:10.3897/mbmg.2.23297 · Cited by 257
Advances in DNA metabarcoding for food and wildlife forensic species identification
Staats, M., Arulandhu, A. J., Gravendeel, B., Holst‐Jensen, A., Scholtens, I. M. J., Peelen, T., Prins, T. W., & Kok, E. J. (2016) · Analytical and Bioanalytical Chemistry · doi:10.1007/s00216-016-9595-8 · Cited by 255
“PCR bias caused by variable primer– template mismatches across species may limit the quantitative potential of DNA metabarcoding and may cause species to be missed [28, 29].”
BackgroundInfluentialProspects and challenges of implementing DNA metabarcoding for high-throughput insect surveillance
Piper, A. M., Batovska, J., Cogan, N. O. I., Weiss, J., Cunningham, J. P., Rodoni, B., & Blacket, M. J. (2019) · GigaScience · doi:10.1093/gigascience/giz092 · Cited by 259
“Regardless of whether an enrichment or metagenomics approach was used, platform-specific sequencing adapters need to be attached to the molecules (via ligation [151] or 1-step [152] or 2-step PCR [40, 106]) to form “libraries” that can then bind to the flow cell for sequencing (Fig.”
Beyond Biodiversity: Can Environmental DNA (eDNA) Cut It as a Population Genetics Tool?
Adams, C. I. M., Knapp, M., Gemmell, N. J., Jeunen, G., Bunce, M., Lamare, M. D., & Taylor, H. R. (2019) · Genes · doi:10.3390/genes10030192 · Cited by 253
“Additionally, read depth or eDNA copy number may not to correlate with known biomass [98,104,105].”
BackgroundHow to limit false positives in environmental DNA and metabarcoding?
Ficetola, G. F., Taberlet, P., & Coissac, É. (2016) · Molecular Ecology Resources · doi:10.1111/1755-0998.12508 · Cited by 235
“We know that species with just one (singletons) or two reads in one sample are probably artefacts, but if sequencing depth is high in some cases we can find tens of reads, assigned to absent species (De Barba et al. 2014; Elbrecht & Leese 2015).”
BackgroundImplementing and Innovating Marine Monitoring Approaches for Assessing Marine Environmental Status
Danovaro, R., Carugati, L., Berzano, M., Cahill, A., Carvalho, S., Chenuil, A., Corinaldesi, C., Cristina, S., David, R., Dell’Anno, A., et al. (2016) · Frontiers in Marine Science · doi:10.3389/fmars.2016.00213 · Cited by 257
“Conversely, stronger relationships have been reported between biomass and read proportions (Elbrecht and Leese, 2015).”
BackgroundeDNA metabarcoding as a new surveillance approach for coastal Arctic biodiversity
Lacoursière‐Roussel, A., Howland, K. E., Normandeau, É., Grey, E. K., Archambault, P., Deiner, K., Lodge, D. M., Hernandez, C., Leduc, N., & Bernatchez, L. (2018) · Ecology and Evolution · doi:10.1002/ece3.4213 · Cited by 222
“On the other hand, targeting genes with lower taxonomic specificity (e.g., 18S) could improve the detection of biodiversity shifts at higher levels (e.g., phyla level; see Bik et al., 2012; Deagle et al., 2014; Elbrecht & Leese, 2015).”
BackgroundShort COI markers for freshwater macroinvertebrate metabarcoding
Vamos, E. E., Elbrecht, V., & Leese, F. (2017) · Metabarcoding and Metagenomics · doi:10.3897/mbmg.1.14625 · Cited by 237
Self-citationSorting things out: Assessing effects of unequal specimen biomass on DNA metabarcoding
Elbrecht, V., Peinert, B., & Leese, F. (2017) · Ecology and Evolution · doi:10.1002/ece3.3192 · Cited by 229
“We hypothesize that also in more species rich samples, taxa biomass translates directly into read abundance (assuming no primer bias among species, Elbrecht & Leese, 2015).”
InfluentialSelf-citationVasselon, V., Rimet, F., Tapolczai, K., & Bouchez, A. (2017) · Ecological Indicators · doi:10.1016/j.ecolind.2017.06.024 · Cited by 222
Effect of marker choice and thermal cycling protocol on zooplankton DNA metabarcoding studies
Clarke, L. J., Beard, J. M., Swadling, K. M., & Deagle, B. E. (2017) · Ecology and Evolution · doi:10.1002/ece3.2667 · Cited by 211
“Biases introduced during DNA extraction, PCR amplification, and sequencing are likely to skew the number of reads per taxon, with a disproportionate effect of primertemplate mismatches on PCR- amplification efficiency (Elbrecht & Leese, 2015; Piñol et al., 2015).”
BackgroundOmics Advances in Ecotoxicology
Zhang, X., Xia, P., Wang, P., Yang, J., & Baird, D. J. (2018) · Environmental Science & Technology · doi:10.1021/acs.est.7b06494 · Cited by 214
Censusing marine eukaryotic diversity in the twenty-first century
Leray, M., & Knowlton, N. (2016) · Philosophical Transactions of the Royal Society B Biological Sciences · doi:10.1098/rstb.2015.0331 · Cited by 205
Population‐level inferences from environmental DNA—Current status and future perspectives
Sigsgaard, E. E., Jensen, M. R., Winkelmann, I. E., Møller, P. R., Hansen, M. M., & Thomsen, P. F. (2019) · Evolutionary Applications · doi:10.1111/eva.12882 · Cited by 200
“…eDNA shedding rates between individuals, and biased PCR amplification or capture efficiency (e.g., Alberdi, Aizpurua, Gilbert, & Bohmann, 2018; Elbrecht & Leese, 2015); (d) co-amplification/co-capture of DNA from closely related species (Burbano et al., 2010; Wilcox et al., 2013); (e) risk of…”
BackgroundMetabarcoding a diverse arthropod mock community
Braukmann, T., Ivanova, N. V., Prosser, S. W. J., Elbrecht, V., Steinke, D., Ratnasingham, S., de Waard, J. R., Sones, J. E., Zakharov, E., & Hebert, P. D. N. (2019) · Molecular Ecology Resources · doi:10.1111/1755-0998.13008 · Cited by 199
“Primer bias arises due to either varying levels of primer mismatch or template degradation (Clarke et al., 2014; Elbrecht & Leese, 2015).”
BackgroundInfluentialSelf-citationMethods for the extraction, storage, amplification and sequencing of DNA from environmental samples
Lear, G., Dickie, I. A., Banks, J. C., Boyer, S., Buckley, H. L., Buckley, T. R., Cruickshank, R., Dopheide, A., Handley, K. M., Hermans, S. M., et al. (2018) · New Zealand Journal of Ecology · doi:10.20417/nzjecol.42.9 · Cited by 200
“Virome: The genetic material from all the viruses associated with a host or environment. specific taxa (Elbrecht & Leese 2015; Aylagas et al. 2016) or sample media (Drummond et al. 2015; Klymus et al. 2107).”
BackgroundTaxonomy‐free molecular diatom index for high‐throughput eDNA biomonitoring
Apothéloz‐Perret‐Gentil, L., Cordonier, A., Straub, F., Iseli, J., Esling, P., & Pawlowski, J. W. (2017) · Molecular Ecology Resources · doi:10.1111/1755-0998.12668 · Cited by 176
“It is widely accepted that different technical and biological biases impact the relative abundance of specimens and sequences, making impossible the use of quantitative data in HTS surveys (Elbrecht & Leese 2015).”
BackgroundEstimating intraspecific genetic diversity from community DNA metabarcoding data
Elbrecht, V., Vamos, E. E., Steinke, D., & Leese, F. (2018) · PeerJ · doi:10.7717/peerj.4644 · Cited by 163
“…quality filtering of reads with the 75 recently developed unoise3 denoising strategy (Edgar, 2016) and calibrated this approach using a previously 76 characterized single-species mock sample composed of specimens with known haplotypes (Elbrecht & Leese, 2015; 77 Vamos, Elbrecht & Leese, 2017).”
BackgroundMethodResultInfluentialSelf-citationEnvironmental DNA allows upscaling spatial patterns of biodiversity in freshwater ecosystems
Carraro, L., Mächler, E., Wüthrich, R., & Altermatt, F. (2020) · Nature Communications · doi:10.1038/s41467-020-17337-8 · Cited by 175
Environmental DNA reveals tropical shark diversity in contrasting levels of anthropogenic impact
Bakker, J., Wangensteen, O. S., Chapman, D. D., Boussarie, G., Buddo, D., Guttridge, T. L., Hertler, H., Mouillot, D., Vigliola, L., & Mariani, S. (2017) · Scientific Reports · doi:10.1038/s41598-017-17150-2 · Cited by 195
Random sampling causes the low reproducibility of rare eukaryotic OTUs in Illumina COI metabarcoding
Leray, M., & Knowlton, N. (2017) · PeerJ · doi:10.7717/peerj.3006 · Cited by 175
“Differences in primer 73 affinity among taxonomic groups prevent the detection of some OTUs and result in inaccurate 74 estimates of relative abundances, particularly within complex samples (Pinto & Raskin 2012; 75 Deagle et al. 2013; Elbrecht & Leese 2015; Piñol et al. 2015).”
BackgroundCordier, T., Forster, D., Dufresne, Y., Martins, C. I. M., Stoeck, T., & Pawlowski, J. W. (2018) · Molecular Ecology Resources · doi:10.1111/1755-0998.12926 · Cited by 164
“…their formulas, which appears as an insurmountable problem due to the lack of direct relationship between specimen abundance (or biomass) and sequence reads amount in metabarcoding data (Dowle, Pochon, Banks, Shearer, & Wood, 2016; Elbrecht & Leese, 2015; Vivien, Wyler, Lafont, & Pawlowski, 2015).”
BackgroundTesting the potential of a ribosomal 16S marker for DNA metabarcoding of insects
Elbrecht, V., Taberlet, P., Déjean, T., Valentini, A., Usseglio‐Polatera, P., Beisel, J., Coissac, É., Boyer, F., & Leese, F. (2016) · PeerJ · doi:10.7717/peerj.1966 · Cited by 174
“Laboratory conditions and bioinformatic analyses were kept as similar as possible to the study by 69 (Elbrecht & Leese, 2015).”
BackgroundMethodInfluentialSelf-citationTemporal and spatial variation in distribution of fish environmental DNA in England’s largest lake
Handley, L. L., Read, D. S., Winfield, I. J., Kimbell, H. S., Johnson, H. F., Li, J., Hahn, C., Blackman, R. C., Wilcox, R., Donnelly, R., et al. (2019) · Environmental DNA · doi:10.1002/edn3.5 · Cited by 164
Maximizing fish detection with eDNA metabarcoding
Bessey, C., Jarman, S., Berry, O., Olsen, Y. S., Bunce, M., Simpson, T., Power, M., McLaughlin, J., Edgar, G. J., & Keesing, J. K. (2020) · Environmental DNA · doi:10.1002/edn3.74 · Cited by 164
Aylagas, E., Borja, Á., Muxika, I., & Rodríguez‐Ezpeleta, N. (2018) · Ecological Indicators · doi:10.1016/j.ecolind.2018.07.044 · Cited by 162
Drake, L. E., Cuff, J. P., Young, R., Marchbank, A. M., Chadwick, E. A., & Symondson, W. O. C. (2021) · Methods in Ecology and Evolution · doi:10.1111/2041-210x.13780 · Cited by 178
“This will, however, vary with sequencing depth, with relatively greater depths increasing the likelihood of artefacts having more than 10 occurrences (De Barba et al., 2014; Elbrecht & Leese, 2015).”
BackgroundMethodSchenekar, T., Schletterer, M., Lecaudey, L. A., & Weiss, S. J. (2020) · River Research and Applications · doi:10.1002/rra.3610 · Cited by 157
“…sequence variation in the primer annealing sites among individual species, leading to higher efficiency of the PCR reaction for certain species in a mixed DNA template, while other species might get amplified less or not at all (Bylemans, Gleeson, Hardy, & Furlan, 2018; Elbrecht & Leese, 2015).”
BackgroundLeese, F., Sander, M., Buchner, D., Elbrecht, V., Haase, P., & Zizka, V. M. A. (2020) · Environmental DNA · doi:10.1002/edn3.177 · Cited by 157
Self-citationLeese, F., Bouchez, A., Abarenkov, K., Altermatt, F., Borja, Á., Bruce, K., Ekrem, T., ČIAMPOR, F. J., Čiamporová‐Zaťovičová, Z., Costa, F. O., et al. (2018) · Advances in ecological research/Advances in Ecological Research · doi:10.1016/bs.aecr.2018.01.001 · Cited by 151
“Community metabarcoding relies on PCR amplification using “universal”, i.e., nonspecific primers and thus induces amplification bias when the primers inevitably match some taxa better than others (Elbrecht and Leese, 2015; Krehenwinkel et al., 2017).”
MethodSelf-citationVasselon, V., Bouchez, A., Rimet, F., Jacquet, S., Trobajo, R., Corniquel, M., Tapolczai, K., & Domaizon, I. (2017) · Methods in Ecology and Evolution · doi:10.1111/2041-210x.12960 · Cited by 150
“…density and species biomass are major biases likely to affect DNA metabarcoding quantification of multicellular organisms like macroinvertebrates (Elbrecht & Leese, 2015) or fish (Evans et al., 2016), diatoms are unicellular organisms for which gene copy number is mainly affected by the number…”
BackgroundBista, I., Carvalho, G. R., Tang, M., Walsh, K. A., Zhou, X. Y., Hajibabaei, M., Shokralla, S., Seymour, M., Bradley, D. T. C., Liu, S., et al. (2018) · Molecular Ecology Resources · doi:10.1111/1755-0998.12888 · Cited by 156
From metabarcoding to metaphylogeography: separating the wheat from the chaff
Turón, X., Antich, A., Palacín, C., Præbel, K., & Wangensteen, O. S. (2019) · Ecological Applications · doi:10.1002/eap.2036 · Cited by 147
“Further, the quantitative value of metabarcoding data is debatable (Elbrecht and Leese 2015, Wares and Pap-palardo 2016, Pi ~ nol et al. 2019).”
Studying Ecosystems With DNA Metabarcoding: Lessons From Biomonitoring of Aquatic Macroinvertebrates
Bush, A., Compson, Z. G., Monk, W. A., Porter, T. M., Steeves, R., Emilson, E. J. S., Gagné, N., Hajibabaei, M., Roy, M., & Baird, D. J. (2019) · Frontiers in Ecology and Evolution · doi:10.3389/fevo.2019.00434 · Cited by 146
“As stated above, DNA metabarcoding results do not currently produce a reliable signal of abundance or biomass (Elbrecht and Leese, 2015), although at the same time a bias in organism biomass can reduce the detectability of rare taxa (Elbrecht et al.”
BackgroundZaiko, A., Pochon, X., García‐Vázquez, E., Olenin, S., & Wood, S. A. (2018) · Frontiers in Marine Science · doi:10.3389/fmars.2018.00322 · Cited by 152
“Despite recent attempts to develop and optimize standardized protocols for eDNA metabarcoding (Taberlet et al., 2012; Deiner et al., 2015; Elbrecht and Leese, 2015; Aylagas et al., 2016; Porter and Hajibabaei, 2018), they are often restricted to a portion of the biotic community (e.”
BackgroundStrategies for sample labelling and library preparation in DNA metabarcoding studies
Bohmann, K., Elbrecht, V., Carøe, C., Bista, I., Leese, F., Bunce, M., Yu, D. W., Seymour, M., Dumbrell, A. J., & Creer, S. (2021) · Molecular Ecology Resources · doi:10.1111/1755-0998.13512 · Cited by 143
Self-citationEnvironmental DNA detection of rare and invasive fish species in two Great Lakes tributaries
Balasingham, K. D., Walter, R. P., Mandrak, N. E., & Heath, D. D. (2017) · Molecular Ecology · doi:10.1111/mec.14395 · Cited by 141
“…a semiquantitative measure of signal strength and can, thus, be used as a proxy for detection confidence (stronger signal indicates greater confidence) or, more indirectly, species abundance (Amend, Seifert, & Bruns, 2010; Carew, Pettigrove, Metzeling, & Hoffmann, 2013; Elbrecht & Leese, 2015).”
MethodMorinière, J., Balke, M., Doczkal, D., Geiger, M. F., Hardulak, L. A., Haszprunar, G., Hausmann, A., Hendrich, L., Regalado, L., Rulik, B., et al. (2019) · Molecular Ecology Resources · doi:10.1111/1755-0998.13022 · Cited by 143
“…of invasive and pest species (Ashfaq & Hebert, 2016; L. A. Hardulak et al. in prep), macrozoobenthos sampling for assessing water and stream health (Elbrecht & Leese, 2015; Serrana, Miyake, Gamboa, & Watanabe, 2018), faeces analyses for dietary inference (De Barba et al., 2014; Hawlitschek,…”
BackgroundBylemans, J., Gleeson, D. M., Hardy, C. M., & Furlan, E. M. (2018) · Ecology and Evolution · doi:10.1002/ece3.4387 · Cited by 148
“However, primers used in the initial amplification of barcode sequences can introduce significant biases (Clarke, Beard, Swadling, & Deagle, 2017; Elbrecht & Leese, 2015; Tremblay et al., 2015).”
A performance evaluation of targeted eDNA and eDNA metabarcoding analyses for freshwater fishes
Bylemans, J., Gleeson, D. M., Duncan, R. P., Hardy, C. M., & Furlan, E. M. (2019) · Environmental DNA · doi:10.1002/edn3.41 · Cited by 132
Macher, J., Vivancos, A., Piggott, J. J., Centeno, F. C., Matthaei, C. D., & Leese, F. (2018) · Molecular Ecology Resources · doi:10.1111/1755-0998.12940 · Cited by 147
“This is a suitable alternative to rarefaction (Elbrecht & Leese, 2015).”
MethodSelf-citationGeiger, M. F., Morinière, J., Hausmann, A., Haszprunar, G., Wägele, W. J., Hebert, P. D. N., & Rulik, B. (2016) · Biodiversity Data Journal · doi:10.3897/bdj.4.e10671 · Cited by 128
“For example, because species diversity is relatively low in freshwater ecosystems, metabarcoding has been quite successful in these settings (Elbrecht and Leese 2015, Dowle et al. 2015, Valentini et al. 2016).”
Background“Pitfalls in relative abundance estimation using eDNA metabarcoding”
Fonseca, V. G. (2018) · Molecular Ecology Resources · doi:10.1111/1755-0998.12902 · Cited by 142
Hajibabaei, M., Porter, T. M., Wright, M., & Rudar, J. (2019) · PLoS ONE · doi:10.1371/journal.pone.0220953 · Cited by 141
Zhang, S., Lu, Q., Wang, Y., Wang, X., Zhao, J., & Yao, M. (2019) · Molecular Ecology Resources · doi:10.1111/1755-0998.13105 · Cited by 129
“…can confound the relationship between species abun‐ dance and eDNA concentrations, but the most influential factor is likely to be biased primer binding and amplification of differ‐ ent taxa during PCR (Elbrecht & Leese, 2015; Li, Handley, Read, & Hänfling, 2018; Pinõl, Senar, & Symondson, 2018).”
BackgroundElbrecht, V., Beermann, A. J., Goessler, G., Neumann, J., Tollrian, R., Wagner, R., Wlecklik, A., Piggott, J. J., Matthaei, C. D., & Leese, F. (2016) · Freshwater Biology · doi:10.1111/fwb.12713 · Cited by 132
Self-citationShirazi, S., Meyer, R. S., & Shapiro, B. (2021) · Ecology and Evolution · doi:10.1002/ece3.8239 · Cited by 132
DNA Sequencing as a Tool to Monitor Marine Ecological Status
Goodwin, K. D., Thompson, L., Duarte, B., Kahlke, T., Thompson, A. R., Marques, J. C., & Caçador, I. (2017) · Frontiers in Marine Science · doi:10.3389/fmars.2017.00107 · Cited by 129
“Some studies report adequate estimates of relative abundance (Aylagas et al., 2014, 2016; Elbrecht and Leese, 2015; Tan et al., 2015; Thomsen and Willerslev, 2015) even though read abundance does not necessarily provide a direct correlation to organism abundance because of issues that include…”
BackgroundMethodInfluentialMetabarcoding From Microbes to Mammals: Comprehensive Bioassessment on a Global Scale
Compson, Z. G., McClenaghan, B., Singer, G. A. C., Fahner, N. A., & Hajibabaei, M. (2020) · Frontiers in Ecology and Evolution · doi:10.3389/fevo.2020.581835 · Cited by 128
“For example, a DNA metabarcoding study using a mock community of aquatic macroinvertebrates found four orders of magnitude differences in sequence abundances of 52 taxa despite standardization of biomass prior to PCR amplification and sequencing (Elbrecht and Leese, 2015).”
Scaling up DNA metabarcoding for freshwater macrozoobenthos monitoring
Elbrecht, V., & Steinke, D. (2018) · Freshwater Biology · doi:10.1111/fwb.13220 · Cited by 123
“With the newly designed BF2 + BR2 fusion primers developed in this publication up to three 96- well plates can be multiplexed for a single run n1 1 2 3 4 5 6pos 7 9 10 11 12 13 n28 14 16 n3 17 18 19 2015 21 23 24 25 n4 26 2722 28 29 30 31 32 33 34n5 35 37 38 n6 39 40 4136 1 n7 3 4 5 6 72 8 10 11 12 13 n8 149 15 17 18…”
BackgroundMethodResultInfluentialSelf-citationLaroche, O., Wood, S. A., Tremblay, L. A., Ellis, J. I., Lear, G., & Pochon, X. (2017) · Marine Pollution Bulletin · doi:10.1016/j.marpolbul.2017.11.042 · Cited by 128
Vasselon, V., Domaizon, I., Rimet, F., Kahlert, M., & Bouchez, A. (2017) · Freshwater Science · doi:10.1086/690649 · Cited by 117
“…amplification efficiency that may differ among species; DNA sequencing errors and bioinformatics filtering that may affect DNA sequence reliability (Jeon et al. 2008, Amend et al. 2010, Bragg et al. 2013, Weber and Pawlowski 2013, Deiner et al. 2015, Elbrecht and Leese 2015, Schmidt et al. 2015).”
BackgroundMata, V. A., Rebelo, H., Amorim, F., McCracken, G. F., Jarman, S., & Beja, P. R. (2018) · Molecular Ecology · doi:10.1111/mec.14779 · Cited by 117
“Another problem is the imperfect correlation between the proportions of sequencing reads and biomass, making it hard to establish the contribution of each prey item to the overall diet (Deagle, Thomas, Shaffer, Trites, & Jarman, 2013; Elbrecht & Leese, 2015; Piñol, Mir, Gomez‐Polo, & Agustí, 2015).”
BackgroundEcogenomics of Zooplankton Community Reveals Ecological Threshold of Ammonia Nitrogen
Yang, J., Zhang, X., Xie, Y., Song, C., Sun, J., Zhang, Y., Giesy, J. P., & Yu, H. (2017) · Environmental Science & Technology · doi:10.1021/acs.est.6b05606 · Cited by 114
PrimerMiner : an r package for development and in silico validation of DNA metabarcoding primers
Elbrecht, V., & Leese, F. (2016) · Methods in Ecology and Evolution · doi:10.1111/2041-210x.12687 · Cited by 114
“…regions like the cytochrome c oxidase subunit I (COI) fragment for animals often show highly variable primer binding sites (Deagle et al. 2014; Sharma & Kobayashi 2014) leading sometimes to substantial primer bias and species remaining undetected (Pi ~ nol et al. 2014; Elbrecht & Leese 2015).”
BackgroundSelf-citationCoble, A. A., Flinders, C., Homyack, J. A., Penaluna, B. E., Cronn, R., & Weitemier, K. (2018) · The Science of The Total Environment · doi:10.1016/j.scitotenv.2018.08.370 · Cited by 116
Impacts of DNA extraction and PCR on DNA metabarcoding estimates of soil biodiversity
Dopheide, A., Xie, D., Buckley, T. R., Drummond, A. J., & Newcomb, R. D. (2018) · Methods in Ecology and Evolution · doi:10.1111/2041-210x.13086 · Cited by 112
“A common strategy to limit these effects is the exclusion of low- abundance sequences or OTUs (Elbrecht & Leese, 2015; Vesty et al., 2017), yet our estimates were derived from OTU clustering with singleton sequences excluded, and further removal of OTUs with abundances <5 resulted in very similar…”
BackgroundInfluentialUncovering the complete biodiversity structure in spatial networks: the example of riverine systems
Altermatt, F., Little, C. J., Mächler, E., Wang, S., Zhang, X., & Blackman, R. C. (2020) · Oikos · doi:10.1111/oik.06806 · Cited by 114
“However, due to the poorly conserved region there is often primer bias (Elbrecht and Leese 2015) and identification to species-level is limited to some major taxonomic groups.”
BackgroundMartin, J. L., Santi, I., Pitta, P., John, U., & Gypens, N. (2022) · Metabarcoding and Metagenomics · doi:10.3897/mbmg.6.85794 · Cited by 113
“…issues occurring due to sample preservation (Mäki et al. 2017), DNA extraction (Van der Loos and Nijland 2021), primer choice and specificity (Elbrecht and Leese 2015; Lapeyra Martin et al. 2022; Latz et al. 2022) and ultimately PCR, which under- or overestimate different groups…”
BackgroundEffective mosquito and arbovirus surveillance using metabarcoding
Batovska, J., Lynch, S., Cogan, N. O. I., Brown, K., Darbro, J. M., Kho, E. A., & Blacket, M. J. (2017) · Molecular Ecology Resources · doi:10.1111/1755-0998.12682 · Cited by 111
“The use of universal primers for amplification of a range of species can cause variance in read number among taxa by several orders of magnitude (Elbrecht & Leese, 2015; Pi~nol et al., 2015).”
BackgroundResultComparing eDNA metabarcoding and species collection for documenting Arctic metazoan biodiversity
Leduc, N., Lacoursière‐Roussel, A., Howland, K. E., Archambault, P., Sevellec, M., Normandeau, É., Dispas, A., Winkler, G., McKindsey, C. W., Simard, N. N., et al. (2019) · Environmental DNA · doi:10.1002/edn3.35 · Cited by 110
Lanzén, A., Lekang, K., Jonassen, I., Thompson, E. M., & Troedsson, C. (2016) · Molecular Ecology · doi:10.1111/mec.13761 · Cited by 107
Nakagawa, H., Yamamoto, S., Sato, Y., Sado, T., Minamoto, T., & Miya, M. U. (2018) · Freshwater Biology · doi:10.1111/fwb.13094 · Cited by 104
“In 441 addition, we might reduce the effect of primer-bias (i.e., the variation in amplification 442 efficiency among species) by using multiple universal primers (Elbrecht & Leese, 2015; 443 Vallentini et al., 2016).”
MethodHajibabaei, M., Porter, T. M., Robinson, C. V., Baird, D. J., Shokralla, S., & Wright, M. (2019) · PLoS ONE · doi:10.1371/journal.pone.0225409 · Cited by 112
Macher, J., Salis, R. K., Blakemore, K. S., Tollrian, R., Matthaei, C. D., & Leese, F. (2015) · Ecological Indicators · doi:10.1016/j.ecolind.2015.08.024 · Cited by 107
Self-citationDormontt, E. E., van Dijk, K., Bell, K. L., Biffin, E., Breed, M. F., Byrne, M. M., Caddy‐Retalic, S., Encinas‐Viso, F., Nevill, P., Shapcott, A., et al. (2018) · Frontiers in Ecology and Evolution · doi:10.3389/fevo.2018.00134 · Cited by 103
Vitecek, S., Kučinić, M., Previšić, A., Živić, I. M., Stojanović, K. Z., Keresztes, L., Bálint, M., Hoppeler, F., Waringer, J. A., Graf, W., et al. (2017) · BMC Evolutionary Biology · doi:10.1186/s12862-017-0972-5 · Cited by 97
DNA metabarcoding for high-throughput monitoring of estuarine macrobenthic communities
Lobo, J., Shokralla, S., Costa, M. H., Hajibabaei, M., & Costa, F. O. (2017) · Scientific Reports · doi:10.1038/s41598-017-15823-6 · Cited by 102
Metabarcoding of lake benthic diatoms: from structure assemblages to ecological assessment
Rivera, S. F., Vasselon, V., Jacquet, S., Bouchez, A., Arizteguí, D., & Rimet, F. (2017) · Hydrobiologia · doi:10.1007/s10750-017-3381-2 · Cited by 96
“…choice of a targeted gene for DNA barcode (Kermarrec et al., 2013; Valentini et al., 2016), the choice of the set of primers for DNA metabarcoding (Elbrecht & Leese 2015), the choice of the PCR amplification protocol (Kebschull & Zador, 2015), the choice of the sequencing technology (Quail et…”
MethodSato, H., Sogo, Y., Doi, H., & Yamanaka, H. (2017) · Scientific Reports · doi:10.1038/s41598-017-14978-6 · Cited by 102
Deagle, B. E., Clarke, L. J., Kitchener, J. A., Polanowski, A. M., & Davidson, A. T. (2017) · Molecular Ecology Resources · doi:10.1111/1755-0998.12740 · Cited by 94
Smith, K. F., Kohli, G. S., Murray, S. A., & Rhodes, L. L. (2017) · New Zealand Journal of Marine and Freshwater Research · doi:10.1080/00288330.2017.1298632 · Cited by 94
“Biases caused by primer-associated PCR efficiency, even when using ‘universal primers’, can lead to highly varied read numbers, affecting both abundant and rare taxa, and can result in false negatives (Elbrecht & Leese 2015; Zhan &MacIsaac 2015).”
BackgroundResulteDNA in subterranean ecosystems: Applications, technical aspects, and future prospects
Saccò, M., Guzik, M. T., van der Heyde, M., Nevill, P., Cooper, S. J., Austin, A. D., Coates, P. J., Allentoft, M. E., & White, N. E. (2022) · The Science of The Total Environment · doi:10.1016/j.scitotenv.2022.153223 · Cited by 99
A DNA metabarcoding approach to characterize soil arthropod communities
Oliverio, A., Gan, H., Wickings, K. G., & Fierer, N. (2018) · Soil Biology and Biochemistry · doi:10.1016/j.soilbio.2018.06.026 · Cited by 92
“approaches are not a valid proxy for abundances or relative abundances due to body size differences and given that DNA can be shed in frass (Elbrecht and Leese, 2015).”
Background
Metadata
- Authors
- Elbrecht, V., & Leese, F.
- Affiliations
- Ruhr University Bochum (DE)
- Corresponding author
- Leese, Florian
- Venue
- PLOS ONE
- Publisher
- Public Library of Science (PLoS)
- Published
- 2015-07-08
- Volume
- 10
- Issue
- 7
- Pages
- e0130324
- ISSN
- 1932-6203 (ISSN-L)
- PMC
- PMC4496048
- OpenAlex
- W1551951435
- Semantic Scholar
- 5b5925709b20821df1f956c4c737e5fadb1e8b43
- Cited by
- 765
- References
- 60
- Citations by year
- 2026: 75 · 2025: 73 · 2024: 49 · 2023: 69 · 2022: 71 · 2021: 91 · 2020: 75 · 2019: 73 · 2018: 108 · 2017: 51 · 2016: 26 · 2015: 3
- FWCI
- 56.82
- Type
- journal article
- Language
- en
- Open access
- gold
- doi.org
- Licence
- Locations
- PLoS ONE (publishedVersion, cc-by)
- PubMed Central (publishedVersion, cc-by)
- PubMed (publishedVersion)
- DOAJ (DOAJ: Directory of Open Access Journals) (submittedVersion, cc-by-sa)
- Figshare (submittedVersion, cc-by)
- Topics
- Physical Sciences › Environmental Science › Ecology › Environmental DNA in Biodiversity Studies
- Life Sciences › Agricultural and Biological Sciences › Ecology, Evolution, Behavior and Systematics › Invertebrate Taxonomy and Ecology
- Physical Sciences › Environmental Science › Ecology › Microbial Community Ecology and Physiology
- Keywords
- DNA metabarcoding, primer bias, species abundance estimation, COI barcoding, freshwater macroinvertebrates, Plecoptera, MiSeq sequencing, biodiversity assessment
- MeSH terms
- Animals, Electron Transport Complex IV, Diptera, DNA, Fresh Water, Haplotypes, Species Specificity, Reproducibility of Results, Polymerase Chain Reaction, Ecosystem, DNA Primers, Biomass, Biodiversity, DNA Barcoding, Taxonomic, High-Throughput Nucleotide Sequencing, Odonata
About these checks
Registry, retraction, Cites and statistics results are computed, not judged, with one exception: a printed reference that no index lists is read once by a model before it counts as a citation error. Claims are extracted by a model and kept only when their quote appears verbatim in the text; each cited source is then checked, with a model’s help, for whether it says what the claim relies on. Those verdicts can be wrong — read the claim’s quote and the cited source before relying on one.
A language model drew the claims from the paper on 2026-10-06, under version 3 of the claim definition (model deepseek-v4.1-flash, prompt extract-v3).
A second model labelled each claim on 2026-10-06 (model jev-1.13-20260917, definition revision gold-guideline-v0.2).
Statistics and arithmetic are recomputed, not judged.
Confidence bands are shown only for fields calibrated on our annotated test set. None is calibrated yet, so no band is shown.
What counts as a claim ›How we measure confidence ›How we check this ›
Are you an author, or do you see a problem with this page? Request a review
