

The DOI matches its Crossref record; 114 of the 114 references it cites were found in a registry or an index.
A Social Network Approach Reveals Associations between Mouse Social Dominance and Brain Gene Expression
Open accessAbstract
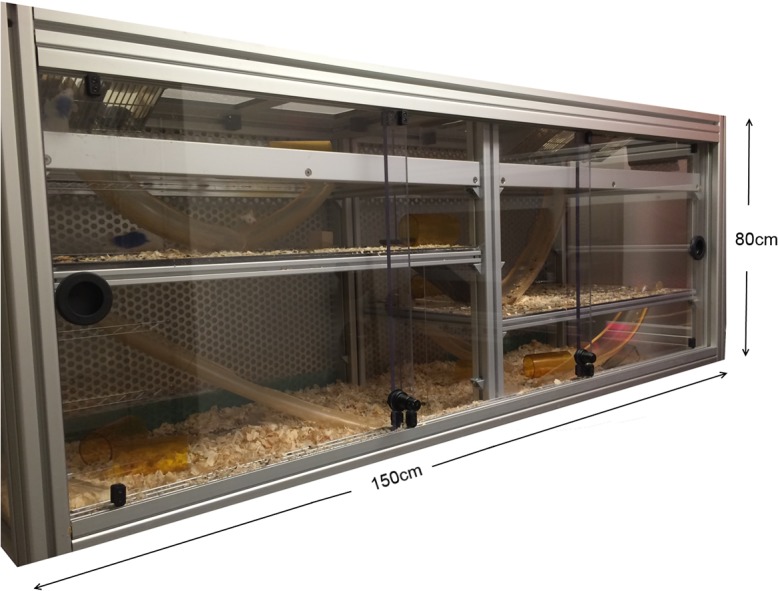
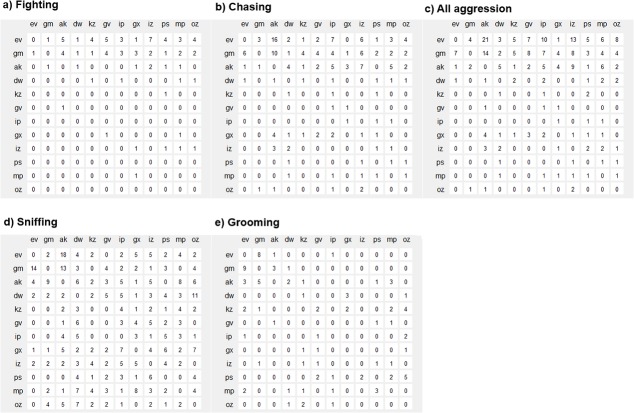
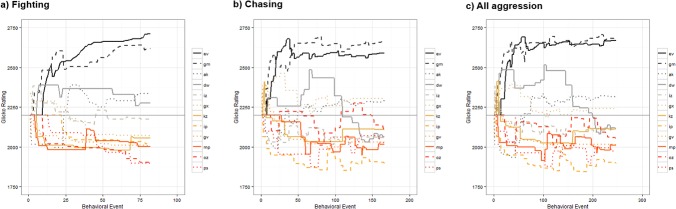
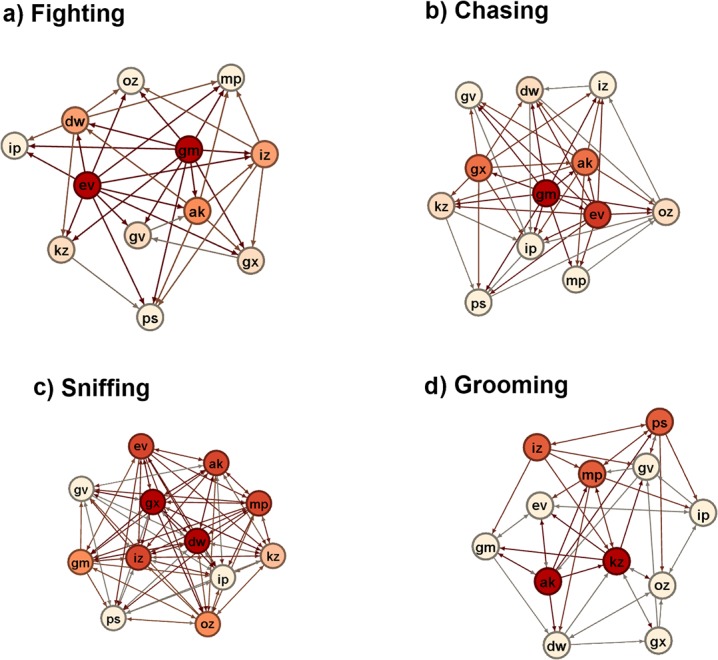
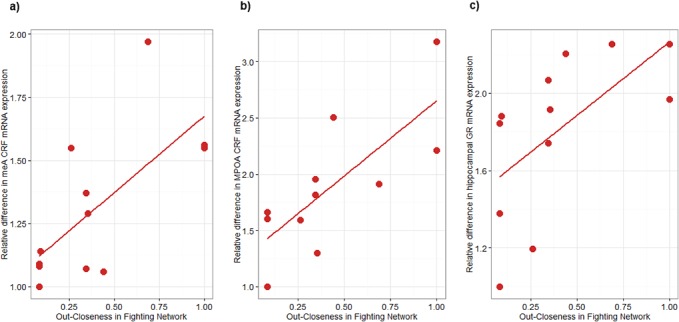
Modelling complex social behavior in the laboratory is challenging and requires analyses of dyadic interactions occurring over time in a physically and socially complex environment. In the current study, we approached the analyses of complex social interactions in group-housed male CD1 mice living in a large vivarium. Intensive observations of social interactions during a 3-week period indicated that male mice form a highly linear and steep dominance hierarchy that is maintained by fighting and chasing behaviors. Individual animals were classified as dominant, sub-dominant or subordinate according to their David's Scores and I& SI ranking. Using a novel dynamic temporal Glicko rating method, we ascertained that the dominance hierarchy was stable across time. Using social network analyses, we characterized the behavior of individuals within 66 unique relationships in the social group. We identified two individual network metrics, Kleinberg's Hub Centrality and Bonacich's Power Centrality, as accurate predictors of individual dominance and power. Comparing across behaviors, we establish that agonistic, grooming and sniffing social networks possess their own distinctive characteristics in terms of density, average path length, reciprocity out-degree centralization and out-closeness centralization. Though grooming ties between individuals were largely independent of other social networks, sniffing relationships were highly predictive of the directionality of agonistic relationships. Individual variation in dominance status was associated with brain gene expression, with more dominant individuals having higher levels of corticotropin releasing factor mRNA in the medial and central nuclei of the amygdala and the medial preoptic area of the hypothalamus, as well as higher levels of hippocampal glucocorticoid receptor and brain-derived neurotrophic factor mRNA. This study demonstrates the potential and significance of combining complex social housing and intensive behavioral characterization of group-living animals with the utilization of novel statistical methods to further our understanding of the neurobiological basis of social behavior at the individual, relationship and group levels.
Overview
The claims and statistics of this paper haven’t been checked yet.
Run the check — free, no account needed. It reads the open-access text and checks the sources it cites.
Integrity signals
Registry
Cites
Statistics
Figures
Verification
Claims the paper makes
The claims and statistics of this paper haven’t been checked yet.
Run the check — free, no account needed. It reads the open-access text and checks the sources it cites.
Claims other papers make about this one
Each is checked against this paper’s own text: does it say what the citing paper says it does?
In the citing paper
“In some studies the subordinates form linear hierarchies, 136,138,141 while in others ranking is more despotic.80,97,142”
From Ecological validity of social interaction tests in rats and mice (2019) · cites this paper as [141]
Self-check
Percentages, sums and reported differences re-computed from the paper’s own numbers.
The self-check needs the paper’s full text.
Citations
Cites
R: A Language and Environment for Statistical Computing
R Core Team (2000) · doi:10.32614/r.manuals · Cited by 355,893
The igraph software package for complex network research
Csárdi, G., & Nepusz, T. (2006) · Medical Entomology and Zoology · Cited by 10,078
Power and Centrality: A Family of Measures
Bonacich, P. (1987) · American Journal of Sociology · doi:10.1086/228631 · Cited by 5,261
Introduction to Social Network Methods
Hanneman, R. A. (2001) · Cited by 3,895
Authoritative sources in a hyperlinked environment
Kleinberg, J. M. (1998) · Symposium on Discrete Algorithms · doi:10.5555/314613.315045 · Cited by 1,815
Sustained hippocampal chromatin regulation in a mouse model of depression and antidepressant action
Tsankova, N. M., Berton, O., Renthal, W., Kumar, A., Neve, R. L., & Nestler, E. J. (2006) · Nature Neuroscience · doi:10.1038/nn1659 · Cited by 1,780
Phasic vs Sustained Fear in Rats and Humans: Role of the Extended Amygdala in Fear vs Anxiety
Davis, M., Walker, D. L., Miles, L., & Grillon, C. (2010) · Neuropsychopharmacology · doi:10.1038/npp.2009.109 · Cited by 1,513 · cited 1×
“Further, the medial and capsular subdivisions of the CeA, a nucleus that is critical for the coordination of sensory experience, social learning and memory and emotional behaviors [29], receives substantial innervations from the MeA [94].”
BackgroundHippocampal BDNF mediates the efficacy of exercise on synaptic plasticity and cognition
Vaynman, S., Ying, Z., & Gomez‐Pinilla, F. (2004) · European Journal of Neuroscience · doi:10.1111/j.1460-9568.2004.03720.x · Cited by 1,460
The Method of Paired Comparisons.
Curnow, R. N., & David, H. A. (1964) · Journal of the Royal Statistical Society Series A (General) · doi:10.2307/2344014 · Cited by 1,285
CRF and CRF receptors: role in stress responsivity and other behaviors
Bale, T. L., & Vale, W. W. (2004) · Annual Review of Pharmacology and Toxicology · doi:10.1146/annurev.pharmtox.44.101802.121410 · Cited by 1,270
Research works printed but not linked: 1
- RJ Berry, 1970, The Natural History of the House Mouse, Field Studies, 3, 219
Cited by
Sorted by citations
Social functioning in major depressive disorder
Kupferberg, A., Bicks, L., & Hasler, G. (2016) · Neuroscience & Biobehavioral Reviews · doi:10.1016/j.neubiorev.2016.07.002 · Cited by 663
“These paradigms have pointed to stress related hormones, such as corticotropin-releasing factor (CRF), acting within brain regions such as the medial and central amygdala and the medial preoptic area of the hypothalamus as predictors of dominance in large social networks (So et al. 2015).”
Social connectedness, mental health and the adolescent brain
Lamblin, M., Murawski, C., Whittle, S., & Fornito, A. (2017) · Neuroscience & Biobehavioral Reviews · doi:10.1016/j.neubiorev.2017.05.010 · Cited by 375
Neural mechanisms of social homeostasis
Matthews, G. A., & Tye, K. M. (2019) · Annals of the New York Academy of Sciences · doi:10.1111/nyas.14016 · Cited by 273
Neural mechanisms of aggression across species
Lischinsky, J. E., & Lin, D. (2020) · Nature Neuroscience · doi:10.1038/s41593-020-00715-2 · Cited by 276
A practical guide for inferring reliable dominance hierarchies and estimating their uncertainty
Sánchez‐Tójar, A., Schroeder, J., & Farine, D. R. (2017) · Journal of Animal Ecology · doi:10.1111/1365-2656.12776 · Cited by 247
Prefrontal–amygdala circuits in social decision-making
Gangopadhyay, P., Chawla, M., Monte, O. D., & Chang, S. W. C. (2020) · Nature Neuroscience · doi:10.1038/s41593-020-00738-9 · Cited by 266
de Chaumont, F., Ey, E., Torquet, N., Lagache, T., Dallongeville, S., Imbert, A., Legou, T., Sourd, A. L., Fauré, P., Bourgeron, T., et al. (2019) · Nature Biomedical Engineering · doi:10.1038/s41551-019-0396-1 · Cited by 255
Aggression and dominance: an interdisciplinary overview
Holekamp, K. E., & Strauss, E. D. (2016) · Current Opinion in Behavioral Sciences · doi:10.1016/j.cobeha.2016.08.005 · Cited by 176
“Other work has also revealed important effects of an individual’s rank position on many other aspects of its biology, including its circadian rhythms [11] immune function [12,13], brain development [14], and patterns of gene expression in the adult brain [15,16].”
BackgroundCortical ensembles orchestrate social competition through hypothalamic outputs
Padilla-Coreano, N., Batra, K., Patarino, M., Chen, Z., Rock, R. R., Zhang, R., Hausmann, S. B., Weddington, J., Patel, R. R., Zhang, Y. E., et al. (2022) · Nature · doi:10.1038/s41586-022-04507-5 · Cited by 162
Self-citationTemporal dynamics of social hierarchy formation and maintenance in male mice
Williamson, C. M., Lee, W., & Curley, J. P. (2016) · Animal Behaviour · doi:10.1016/j.anbehav.2016.03.004 · Cited by 150
“We calculated the temporal changes in individual dominance ratings of each subject in each cohort using Glicko ratings (Glickman, 1999; So et al., 2015).”
BackgroundMethodInfluentialSelf-citationThe neural circuitry of social homeostasis: Consequences of acute versus chronic social isolation
Lee, C. R., Chen, A., & Tye, K. M. (2021) · Cell · doi:10.1016/j.cell.2021.02.028 · Cited by 146
“Linear social hierarchies were first observed in domestic fowl who demonstrate a pecking order (Schjelderup-Ebbe, 1922) and are also observed in CD1 mice (So et al., 2015).”
BackgroundEcological validity of social interaction tests in rats and mice
Kondrakiewicz, K., Kostecki, M., Szadzińska, W., & Knapska, E. (2019) · Genes, Brain and Behavior · doi:10.1111/gbb.12525 · Cited by 136
Advances in understanding neural mechanisms of social dominance
Zhou, T., Sandi, C., & Hu, H. (2018) · Current Opinion in Neurobiology · doi:10.1016/j.conb.2018.01.006 · Cited by 133
“CD1 mice Offensive and defensive behaviors in large vivarium Individual variation in dominance status is associated with brain gene expression [15].”
BackgroundDynamics of a disinhibitory prefrontal microcircuit in controlling social competition
Zhang, C., Zhu, H. L., Ni, Z., Xin, Q., Zhou, T., Wu, R., Gao, G., Gao, Z., Ma, H., Li, H., et al. (2021) · Neuron · doi:10.1016/j.neuron.2021.10.034 · Cited by 127
Cage aggression in group-housed laboratory male mice: an international data crowdsourcing project
Lidster, K., Owen, K., Browne, W. J., & Prescott, M. J. (2019) · Scientific Reports · doi:10.1038/s41598-019-51674-z · Cited by 111
Opendak, M., Gould, E., & Sullivan, R. (2017) · Developmental Cognitive Neuroscience · doi:10.1016/j.dcn.2017.02.002 · Cited by 94
Manifestations of domination: Assessments of social dominance in rodents
Fulenwider, H. D., Caruso, M. A., & Ryabinin, A. E. (2021) · Genes Brain & Behavior · doi:10.1111/gbb.12731 · Cited by 87
Hierarchy in the home cage affects behaviour and gene expression in group-housed C57BL/6 male mice
Horii, Y., Nagasawa, T., Sakakibara, H., Takahashi, A., Tanave, A., Matsumoto, Y., Nagayama, H., Yoshimi, K., Yasuda, M. T., Shimoi, K., et al. (2017) · Scientific Reports · doi:10.1038/s41598-017-07233-5 · Cited by 74
Neuro-Immune Mechanisms Regulating Social Behavior: Dopamine as Mediator?
Kopec, A. M., Smith, C. J. W., & Bilbo, S. D. (2019) · Trends in Neurosciences · doi:10.1016/j.tins.2019.02.005 · Cited by 69
Lee, W., Khan, A., & Curley, J. P. (2017) · Proceedings of the Royal Society B Biological Sciences · doi:10.1098/rspb.2017.1570 · Cited by 73
“The vivarium was constructed as previously described [10,11].”
MethodSelf-citationWilliamson, C. M., Franks, B., & Curley, J. P. (2016) · Frontiers in Behavioral Neuroscience · doi:10.3389/fnbeh.2016.00152 · Cited by 64
Self-citationWilliamson, C. M., Romeo, R. D., & Curley, J. P. (2017) · Hormones and Behavior · doi:10.1016/j.yhbeh.2016.11.001 · Cited by 62
“Previously, we have shown that outbred CD-1 male mice housed in groups of 12 will consistently and rapidly form linear dominance hierarchies in the laboratory (So et al., 2015; Williamson et al., 2016).”
BackgroundMethodSelf-citationEastman, G., Valiño, G., Radío, S., Young, R. L., Quintana, L., Zakon, H. H., Hofmann, H. A., Sotelo-Silveira, J. R., & da Silva, A. C. R. (2020) · Scientific Reports · doi:10.1038/s41598-020-66494-9 · Cited by 61
Ike, K. G. O., de Boer, S. F., Buwalda, B., & Kas, M. J. (2020) · Neuroscience & Biobehavioral Reviews · doi:10.1016/j.neubiorev.2020.06.030 · Cited by 64
“Subordinate mice display decreased social interactions when compared to dominant mice in the same colony (So et al., 2015).”
Phenotypic variability between Social Dominance Ranks in laboratory mice
Varholick, J. A., Bailoo, J. D., Palme, R., & Würbel, H. (2018) · Scientific Reports · doi:10.1038/s41598-018-24624-4 · Cited by 53
Stress in groups: Lessons from non-traditional rodent species and housing models
Beery, A. K., Holmes, M. M., Lee, W., & Curley, J. P. (2020) · Neuroscience & Biobehavioral Reviews · doi:10.1016/j.neubiorev.2020.03.033 · Cited by 55
“There are also several other differences in central gene expression of hormones and neurotransmitters and their receptors between dominant and subordinate rats and mice of both sexes which may be related to plastic changes in other social, emotional or cognitive behaviors (Albeck et al., 1997; McEwen et al., 2015; So…”
BackgroundSelf-citationSexual Dimorphism in Aggression: Sex-Specific Fighting Strategies Across Species
Pandolfi, M., Scaia, M. F., & Fernandez, M. P. (2021) · Frontiers in Behavioral Neuroscience · doi:10.3389/fnbeh.2021.659615 · Cited by 49
Lakka, T. A., Lintu, N., Väistö, J., Viitasalo, A., Sallinen, T., Haapala, E. A., Tompuri, T., Soininen, S., Karjalainen, P., Schnurr, T. M., et al. (2020) · Diabetologia · doi:10.1007/s00125-020-05250-0 · Cited by 52
Lee, W., Hiura, L. C., Yang, E., Denney, K. A., Ophir, A. G., & Curley, J. P. (2019) · Hormones and Behavior · doi:10.1016/j.yhbeh.2019.06.015 · Cited by 49
Self-citationAdult-Born Neurons in the Hippocampus Are Essential for Social Memory Maintenance
Cope, E. C., Waters, R. C., Diethorn, E. J., Pagliai, K. A., Dias, C. G., Tsuda, M. C., Cameron, H. A., & Gould, E. (2020) · eNeuro · doi:10.1523/eneuro.0182-20.2020 · Cited by 52
“Despite previous work showing that CD1 mice form stable hierarchies (So et al., 2015), neither CD1 controls nor TK mice exhibited consistent results in the tube test, nor in agonistic acts within the home cage, rendering it difficult to determine social rank status.”
ResultHow feedback and feed‐forward mechanisms link determinants of social dominance
Dehnen, T., Arbon, J. J., Farine, D. R., & Boogert, N. J. (2022) · Biological reviews/Biological reviews of the Cambridge Philosophical Society · doi:10.1111/brv.12838 · Cited by 54
“Furthermore, dominance status is related to many other aspects of biology, such as physiology (Sapolsky, 2005), gene expression (So et al., 2015), cognitive performance (Wallace et al.”
BackgroundTemporal pairwise-correlation analysis provides empirical support for attention hierarchies in mice
Curley, J. P. (2016) · Biology Letters · doi:10.1098/rsbl.2016.0192 · Cited by 43
“Observations from my laboratory have recently shown that groups of laboratory male mice living together in a laboratory-based burrow system that mimics the natural habitat of the ancestral Mus musculus rapidly form highly linear social dominance hierarchies with a high degree of directional consistency in aggression […”
BackgroundMethodSelf-citationThe feeding microstructure of male and female mice
Rathod, Y. D., & Fulvio, M. D. (2021) · PLoS ONE · doi:10.1371/journal.pone.0246569 · Cited by 50
Lee, W., Milewski, T. M., Dwortz, M. F., Young, R. L., Gaudet, A. D., Fonken, L. K., Champagne, F. A., & Curley, J. P. (2022) · Brain Behavior and Immunity · doi:10.1016/j.bbi.2022.04.015 · Cited by 44
Self-citationEndo, N., Ujita, W., Fujiwara, M., Miyauchi, H., Mishima, H., Makino, Y., Hashimoto, L., Ōyama, H., Makinodan, M., Nishi, M., et al. (2018) · Communications Biology · doi:10.1038/s42003-018-0213-5 · Cited by 46
The dynamics of dominance: open questions, challenges and solutions
Strauss, E. D., & Shizuka, D. (2022) · Philosophical Transactions of the Royal Society B · doi:10.1098/rstb.2020.0445 · Cited by 42
Makowska, I. J., Franks, B., El-Hinn, C., Jorgensen, T., & Weary, D. M. (2019) · Scientific Reports · doi:10.1038/s41598-019-42512-3 · Cited by 41
Self-citationForaging dynamics are associated with social status and context in mouse social hierarchies
Lee, W., Yang, E., & Curley, J. P. (2018) · PeerJ · doi:10.7717/peerj.5617 · Cited by 38
Self-citationde Freslon, I., Martínez‐López, B., Belkhiria, J., Strappini, A., & Monti, G. (2019) · Applied Animal Behaviour Science · doi:10.1016/j.applanim.2019.01.006 · Cited by 37
Peleh, T., Ike, K. G. O., Wams, E. J., Lebois, E. P., & Hengerer, B. (2019) · Neuroscience & Biobehavioral Reviews · doi:10.1016/j.neubiorev.2018.07.018 · Cited by 39
“Likewise, relative hippocampal glucocorticoid receptor (GR) and brain-derived neurotrophic factor (BDNF) expression are elevated in socially dominant animals (So et al., 2015).”
Williamson, C. M., Klein, I. S., Lee, W., & Curley, J. P. (2019) · Social Neuroscience · doi:10.1080/17470919.2018.1479303 · Cited by 37
“In previous studies, we have demonstrated differential gene expression throughout the brains of 88 outbred CD1 mice of different social rank living in linear hierarchies, specifically in the medial 89 amygdala, central amygdala, medial preoptic area (So et al., 2015) and in the whole 90 hippocampus (Williamson, Franks…”
BackgroundSelf-citationMitofusin-2 in nucleus accumbens D2-MSNs regulates social dominance and neuronal function
Ghosal, S., Gebara, E., Ramos‐Fernández, E., Chioino, A., Grosse, J., de Suduiraut, I. G., Zanoletti, O., Schneider, B. L., Antonio Zorzano, A., Astori, S., et al. (2023) · Cell Reports · doi:10.1016/j.celrep.2023.112776 · Cited by 33
A systematic review and meta-analysis of how social memory is studied
Cum, M., Pérez, J., Wangia, E., Lopez, N., Wright, E. S., Iwata, R. L., Li, A., Chambers, A. R., & Padilla-Coreano, N. (2024) · Scientific Reports · doi:10.1038/s41598-024-52277-z · Cited by 35
“Furthermore, in captivity, both wild mice 9,10 and laboratory mice 11,12 form social hierarchies.”
BackgroundSex-dependent control of pheromones on social organization within groups of wild house mice
Zilkha, N., Chuartzman, S. G., Sofer, Y., Pen, Y., Cum, M., Mayo, A., Alon, U. S., & Kimchi, T. (2023) · Current Biology · doi:10.1016/j.cub.2023.02.039 · Cited by 32
“32,52,53 This rating system is a method for calculating the relative skill level of players in competitor-versus-competitor games such as chess 52 and it was successfully applied to evaluate dominance relationships within groups of mice living under semi-natural conditions.”
Viblanc, V. A., Pasquaretta, C., Sueur, C., Boonstra, R., & Dobson, F. S. (2016) · Behavioral Ecology · doi:10.1093/beheco/arw098 · Cited by 30
Reestablishment of Social Hierarchies in Weaned Pigs after Mixing
Tong, X., Shen, C., Chen, R., Gao, S., Liu, X., Schinckel, A. P., & Zhou, B. (2019) · Animals · doi:10.3390/ani10010036 · Cited by 30
“The temporal changes in individual dominance ratings of each piglet in each pen were calculated using Glicko ratings index [22,40].”
MethodNeural Circuits Underlying Rodent Sociality: A Comparative Approach
Lee, N. S., & Beery, A. K. (2019) · Current topics in behavioral neurosciences · doi:10.1007/7854_2018_77 · Cited by 31
Structure and function of the medial amygdala
(2020) · Handbook of Behavioral Neuroscience · doi:10.1016/b978-0-12-815134-1.00002-7 · Cited by 29
Chase, I. D., & Lindquist, W. B. (2016) · PLoS ONE · doi:10.1371/journal.pone.0158900 · Cited by 31
“They find no evidence of dominance relationships for some members of these groups and, while many of the groups’ hierarchy structures are not linear, they do contain significantly fewer intransitive triads than expected by chance (also see [48].”
BackgroundNeurobiological Bases of Social Networks
Han, M., Jiang, G., Luo, H., & Shao, Y. (2021) · Frontiers in Psychology · doi:10.3389/fpsyg.2021.626337 · Cited by 35
“, friends, couples, and colleagues), social networks provide relatively complete and ecologically valid structural and functional frameworks that integrate multiple levels of interaction units, including one-to-one social relationships among individuals and their indirect relationships (Fischer, 1983; Krause et al., 2…”
BackgroundZipple, M. N., Vogt, C. C., & Sheehan, M. J. (2023) · Neuroscience & Biobehavioral Reviews · doi:10.1016/j.neubiorev.2023.105238 · Cited by 27
Neural mechanisms of comforting: Prosocial touch and stress buffering
Lim, K. Y., & Hong, W. (2023) · Hormones and Behavior · doi:10.1016/j.yhbeh.2023.105391 · Cited by 30
“However, other studies have shown that allogrooming is not predictive of social rank or dominance hierarchy in males (Barabas et al., 2021a; So et al., 2015).”
Gαi2+ vomeronasal neurons govern the initial outcome of an acute social competition
Pallé, A., Montero, M., Fernández, S., Tezanos, P., Heras, J. A. D. L., Luskey, V. E., Birnbaumer, L., Zufall, F., Chamero, P., & Trejo, J. L. (2020) · Scientific Reports · doi:10.1038/s41598-020-57765-6 · Cited by 24
Lee, W., Dowd, H. N., Nikain, C., Dwortz, M. F., Yang, E., & Curley, J. P. (2021) · Scientific Reports · doi:10.1038/s41598-021-82255-8 · Cited by 29
Self-citationWeger, M., Sevelinges, Y., Grosse, J., de Suduiraut, I. G., Zanoletti, O., & Sandi, C. (2018) · Physiology & Behavior · doi:10.1016/j.physbeh.2018.01.008 · Cited by 24
The Neural Circuit Architecture of Social Hierarchy in Rodents and Primates
Ferreira‐Fernandes, E., & Peça, J. (2022) · Frontiers in Cellular Neuroscience · doi:10.3389/fncel.2022.874310 · Cited by 22
Group housing and social dominance hierarchy affect circadian activity patterns in mice
Robbers, Y., Tersteeg, M. M. H., Meijer, J. H., & Coomans, C. P. (2021) · Royal Society Open Science · doi:10.1098/rsos.201985 · Cited by 24
Barabas, A. J., Lucas, J. R., Erasmus, M. A., Cheng, H. W., & Gaskill, B. N. (2021) · Frontiers in Veterinary Science · doi:10.3389/fvets.2021.695948 · Cited by 26
“It is often used as a measure of sociability toward stranger mice and has been considered a neutral exploratory behavior (37–39), but recent work has shown it to be predictive of aggression (9) and at the group level, it correlates with aggressive behavior (21).”
BackgroundResultInfluentialAlonso, L., Peeva, P., Stasko, S., Bäder, M., Alenina, N. V., Winter, Y., & Rivalan, M. (2023) · iScience · doi:10.1016/j.isci.2023.105998 · Cited by 22
Collier, M. A., Albery, G. F., McDonald, G. C., & Bansal, S. (2022) · Proceedings of the Royal Society B Biological Sciences · doi:10.1098/rspb.2022.1389 · Cited by 20
“For instance, when analysing contact types in mice (Mus musculus), researchers found that agonistic, grooming and sniffing events were associated with distinct network properties such as density, average path length and node centrality [12].”
BackgroundGoffe, A. S., Fischer, J., & Sennhenn-Reulen, H. (2018) · Methods in Ecology and Evolution · doi:10.1111/2041-210x.13072 · Cited by 19
Hearing, touching, and multisensory integration during mate choice
Lenschow, C., Mendes, A. R. P., & Lima, S. Q. (2022) · Frontiers in Neural Circuits · doi:10.3389/fncir.2022.943888 · Cited by 17
“, 2022) as neural correlates for social hierarchy as the dominance level, for instance, was reflected in the gene expression of corticotropin releasing factor (So et al., 2015) in the medial amygdala.”
BackgroundMultidimensional nature of dominant behavior: Insights from behavioral neuroscience
Murlanova, K., Kirby, M., Libergod, L., Pletnikov, M. V., & Pinhasov, A. (2021) · Neuroscience & Biobehavioral Reviews · doi:10.1016/j.neubiorev.2021.12.015 · Cited by 17
Evolutionary and biomedical implications of sex differences in the primate brain transcriptome
DeCasien, A. R., Chiou, K. L., Testard, C., Mercer, A., Valle, J. E. N.-D., Bauman, S. E., González, O., Stock, M. K., Ruiz-Lambides, A. V., Martínez, M. I., et al. (2024) · Cell Genomics · doi:10.1016/j.xgen.2024.100589 · Cited by 17
“97 Here, dominance rank reflects the direction and outcome of win-loss agonistic interactions (e.g., aggression, threats, displacements, submissions) recorded during focal animal samples or during ad libitum observations.”
Reilly, M. P., Weeks, C. D., Crews, D. P., & Gore, A. C. (2018) · Journal of comparative psychology · doi:10.1037/com0000103 · Cited by 16
“In particular, systems that allow for the automatic tracking of individual animals within a multianimal, free-roaming environment have provided unique insights into the social hierarchy organization in a mouse model (So et al., 2015; Weissbrod et al., 2013).”
A Multiparadigm Approach to Characterize Dominance Behaviors in CD1 and C57BL6 Male Mice
Cum, M., Pérez, J. A. S., Iwata, R. L., Lopez, N., Higgs, A., Li, A., Ye, C., Wangia, E., Wright, E. S., Restrepo, C. G., et al. (2024) · eNeuro · doi:10.1523/eneuro.0342-24.2024 · Cited by 20
“…inbred male C57BL/6 (C57) mice and outbred male CD1 mice because they are commonly used in social neuroscience studies (Varholick et al., 2021; Cum et al., 2024) and form stable linear hierarchies (Wang et al., 2011; So et al., 2015; Williamson et al., 2016; Zhou et al., 2017; W. Lee et al., 2022).”
Colin, T., Doums, C., Péronnet, R., & Molet, M. (2017) · Behavioral Ecology and Sociobiology · doi:10.1007/s00265-017-2322-4 · Cited by 15
Social status mediated variation in hypothalamic transcriptional profiles of male mice.
Lee, W., Dwortz, M., Milewski, T., Champagne, F., & Curley, J. (2022) · Hormones and Behavior · doi:10.1016/j.yhbeh.2022.105176 · Cited by 14
Self-citationGhahramani, Z. N., Timothy, M., Varughese, J., Sisneros, J. A., & Forlano, P. M. (2018) · Brain Research · doi:10.1016/j.brainres.2018.09.014 · Cited by 17
“The null hypothesis under QAP entails no association between the two matrices being compared, hence an insignificant p-value indicates that they are different (Roleira et al., 2017; So et al., 2015; Teles et al., 2015).”
Trade-offs between fighting and breeding: a social network analysis of bison male interactions
Wyman, M. T., Pinter‐Wollman, N., & Mooring, M. S. (2020) · Journal of Mammalogy · doi:10.1093/jmammal/gyaa172 · Cited by 14
“There is growing use of social network analysis to quantify the dominance relationships in social species, especially when dominance relationships are nonlinear, because the formation of dominance relationships is more nuanced than previously believed (Chase et al. 2002; So et al. 2015).”
Stress Varies Along the Social Density Continuum
Love, J., & Zelikowsky, M. (2020) · Frontiers in Systems Neuroscience · doi:10.3389/fnsys.2020.582985 · Cited by 15
“Work that incorporates network science approaches to understand the effects of social density and social connectivity on the brain and behavior are likely to significantly advance the field (e.g., So et al., 2015; Williamson et al., 2016).”
BackgroundAlonso, L., Peeva, P., Ramos-Prats, A., Alenina, N. V., Winter, Y., & Rivalan, M. (2019) · Behavioural Brain Research · doi:10.1016/j.bbr.2019.112188 · Cited by 13
Ferrara, N. C., Trask, S., Ritger, A. C., Padival, M., & Rosenkranz, J. A. (2022) · Frontiers in Behavioral Neuroscience · doi:10.3389/fnbeh.2022.956102 · Cited by 11
“Further, individual differences in fighting and chase versus investigation-like behaviors contribute to dynamic social hierarchies, highlighting the importance of individual differences and perhaps a balance in these behaviors that may promote shifts in social preference (So et al., 2015).”
BackgroundWritten informed consent in health research is outdated
Broekstra, R., Maeckelberghe, E. L. M., & Stolk, R. P. (2016) · European Journal of Public Health · doi:10.1093/eurpub/ckw198 · Cited by 12
How can ethology inform the neuroscience of fear, aggression and dominance?
Battivelli, D., Fan, Z., Hu, H., & Gross, C. T. (2024) · Nature reviews. Neuroscience · doi:10.1038/s41583-024-00858-2 · Cited by 11
Rivalan, M., Alonso, L., Mosienko, V., Bey, P., Hyde, A., Bäder, M., Winter, Y., & Alenina, N. V. (2024) · Frontiers in Behavioral Neuroscience · doi:10.3389/fnbeh.2024.1450540 · Cited by 11
The impact of cage dividers on mouse aggression, dominance and hormone levels
Streiff, C., Herrera, A., Voelkl, B., Palme, R., Würbel, H., & Novak, J. (2024) · PLoS ONE · doi:10.1371/journal.pone.0297358 · Cited by 10
“To cope with enforced proximity with conspecifics and to avoid escalated aggression [2], both male and female mice form dominance hierarchies [3, 4].”
BackgroundHonorio, R., Châline, N., & Chameron, S. (2019) · Animal Behaviour · doi:10.1016/j.anbehav.2019.09.007 · Cited by 10
“In our study, following the guidelines of 209 Glickman (1999; and see So et al., 2015), we used a value of 1 for ‘c’.”
MethodThönnes, M., Prause, R., Levavi‐Sivan, B., & Pfennig, F. (2022) · PLoS ONE · doi:10.1371/journal.pone.0268140 · Cited by 9
“Most studies focusing on gene expression in social phenomena like dominance have looked at the brain as a whole [55, 56, 75, 80].”
BackgroundThe genomic case against genetic determinism
Robinson, G. E., Bliss, R., & Hudson, M. E. (2024) · PLoS Biology · doi:10.1371/journal.pbio.3002510 · Cited by 9
Krüppel-homologue 1 Mediates Hormonally Regulated Dominance Rank in a Social Bee
Pandey, A., & Bloch, G. (2021) · Biology · doi:10.3390/biology10111188 · Cited by 9
Tsuda, M. C., Nagata, K., Sagoshi, S., & Ogawa, S. (2018) · Integrative Zoology · doi:10.1111/1749-4877.12343 · Cited by 9
Shaping the development of complex social behavior
Curley, J. P., & Champagne, F. A. (2023) · Annals of the New York Academy of Sciences · doi:10.1111/nyas.15076 · Cited by 7
Self-citationCollective Housing of Mice of Different Age Groups before Maturity Affects Mouse Behavior
Ueno, H., Suemitsu, S., Murakami, S., Kitamura, N., Wani, K., Takahashi, Y., Matsumoto, Y., Okamoto, M., & Ishihara, T. (2020) · Behavioural Neurology · doi:10.1155/2020/6856935 · Cited by 8
“An advantage hierarchy based on combat and tracking has been identified in this context, and the hostile relationships of these mice were organized [39].”
BackgroundMarkov-Modulated Hawkes Processes for Sporadic and Bursty Event OccurrencesPreprint
Wu, J., Ward, O. G., Curley, J. P., & Zheng, T. (2019) · arXiv (Cornell University) · doi:10.48550/arxiv.1903.03223 · Cited by 8
“Given a set of fights among a group of mice, one can calculate the win/loss matrix, which is a frequency sociomatrix of wins and losses (So et al., 2015).”
BackgroundSelf-citationMilewski, T. M., Lee, W., Young, R. L., Hofmann, H. A., & Curley, J. P. (2025) · PLoS Genetics · doi:10.1371/journal.pgen.1011548 · Cited by 7
Self-citationInduction of territorial dominance and subordination behaviors in laboratory mice
Battivelli, D., Boldrini, L., Jaiswal, M., Patil, P., Torchia, S., Engelen, E., Spagnoletti, L., Kaspar, S., & Gross, C. T. (2024) · Scientific Reports · doi:10.1038/s41598-024-75545-4 · Cited by 9
A social switch: daylength drives meadow vole group dynamics in automatically tracked habitats
Power, K. C., Lee, N. S., Rendon-Torres, K., Soergel, D. A. W., & Beery, A. K. (2025) · Animal Behaviour · doi:10.1016/j.anbehav.2025.123084 · Cited by 6
Wu, J., Ward, O. G., Curley, J. P., & Zheng, T. (2022) · The Annals of Applied Statistics · doi:10.1214/21-aoas1539 · Cited by 6
“Given a set of fights among a group of mice, one can calculate the win/loss matrix, which is a frequency sociomatrix of wins and losses (So et al., 2015).”
BackgroundSelf-citationMigliaro, M., Sánchez‐Zavaleta, R., Soto‐Tinoco, E., Ruiz‐Contreras, A. E., Méndez‐Díaz, M., Herrera-Solís, A., de la Mora, M. P., & Prospero-Garcia, O. E. (2022) · Pharmacology Biochemistry and Behavior · doi:10.1016/j.pbb.2022.173483 · Cited by 6
Meloni, E. G., Carlezon, W. A., & Bolshakov, V. Y. (2024) · Scientific Reports · doi:10.1038/s41598-024-59459-9 · Cited by 7
Ghahramani, Z. N., Perelmuter, J. T., Varughese, J., Kyaw, P., Palmer, W. C., Sisneros, J. A., & Forlano, P. M. (2022) · Behavioural Brain Research · doi:10.1016/j.bbr.2022.113745 · Cited by 4
“The null hypothesis under QAP entails no association between the two matrices being compared, hence an insignificant p-value indicates that they are different [42,57 – 60].”
BackgroundMethodHiadlovská, Z., Hamplová, P., Berchová‐Bímová, K., Macholán, M., & Bímová, B. V. (2021) · Behavioural Processes · doi:10.1016/j.beproc.2021.104316 · Cited by 5
Guilherme, M. D. S., Tsoutsouli, T., Todorov, H., Teifel, S., Nguyen, V. T. T., Gerber, S., & Endres, K. (2021) · Frontiers in Cell and Developmental Biology · doi:10.3389/fcell.2021.705986 · Cited by 5
“Another example is the higher mRNA expression of CRF in the medial amygdala and hypothalamus of more dominant outbred CD1 male mice (So et al., 2015).”
BackgroundHou, W., Ma, H., Huang, C., Yin, L., Li, L., Zhang, L., Qu, Y., Xun, Y., Yang, Q., He, Z., et al. (2024) · Hormones and Behavior · doi:10.1016/j.yhbeh.2024.105536 · Cited by 4
Differential expression of Hdac2 in male and female mice of differing social status
Douglas, R. S., Hartley, M. R., Yang, J., & Franklin, T. B. (2023) · Physiology & Behavior · doi:10.1016/j.physbeh.2023.114406 · Cited by 5
Conspecific interactions predict social transmission of fear in female rats
Seese, S., Tinsley, C. E., Wulffraat, G. C., Hixon, J. G., & Monfils, M. (2024) · Scientific Reports · doi:10.1038/s41598-024-58258-6 · Cited by 5
Han, M., Luo, H., Bai, Y., Zheng, S., Li, F., Fu, J., Jiang, S., Liu, Z., & Zheng, X. (2019) · Stress · doi:10.1080/10253890.2019.1702642 · Cited by 4
“…could not discriminate the specific “nature” of the “active social interactions”, e.g. the affiliative social behaviors (such as sniffing, crawling and following) and agonistic behaviors (such as fighting), the time engaged in these two kinds of behaviors was calculated manually (So et al., 2015).”
BackgroundGrossel, L. A., Javorouski, M. L., Moreira, N., & Monteiro‐Filho, E. L. A. (2021) · acta ethologica · doi:10.1007/s10211-021-00386-7 · Cited by 4
BlueBerry: Closed-loop wireless optogenetic manipulation in freely moving animalsPreprint
Nourizonoz, A., Girard, B. J. T., Guyoton, M., Galiñanes, G. L., Thurnherr, R., Pellat, S., Bellone, C., & Huber, D. (2025) · eLife · doi:10.1101/2025.01.30.635697 · Cited by 5
“Characterized by dominance and submission relationships, they influence social interactions, often presented as asymmetric agonistic behaviors such as chasing and aggression (Wang et al. 2011; So et al. 2015).”
Metadata
- Authors
- So, N., Franks, B., Lim, S., & Curley, J. P.
- Affiliations
- Columbia University (US)
- University of British Columbia (CA)
- Corresponding author
- Curley, James P.
- Venue
- PLOS ONE
- Publisher
- Public Library of Science (PLoS)
- Published
- 2015-07-30
- Volume
- 10
- Issue
- 7
- Pages
- e0134509
- ISSN
- 1932-6203 (ISSN-L)
- PMC
- PMC4520683
- OpenAlex
- W1852628838
- Cited by
- 135
- References
- 114
- Citations by year
- 2026: 6 · 2025: 10 · 2024: 15 · 2023: 10 · 2022: 17 · 2021: 17 · 2020: 14 · 2019: 15 · 2018: 16 · 2017: 6 · 2016: 9
- FWCI
- 16.91
- Type
- journal article
- Language
- en
- Open access
- gold
- doi.org
- Licence
- Locations
- PLoS ONE (publishedVersion, cc-by)
- Europe PMC (PubMed Central) (publishedVersion, cc-by)
- PubMed Central (publishedVersion, cc-by)
- PubMed (publishedVersion)
- DOAJ (DOAJ: Directory of Open Access Journals) (submittedVersion, cc-by-sa)
- Figshare (submittedVersion, cc-by)
- Columbia Academic Commons (Columbia University)
- Topics
- Life Sciences › Neuroscience › Endocrine and Autonomic Systems › Neuroendocrine regulation and behavior
- Life Sciences › Agricultural and Biological Sciences › Ecology, Evolution, Behavior and Systematics › Primate Behavior and Ecology
- Life Sciences › Agricultural and Biological Sciences › Ecology, Evolution, Behavior and Systematics › Animal Behavior and Reproduction
- Keywords
- social dominance, dominance hierarchy, social network analysis, mouse social behavior, ICR mice, grooming, sniffing, agonistic behavior, corticotropin-releasing factor, amygdala, medial preoptic area, hippocampus, glucocorticoid receptor, brain-derived neurotrophic factor, gene expression
- MeSH terms
- Animals, Brain, Gene Expression Regulation, Male, Social Behavior, Social Dominance, Mice, Real-Time Polymerase Chain Reaction
About these checks
Registry, retraction, Cites and statistics results are computed, not judged, with one exception: a printed reference that no index lists is read once by a model before it counts as a citation error. Claims are extracted by a model and kept only when their quote appears verbatim in the text; each cited source is then checked, with a model’s help, for whether it says what the claim relies on. Those verdicts can be wrong — read the claim’s quote and the cited source before relying on one.
Statistics and arithmetic are recomputed, not judged.
Confidence bands are shown only for fields calibrated on our annotated test set. None is calibrated yet, so no band is shown.
What counts as a claim ›How we measure confidence ›How we check this ›
Are you an author, or do you see a problem with this page? Request a review
