

The DOI matches its Crossref record; 90 of the 90 references it cites were found in a registry or an index.
Modelling the Geographical Origin of Rice Cultivation in Asia Using the Rice Archaeological Database
Open accessAbstract
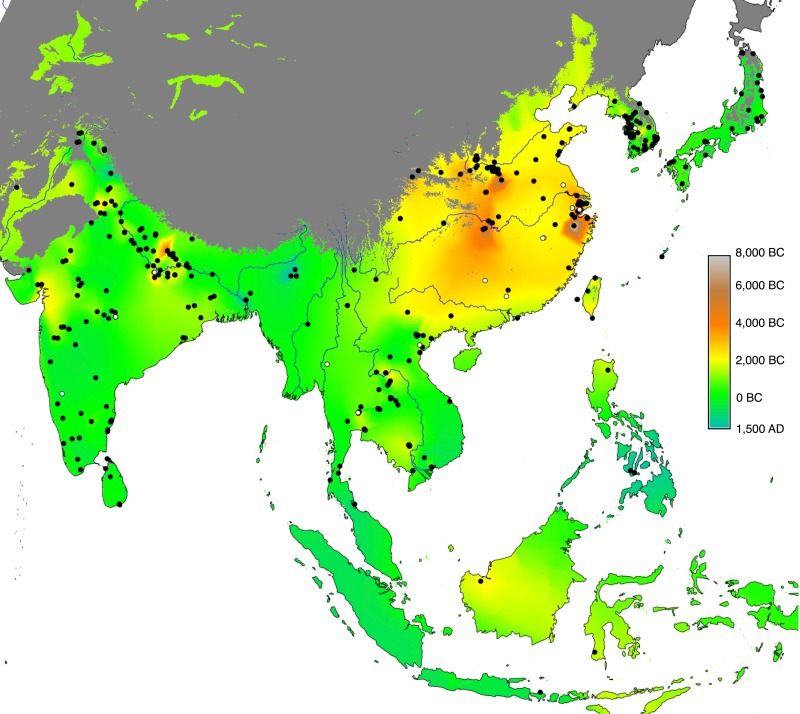
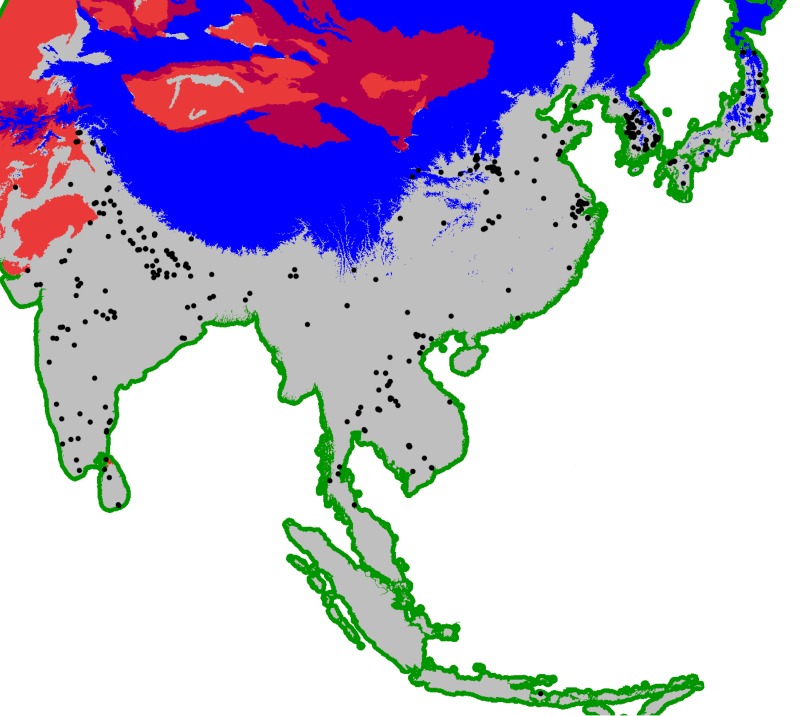
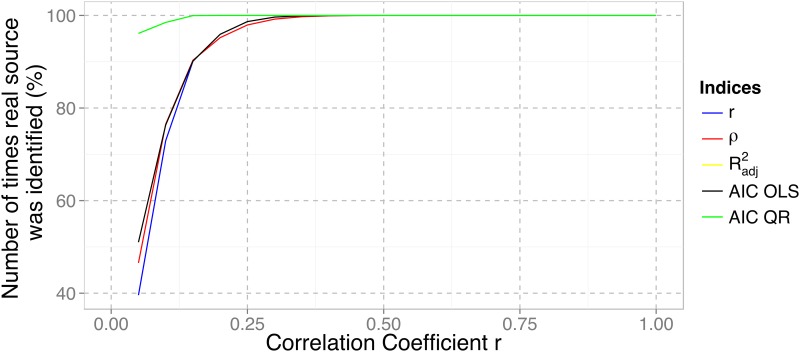
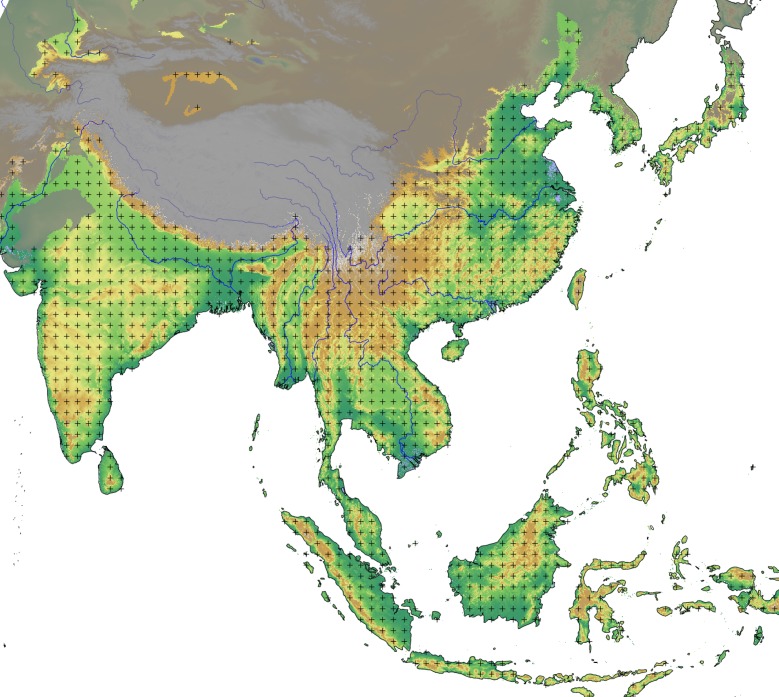
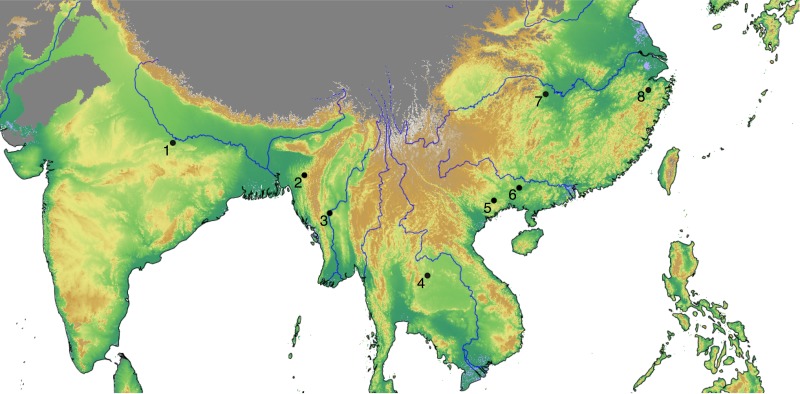
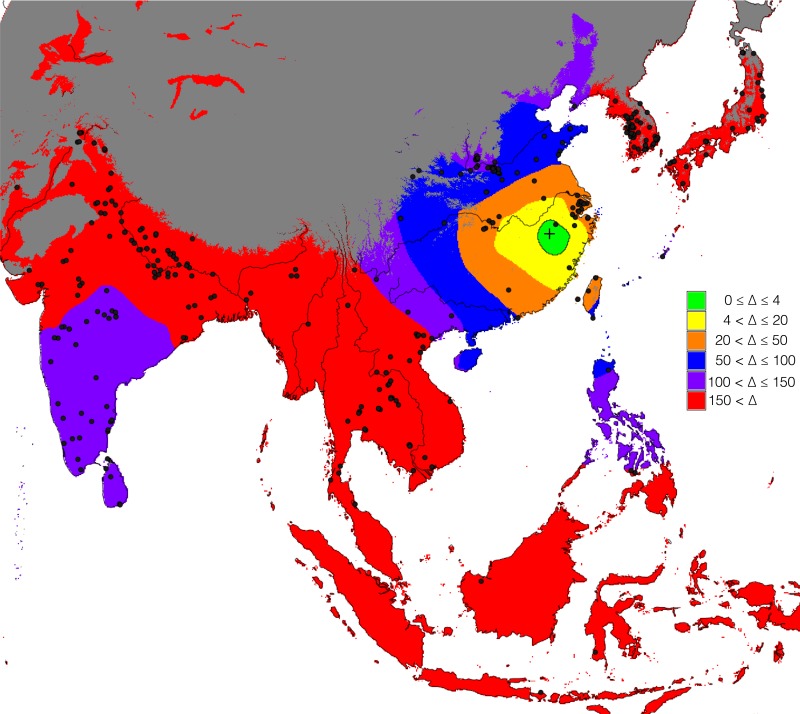
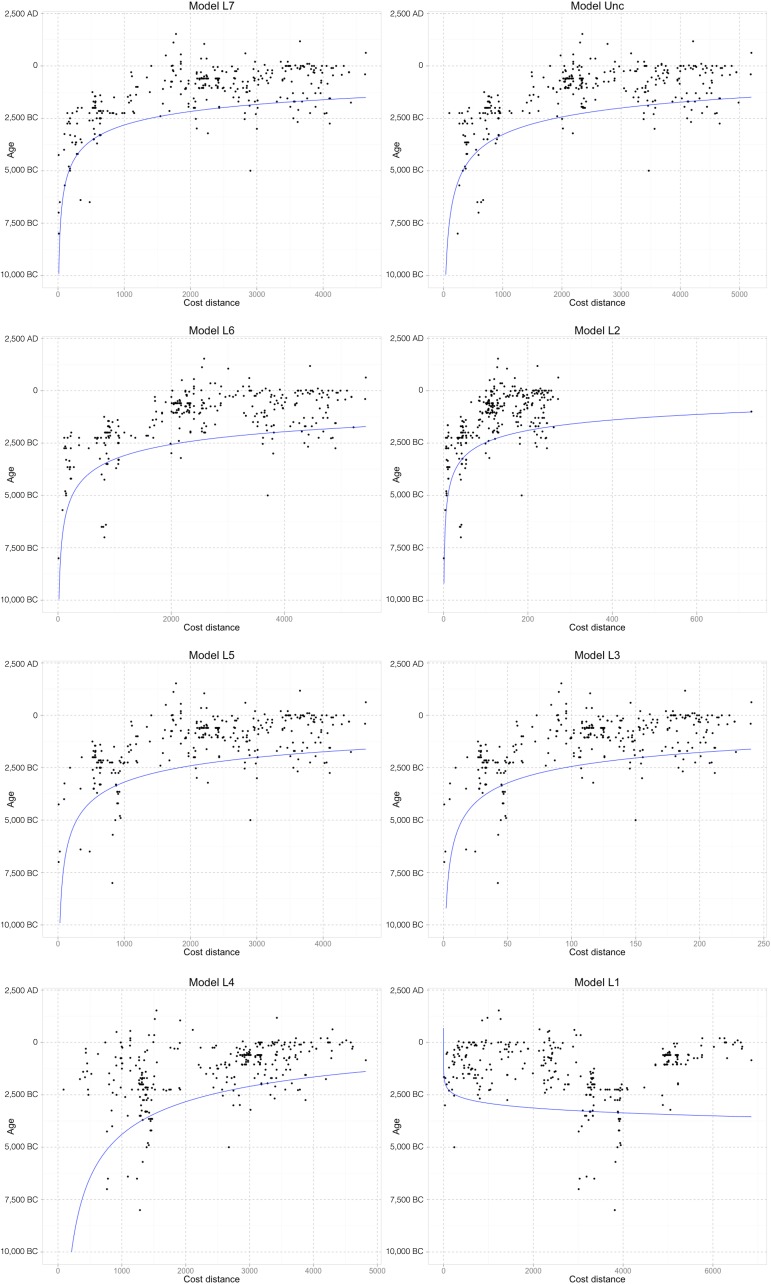
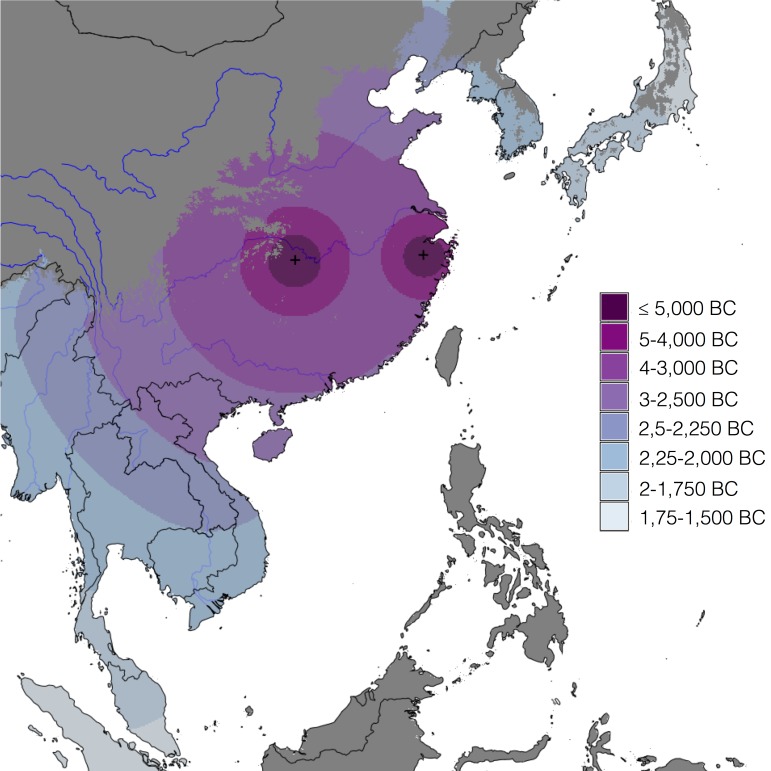
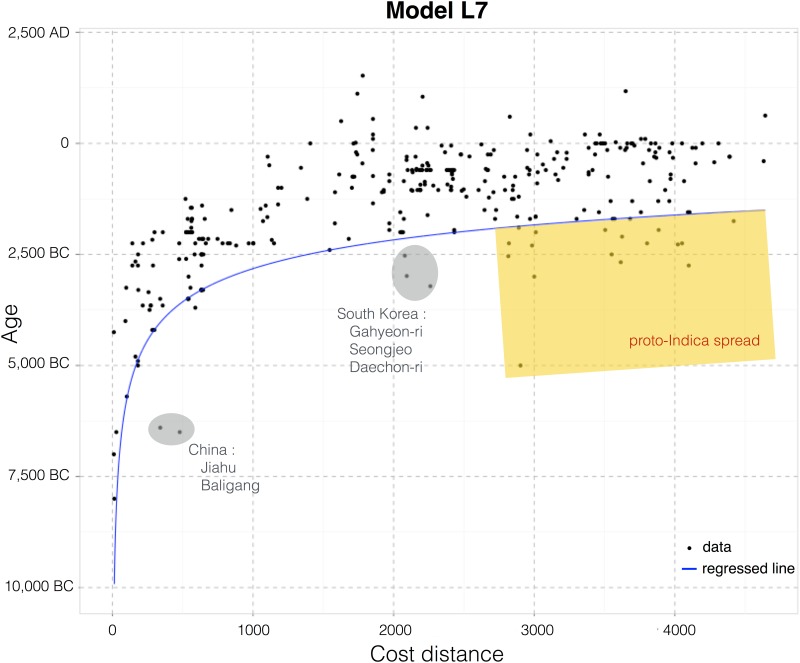
We have compiled an extensive database of archaeological evidence for rice across Asia, including 400 sites from mainland East Asia, Southeast Asia and South Asia. This dataset is used to compare several models for the geographical origins of rice cultivation and infer the most likely region(s) for its origins and subsequent outward diffusion. The approach is based on regression modelling wherein goodness of fit is obtained from power law quantile regressions of the archaeologically inferred age versus a least-cost distance from the putative origin(s). The Fast Marching method is used to estimate the least-cost distances based on simple geographical features. The origin region that best fits the archaeobotanical data is also compared to other hypothetical geographical origins derived from the literature, including from genetics, archaeology and historical linguistics. The model that best fits all available archaeological evidence is a dual origin model with two centres for the cultivation and dispersal of rice focused on the Middle Yangtze and the Lower Yangtze valleys.
Overview
The claims and statistics of this paper haven’t been checked yet.
Run the check — free, no account needed. It reads the open-access text and checks the sources it cites.
Integrity signals
Registry
Cites
Statistics
Figures
Verification
Claims the paper makes
The claims and statistics of this paper haven’t been checked yet.
Run the check — free, no account needed. It reads the open-access text and checks the sources it cites.
Claims other papers make about this one
Each is checked against this paper’s own text: does it say what the citing paper says it does?
The source backs part of the claim, not all of it — or backs it for a different population, condition or comparison.
In the citing paper
“An analysis of the material culture (including pottery decoration) associated with these agriculturalists suggests that rice and millet cultivating communities dispersed from the Yangtze valley (89–92) into southern China, where they arrived by the mid-third millennium BCE (90, 93). From there, they continued into peninsular Southeast Asia, where people following distinct dispersal pathways emph”
From The biocultural origins and dispersal of domestic chickens (2022) · cites this paper as [90]
Experimental — accuracy not yet measured
Self-check
Percentages, sums and reported differences re-computed from the paper’s own numbers.
The self-check needs the paper’s full text.
Citations
Cites
R: A Language and Environment for Statistical Computing
R Core Team (2000) · doi:10.32614/r.manuals · Cited by 355,893
Model selection and multimodel inference: a practical information-theoretic approach.
Guthery, F. S., Burnham, K. P., & Anderson, D. R. (2003) · The Journal of Wildlife Management · doi:10.2307/3802723 · Cited by 41,495
Very high resolution interpolated climate surfaces for global land areas
Hijmans, R. J., Cameron, S. E., Parra, J. L., Jones, P. G., & Jarvis, A. (2005) · International Journal of Climatology · doi:10.1002/joc.1276 · Cited by 19,860
Terrestrial ecoregions of the world: a new map of life on Earth
Olson, D. M., Dinerstein, E., Wikramanayake, E. D., Burgess, N. D., Powell, G. V. N., Underwood, E. C., D'amico, J. A., Itoua, I., Strand, H. E., Morrison, J. C., et al. (2001) · BioScience · doi:10.1641/0006-3568(2001)051[0933:teotwa]2.0.co;2 · Cited by 8,488
Koenker, R. W. (2005) · Cambridge University Press eBooks · doi:10.1017/cbo9780511754098 · Cited by 4,956
The art of not being governed: an anarchist history of upland Southeast Asia
(2010) · Choice Reviews Online · doi:10.5860/choice.47-6429 · Cited by 3,940
A fast marching level set method for monotonically advancing fronts.
Sethian, J. A. (1996) · Proceedings of the National Academy of Sciences · doi:10.1073/pnas.93.4.1591 · Cited by 3,345
Model selection and multimodel inference : a practical information-theoretic approach
Burnham, K. P., Anderson, D. R., & Burnham, K. P. (2002) · Thammasat University Digital Collections · Cited by 2,907
A statistical approach to some basic mine valuation problems on the Witwatersrand
Krige, D. G. (1951) · Journal of the Southern African Institute of Mining and Metallurgy · Cited by 2,409
Information theory as an extension of the maximum likelihood principle
Akaike, H. (1973) · Medical Entomology and Zoology · Cited by 2,357
Research works printed but not linked: 3
- H Akaike, 1973, Second International Symposium on Information Theory, 267
- AWF Edwards, 1992, Expanded edition
- PJ Ribeiro Jr, 2001, geoR: a package for geostatistical analysis, R-NEWS, 1, 15
Cited by
Sorted by citations
Stevens, C. J., Murphy, C., Roberts, R., Lucas, L., Silva, F., & Fuller, D. Q. (2016) · The Holocene · doi:10.1177/0959683616650268 · Cited by 303
Self-citationAncient crops provide first archaeological signature of the westward Austronesian expansion
Crowther, A., Lucas, L., Helm, R., Horton, M., Shipton, C., Wright, H. T., Walshaw, S., Pawlowicz, M., Radimilahy, C., Douka, K., et al. (2016) · Proceedings of the National Academy of Sciences · doi:10.1073/pnas.1522714113 · Cited by 288
Self-citationGenomic history and ecology of the geographic spread of rice
Gutaker, R. M., Groen, S. C., Bellis, E. S., Choi, J. Y., Pires, I. S., Bocinsky, R. K., Slayton, E. R., Wilkins, O., Castillo, C., Negrão, S., et al. (2020) · Nature Plants · doi:10.1038/s41477-020-0659-6 · Cited by 285
Self-citationZuo, X., Lü, H., Jiang, L., Zhang, J., Yang, X., Huan, X., He, K., Wang, C., & Wu, N. (2017) · Proceedings of the National Academy of Sciences · doi:10.1073/pnas.1704304114 · Cited by 251
The rice paradox: Multiple origins but single domestication in Asian rice
Choi, J. Y., Platts, A. E., Fuller, D. Q., Hsing, Y.-I., Wing, R. A., & Purugganan, M. D. (2017) · Molecular Biology and Evolution · doi:10.1093/molbev/msx049 · Cited by 246
Self-citationZakaria, Z., Zulkafflee, N. S., Redzuan, N. A. M., Selamat, J., Ismail, M. R., Praveena, S. M., Tóth, G., & Razis, A. F. A. (2021) · Plants · doi:10.3390/plants10061070 · Cited by 220
Fan, Y., Zhu, T., Li, M., He, J., & Huang, R. (2017) · Journal of Healthcare Engineering · doi:10.1155/2017/4124302 · Cited by 190
Crema, E. R., Habu, J., Kobayashi, K., & Madella, M. (2016) · PLOS ONE · doi:10.1371/journal.pone.0154809 · Cited by 178
Historical baselines in marine bioinvasions: Implications for policy and management
Ojaveer, H., Galil, B. S., Carlton, J. T., Alleway, H., Goulletquer, P., Lehtiniemi, M., Marchini, A., Miller, W., Occhipinti-Ambrogi, A., Peharda, M., et al. (2018) · PLOS ONE · doi:10.1371/journal.pone.0202383 · Cited by 184
Silva, L. A. D., Doyenart, R., Salvan, P. H., Rodrigues, W., Lopes, J. F. D. S., Gomes, K., Thirupathi, A., Pinho, R. A., & Silveira, P. C. L. (2019) · International Journal of Environmental Health Research · doi:10.1080/09603123.2019.1612041 · Cited by 186
The Role of microRNAs in Ovarian Granulosa Cells in Health and Disease
Tu, J., Cheung, H., Chan, C. L. K., & Chan, W. (2019) · Frontiers in Endocrinology · doi:10.3389/fendo.2019.00174 · Cited by 152
The biocultural origins and dispersal of domestic chickens
Peters, J., Lebrasseur, O., Irving-Pease, E. K., Paxinos, P. D., Best, J., Smallman, R., Callou, C., Gardeisen, A., Trixl, S., Frantz, L., et al. (2022) · Proceedings of the National Academy of Sciences · doi:10.1073/pnas.2121978119 · Cited by 149
“0 (90), with newly added archaeological records and cleaned reports with associated dates that appear too early based on current under-”
BackgroundSelf-citationPrehistoric evolution of the dualistic structure mixed rice and millet farming in China
He, K., Lü, H., Zhang, J., Wang, C., & Huan, X. (2017) · The Holocene · doi:10.1177/0959683617708455 · Cited by 136
Geographic mosaics and changing rates of cereal domestication
Allaby, R. G., Stevens, C. J., Lucas, L., Maeda, O., & Fuller, D. Q. (2017) · Philosophical Transactions of the Royal Society B Biological Sciences · doi:10.1098/rstb.2016.0429 · Cited by 127
Self-citationThe spread of agriculture in eastern Asia
Stevens, C. J., & Fuller, D. Q. (2017) · Language Dynamics and Change · doi:10.1163/22105832-00702001 · Cited by 127
Self-citationGeospatial Big Data and archaeology: Prospects and problems too great to ignore
McCoy, M. D. (2017) · Journal of Archaeological Science · doi:10.1016/j.jas.2017.06.003 · Cited by 99
Martello, R. D., Min, R., Stevens, C. J., Higham, C. F., Higham, T., Qin, L., & Fuller, D. Q. (2018) · Journal of Archaeological Science Reports · doi:10.1016/j.jasrep.2018.06.005 · Cited by 111
Self-citationDeng, Z., Hung, H., Carson, M. T., Bellwood, P. S., Yang, S.-L., & Lü, H. (2017) · Archaeological and Anthropological Sciences · doi:10.1007/s12520-017-0471-z · Cited by 109
Farming and the Trans-New Guinea family
Schapper, A. (2017) · John Benjamins Publishing Company eBooks · doi:10.1075/z.215.07sch · Cited by 108
New radiocarbon evidence on early rice consumption and farming in South China
Yang, X., Wang, W., Zhuang, Y., Li, Z., Ma, Z., Ma, Y., Cui, Y., Wei, J., & Fuller, D. Q. (2017) · The Holocene · doi:10.1177/0959683616678465 · Cited by 105
Self-citationHolocene coastal evolution preceded the expansion of paddy field rice farming
Ma, T., Rolett, B. V., Zheng, Z., & Zong, Y. (2020) · Proceedings of the National Academy of Sciences · doi:10.1073/pnas.1919217117 · Cited by 103
He, K., Lü, H., Zheng, Y., Zhang, J., Xu, D., Huan, X., Wang, J., & Shao, L. (2018) · Quaternary Science Reviews · doi:10.1016/j.quascirev.2018.03.034 · Cited by 97
A review on the spread of prehistoric agriculture from southern China to mainland Southeast Asia
Gao, Y., Dong, G., Yang, X., & Chen, F. (2020) · Science China Earth Sciences · doi:10.1007/s11430-019-9552-5 · Cited by 98
Why Rice Farmers Don’t Sail: Coastal Subsistence Traditions and Maritime Trends in Early China
Qin, L., & Fuller, D. Q. (2019) · The Archaeology of Asia-Pacific Navigation · doi:10.1007/978-981-32-9256-7_9 · Cited by 88
Self-citationZhao, L., Ma, C., Leipe, C., Long, T., Liu, K., Lu, H., Tang, L., Zhang, Y., Wagner, M., & Tarasov, P. E. (2017) · Palaeogeography Palaeoclimatology Palaeoecology · doi:10.1016/j.palaeo.2017.06.035 · Cited by 88
Lü, H. (2017) · Science China Earth Sciences · doi:10.1007/s11430-017-9145-2 · Cited by 81
Harrison, S. P., Gaillard, M., Stocker, B. D., Linden, M. V., Goldewijk, K. K., Boles, O. J. C., Braconnot, P., Dawson, A., Fluet‐Chouinard, E., Kaplan, J. O., et al. (2020) · Geoscientific model development · doi:10.5194/gmd-13-805-2020 · Cited by 84
Did foragers adopt farming? A perspective from the margins of the Tibetan Plateau
Guedes, J. D. (2017) · Quaternary International · doi:10.1016/j.quaint.2016.12.010 · Cited by 74
Ma, T., Tarasov, P. E., Zheng, Z., Han, A., & Huang, K. (2016) · The Holocene · doi:10.1177/0959683616641744 · Cited by 68
Yang, X., Chen, Q., Ma, Y., Li, Z., Hung, H., Zhang, Q., Jin, Z., Liu, S., Zhou, Z., & Fu, X. (2018) · 中国科学通报:英文版 · doi:10.1016/j.scib.2018.10.011 · Cited by 63
Pathways of rice diversification across Asia
Fuller, D. Q., Weisskopf, A. R., & Castillo, C. C. (2016) · Archaeology International · doi:10.5334/ai.1915 · Cited by 58
Self-citationBetween foraging and farming: strategic responses to the Holocene Thermal Maximum in Southeast Asia
Oxenham, M. F., Trinh, H. H., Willis, A., Jones, R. K., Domett, K., Castillo, C., Wood, R. E., Bellwood, P. S., Tromp, M., Kells, A., et al. (2018) · Antiquity · doi:10.15184/aqy.2018.69 · Cited by 54
Self-citationRiris, P., & Silva, F. (2021) · Humanities and Social Sciences Communications · doi:10.1057/s41599-021-00717-w · Cited by 50
Self-citationHunter-gatherer specialization in the late Neolithic of southern Vietnam – The case of Rach Nui
Castillo, C., Fuller, D. Q., Piper, P. J., Bellwood, P. S., & Oxenham, M. F. (2017) · Quaternary International · doi:10.1016/j.quaint.2016.11.034 · Cited by 51
Self-citationA Journey to the West: The Ancient Dispersal of Rice Out of East Asia
Spengler, R. N., Stark, S., Zhou, X., Fuks, D., Tang, L., Mir-Makhamad, B., Bjørn, R., Jiang, H., Olivieri, L. M., Begmatov, A., et al. (2021) · Rice · doi:10.1186/s12284-021-00518-4 · Cited by 50
He, K., Lü, H., Zheng, H., Yang, Q., Sun, G., Zheng, Y., Cao, Y., & Huan, X. (2020) · Quaternary Science Reviews · doi:10.1016/j.quascirev.2020.106456 · Cited by 41
Crema, E. R., Stevens, C. J., & Shoda, S. (2022) · bioRxiv (Cold Spring Harbor Laboratory) · doi:10.1101/2022.05.25.493375 · Cited by 40
Self-citationSilva, F., Weisskopf, A., Castillo, C., Murphy, C., Kingwell-Banham, E., Qin, L., & Fuller, D. Q. (2018) · The Holocene · doi:10.1177/0959683618788634 · Cited by 39
Self-citationWang, C., Lü, H., Zhang, J., Mao, L., & Ge, Y. (2019) · Frontiers in Plant Science · doi:10.3389/fpls.2019.01037 · Cited by 38
Weedy rice (Oryza spp.): what’s in a name?
Burgos, N. R., Sudo, M. P. S., Olsen, K. M., Werle, I. S., & Song, B. (2021) · Weed Science · doi:10.1017/wsc.2021.22 · Cited by 38
Dynamics of photosynthetic induction and relaxation within the canopy of rice and two wild relatives
Acevedo‐Siaca, L. G., Dionora, J., Laza, R. C., Quick, W. P., & Long, S. P. (2021) · Food and Energy Security · doi:10.1002/fes3.286 · Cited by 37
Neeraja, C. N., Kulkarni, K. S., Babu, P. M., Rao, D. S., Surekha, K., & Babu, V. R. (2018) · PLoS ONE · doi:10.1371/journal.pone.0192362 · Cited by 36
Nakabachi, A., Malenovský, I., Gjonov, I., & Hirose, Y. (2020) · Microbial Ecology · doi:10.1007/s00248-020-01491-z · Cited by 36
Zuo, X., Lü, H., Li, Z., Song, B., Xu, D., Zou, Y., Wang, C., Huan, X., & He, K. (2016) · Quaternary Research · doi:10.1016/j.yqres.2016.08.001 · Cited by 36
Barron, A., Turner, M., Beeching, L. J., Bellwood, P. S., Piper, P. J., Grono, E., Jones, R. K., Oxenham, M. F., Kiên, N. K. T., Senden, T. J., et al. (2017) · Scientific Reports · doi:10.1038/s41598-017-04338-9 · Cited by 35
Ya, X., Lai, F.-N., He, G., Li, Y., Yang, L., Shen, W., Huo, H., Zhu, J., Dai, H., & Zhang, Y. (2017) · PLoS ONE · doi:10.1371/journal.pone.0184033 · Cited by 35
Crema, E. R., Stevens, C. J., & Shoda, S. (2022) · Science Advances · doi:10.1126/sciadv.adc9171 · Cited by 34
Self-citationWeisskopf, A. R., Deng, Z., Qin, L., & Fuller, D. Q. (2015) · Archaeological Research in Asia · doi:10.1016/j.ara.2015.10.002 · Cited by 34
Self-citationGenome Analysis Traces Regional Dispersal of Rice in Taiwan and Southeast Asia
Alam, O., Gutaker, R. M., Wu, C., Hicks, K. A., Bocinsky, R. K., Castillo, C., Acabado, S. B., Fuller, D. Q., Guedes, J. D., Hsing, Y.-I. C., et al. (2021) · Molecular Biology and Evolution · doi:10.1093/molbev/msab209 · Cited by 34
Self-citationThe origins of agriculture in Iberia: a computational model
Pardo-Gordó, S., Aubán, J. B., Puchol, O. G., Barton, C. M., & Bergin, S. M. (2015) · Documenta Praehistorica · doi:10.4312/dp.42.7 · Cited by 30
Ishikawa, R., Castillo, C., & Fuller, D. Q. (2020) · Archaeological and Anthropological Sciences · doi:10.1007/s12520-020-01112-3 · Cited by 33
Self-citationKim, M. K., Kim, Y., Park, S.-H., Kim, E., Kim, Y., Kim, Y., & Kim, J. (2020) · Integrative Cancer Therapies · doi:10.1177/1534735420949678 · Cited by 31
Huang, T., Deng, Y., Zhang, X., Wu, D., Wang, X., & Huang, S. (2021) · Environmental Science and Pollution Research · doi:10.1007/s11356-021-15213-6 · Cited by 32
Landini, A., Yu, S., Gnecchi‐Ruscone, G. A., Abondio, P., Ojeda‐Granados, C., Sarno, S., Fanti, S. D., Gentilini, D., Blasio, A. M. D., Jin, H., et al. (2020) · Evolutionary Applications · doi:10.1111/eva.13090 · Cited by 33
Language Dispersal Beyond Farming
Societas Linguistica Europaea 2016 Naples, I., Robbeets, M., & Savelyev, A. (2017) · John Benjamins Publishing Company eBooks · doi:10.1075/z.215 · Cited by 27
Inland-coastal bifurcation of southern East Asians revealed by Hmong-Mien genomic historyPreprint
Xia, Z., Yan, S. L., Wang, C., Zheng, H.-X., Zhang, F., Liu, Y.-C., Yu, G., Yu, B.-X., Shu, L.-L., & Li, J. (2019) · bioRxiv (Cold Spring Harbor Laboratory) · doi:10.1101/730903 · Cited by 24
Adaptation and the Geographic Spread of Crop Species
Gutaker, R. M., & Purugganan, M. D. (2023) · Annual Review of Plant Biology · doi:10.1146/annurev-arplant-060223-030954 · Cited by 30
Social Complexity and Social Inequality in the Prehistoric Mediterranean
Leppard, T. P. (2019) · Current Anthropology · doi:10.1086/703174 · Cited by 25
Relationship between person's health beliefs and diabetes self-care management regimen
Albargawi, M., Snethen, J., Gannass, A. A., & Kelber, S. T. (2017) · Journal of Vascular Nursing · doi:10.1016/j.jvn.2017.07.002 · Cited by 25
First evidence of rice (Oryza cf. sativa L.) and black pepper (Piper nigrum) in Roman Mursa, Croatia
Reed, K., & Leleković, T. (2017) · Archaeological and Anthropological Sciences · doi:10.1007/s12520-017-0545-y · Cited by 24
Familiarity revealed by involuntary eye movements on the fringe of awareness
Rosenzweig, G., & Bonneh, Y. S. (2019) · Scientific Reports · doi:10.1038/s41598-019-39889-6 · Cited by 25
Shao, K., Zhang, J., Lü, H., Gu, Z., Xu, B., Zheng, H., Sun, G., Huan, X., He, K., Zou, Y., et al. (2021) · Geomorphology · doi:10.1016/j.geomorph.2021.107650 · Cited by 24
Ouyang, X., Hao, X., Zheng, L., Zhuo, B., & Liu, Y. (2019) · Quaternary International · doi:10.1016/j.quaint.2019.05.027 · Cited by 23
Edris, M., Ghasemi‐Varnamkhasti, M., Kiani, S., Yazdanpanah, H., & Izadi, Z. (2023) · Journal of Food Composition and Analysis · doi:10.1016/j.jfca.2023.105737 · Cited by 22
Yu, J., Yu, Y., Wu, H., Zhang, W., & Liu, H. (2021) · The Holocene · doi:10.1177/09596836211066605 · Cited by 21
Microfossil evidence of rice cultivation on the Southeast China Coast 7500 years ago
Zuo, X., Dai, J., Wu, W., Jin, J., Ge, W., Wang, Y., Ren, L., Lin, Y., Pei, Y., & Xie, H. (2022) · Science China Earth Sciences · doi:10.1007/s11430-022-9995-3 · Cited by 22
Evidence for Very Recent Positive Selection in Mongolians
Nakayama, K., Ohashi, J., Watanabe, K., Munkhtulga, L., & Iwamoto, S. (2017) · Molecular Biology and Evolution · doi:10.1093/molbev/msx138 · Cited by 21
The spread of domesticated rice in eastern and southeastern Asia was mainly demic
Cobo, J., Fort, J., & Isern, N. (2018) · Journal of Archaeological Science · doi:10.1016/j.jas.2018.12.001 · Cited by 21
Human adaptation to Holocene environments: Perspectives and promise from China
Berger, E., Brunson, K., Kaufman, B., Gyoung-Ah, L., Liu, X., Sebillaud, P., Storozum, M. J., Barton, L., Eng, J. T., Feinman, G. M., et al. (2021) · Journal of Anthropological Archaeology · doi:10.1016/j.jaa.2021.101326 · Cited by 20
The early adoption of East Asian crops in West Asia: rice and broomcorn millet in northern Iran
Huang, Y., Deng, Z., Nashli, H. F., Fuller, D. Q., Wu, X., & Safari, M. (2023) · Antiquity · doi:10.15184/aqy.2023.42 · Cited by 17
Self-citationQiu, Z., Zhuang, L., Rao, H., Lin, L., & Zhuang, Y. (2022) · Science China Earth Sciences · doi:10.1007/s11430-021-9885-x · Cited by 18
Lan, X., Li, J., Chen, J., Liu, J., Cao, F., Liao, C., Zhang, Z., Gu, M., Wei, Y., Shen, F., et al. (2022) · International Journal of Phytoremediation · doi:10.1080/15226514.2022.2066064 · Cited by 18
Singh, V. J., Bhowmick, P. K., Vinod, K. K., Krishnan, S. G., Nandakumar, S., Kumar, A., Kumar, M., Shekhawat, S., Dixit, B. K., Malik, A., et al. (2022) · Genes · doi:10.3390/genes13030484 · Cited by 17
Halperin, C. T. (2017) · American Anthropologist · doi:10.1111/aman.12860 · Cited by 17
Mursyidin, D. H., & Khairullah, I. (2020) · Biodiversitas Journal of Biological Diversity · doi:10.13057/biodiv/d211045 · Cited by 16
Neolithic Rice Cultivation and Consequent Landscape Changes at the Baodun Site, Southwestern China
Zhang, J., Lv, Y. H., Yu, L., Tang, M., Huang, M., Shao, K., Huan, X., Wen, C., Dong, Y., Ming, J., et al. (2021) · Frontiers in Earth Science · doi:10.3389/feart.2021.807626 · Cited by 15
Kallugudi, J., Singh, V. J., Vinod, K. K., Krishnan, S. G., Nandakumar, S., Dixit, B. K., Ellur, R. K., Bollinedi, H., Nagarajan, M., Kumar, A., et al. (2022) · Plants · doi:10.3390/plants11151930 · Cited by 15
He, K., Wang, Y., Zheng, Y., Sun, G., Shao, L., Li, Y., Yu, X., Zhang, J., & Lü, H. (2024) · Archaeological and Anthropological Sciences · doi:10.1007/s12520-024-01936-3 · Cited by 17
Cortell‐Nicolau, A., Puchol, O. G., Barrera-Cruz, M., & Rivero, D. G. (2021) · PLoS ONE · doi:10.1371/journal.pone.0261813 · Cited by 16
Wu, Y. P., Xie, G., Mao, L., Zhao, Z., & Belmaker, M. (2020) · Science China Earth Sciences · doi:10.1007/s11430-020-9640-3 · Cited by 14
Modelling the chronology and dynamics of the spread of Asian rice from ca. 8000 BCE to 1000 CE
Long, T., Chen, H., Leipe, C., Wagner, M., & Tarasov, P. E. (2021) · Quaternary International · doi:10.1016/j.quaint.2021.11.016 · Cited by 16
Potential millennial‐scale avian declines by humans in southern China
Dong, F., Zhang, Q., Chen, Y., Lei, F., Li, S., Wu, F., & Yang, X. (2022) · Global Change Biology · doi:10.1111/gcb.16289 · Cited by 14
Kuwayama, T., Nunome, M., Kinoshita, G., Abe, K., & Suzuki, H. (2017) · Biological Journal of the Linnean Society · doi:10.1093/biolinnean/blx076 · Cited by 14
Regional land cover changes of the last 6,500 years in middle and southern subtropical China
Wan, Q., Huang, K., Zhang, X., Yue, Y., Peng, H., Ma, T., Yang, X., & Zheng, Z. (2022) · Quaternary International · doi:10.1016/j.quaint.2022.04.009 · Cited by 15
Modeling Demic and Cultural Diffusion: An Introduction
Fort, J., Crema, E. R., & Madella, M. (2015) · Human Biology · doi:10.13110/humanbiology.87.3.0141 · Cited by 13
The Agriculture of Early India
Murphy, C., & Fuller, D. Q. (2017) · Oxford University Press eBooks · doi:10.1093/acrefore/9780199389414.013.169 · Cited by 13
Self-citationThe domestications and the domesticators of Asian rice
van Driem, G. L. (2017) · John Benjamins Publishing Company eBooks · doi:10.1075/z.215.08van · Cited by 12
Huan, X., Deng, Z., Xiang, J., & Lü, H. (2022) · The Holocene · doi:10.1177/09596836221101253 · Cited by 12
Herrera, R. J., & Garcia‐Bertrand, R. (2018) · Elsevier eBooks · doi:10.1016/b978-0-12-804124-6.00013-6 · Cited by 17
Pinto, C. E., Awade, M., Watanabe, M. T. C., de Brito, R. M., Costa, W. F., Maia, U. M., Imperatriz-Fonseca, V. L., & Giannini, T. C. (2020) · PLoS ONE · doi:10.1371/journal.pone.0238685 · Cited by 11
Dry or Wet? Evaluating the Initial Rice Cultivation Environment on the Korean Peninsula
Shoda, S., Nasu, H., Yamazaki, K., Murakami, N., Na, G. J., Ahn, S., & Yoneda, M. (2021) · Agronomy · doi:10.3390/agronomy11050929 · Cited by 10
Rice use history in Southeast China: Phytolith evidence from the Nanshan site in Fujian Province
Chen, Q., Zhao, L., Ma, Y., Zhou, Z., & Yang, X. (2023) · Science China Earth Sciences · doi:10.1007/s11430-021-1091-9 · Cited by 12
Pan, Y. (2023) · Frontiers in Earth Science · doi:10.3389/feart.2023.1180376 · Cited by 10
Dabrowski, V., Bouchaud, C., Tengberg, M., & Mouton, M. (2021) · Archaeological and Anthropological Sciences · doi:10.1007/s12520-021-01277-5 · Cited by 12
Alam, O., Gutaker, R. M., Surya, N., Castillo, C., Fuller, D. Q., Guedes, J. D., & Purugganan, M. D. (2025) · Proceedings of the National Academy of Sciences · doi:10.1073/pnas.2514614122 · Cited by 10
Self-citationMetal-Age maritime culture at Jareng Bori rockshelter, Pantar Island, eastern Indonesia
Hawkins, S., Arumdhati, F. S., Litster, M., Lim, T. S., Basile, G., Leclerc, M., Reepmeyer, C., Maloney, T., Boulanger, C., Louys, J., et al. (2020) · Records of the Australian Museum · doi:10.3853/j.2201-4349.72.2020.1726 · Cited by 9
Tian, F., Wang, Y., Chi, Z., Liu, J., Yang, H., Jiang, N., & Tang, W. (2017) · Review of Palaeobotany and Palynology · doi:10.1016/j.revpalbo.2017.03.003 · Cited by 8
吕, 厚. (2017) · SCIENTIA SINICA Terrae · doi:10.1360/n072017-00297 · Cited by 8
Fruit flies (Diptera: Tephritidae) in commercial mango orchards in a semiarid region of Brazil
de Sousa, M. M., Araújo, E. L., Silva, J. G., Barbosa, D. R. E. S., & Fernandes, E. C. (2019) · Revista Brasileira de Fruticultura · doi:10.1590/0100-29452019347 · Cited by 8
Rotunno, R., & Crema, E. R. (2025) · Nature Communications · doi:10.1038/s41467-025-63887-0 · Cited by 7
Metadata
- Authors
- Silva, F., Stevens, C. J., Weisskopf, A., Castillo, C., Qin, L., Bevan, A., & Fuller, D. Q.
- Affiliations
- University College London (GB)
- Peking University (CN)
- Venue
- PLOS ONE
- Publisher
- Public Library of Science (PLoS)
- Published
- 2015-09-01
- Volume
- 10
- Issue
- 9
- Pages
- e0137024
- ISSN
- 1932-6203 (ISSN-L)
- PMC
- PMC4556484
- OpenAlex
- W1825971118
- Cited by
- 146
- References
- 90
- Citations by year
- 2026: 10 · 2025: 6 · 2024: 5 · 2023: 10 · 2022: 17 · 2021: 19 · 2020: 18 · 2019: 12 · 2018: 10 · 2017: 28 · 2016: 8 · 2015: 3
- FWCI
- 12.39
- Type
- journal article
- Language
- en
- Open access
- gold
- doi.org
- Licence
- Locations
- PLoS ONE (publishedVersion, cc-by)
- Europe PMC (PubMed Central) (publishedVersion, cc-by)
- PubMed Central (publishedVersion, cc-by)
- PubMed (publishedVersion)
- Bournemouth University Research Online (Bournemouth University) (acceptedVersion)
- RePEc: Research Papers in Economics (submittedVersion)
- DOAJ (DOAJ: Directory of Open Access Journals) (submittedVersion, cc-by-sa)
- UCL Discovery (University College London) (submittedVersion)
- Funders
- Natural Environment Research Council (NE/G005540/1, NE/K003402/1, NRCF010002)
- FP7 Ideas: European Research Council (323842)
- Topics
- Social Sciences › Archeology › Archaeology and ancient environmental studies
- Life Sciences › Agricultural and Biological Sciences › Plant Science › Rice Cultivation and Yield Improvement
- Social Sciences › Anthropology › Pacific and Southeast Asian Studies
- Keywords
- rice cultivation, archaeological site, archaeobotany, power-law regression, fast marching method, East Asia, Southeast Asia, South Asia, crop domestication
- MeSH terms
- Archaeology, Asia, Geography, Models, Theoretical, Oryza, Databases, Factual
About these checks
Registry, retraction, Cites and statistics results are computed, not judged, with one exception: a printed reference that no index lists is read once by a model before it counts as a citation error. Claims are extracted by a model and kept only when their quote appears verbatim in the text; each cited source is then checked, with a model’s help, for whether it says what the claim relies on. Those verdicts can be wrong — read the claim’s quote and the cited source before relying on one.
Statistics and arithmetic are recomputed, not judged.
Confidence bands are shown only for fields calibrated on our annotated test set. None is calibrated yet, so no band is shown.
What counts as a claim ›How we measure confidence ›How we check this ›
Are you an author, or do you see a problem with this page? Request a review
