

The DOI matches its Crossref record; 95 of the 95 references it cites were found in a registry or an index.
Acute biphasic effects of ayahuasca.
Open accessAbstract
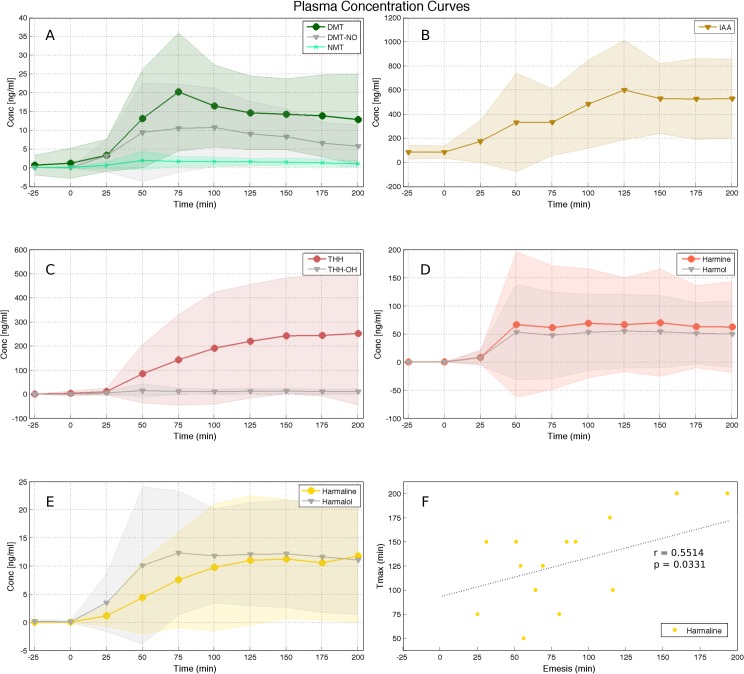
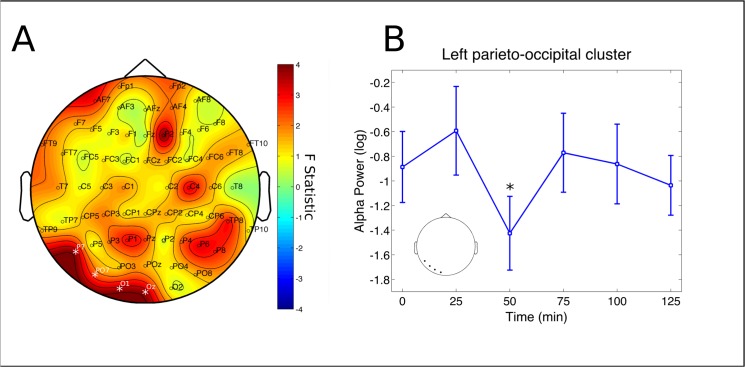
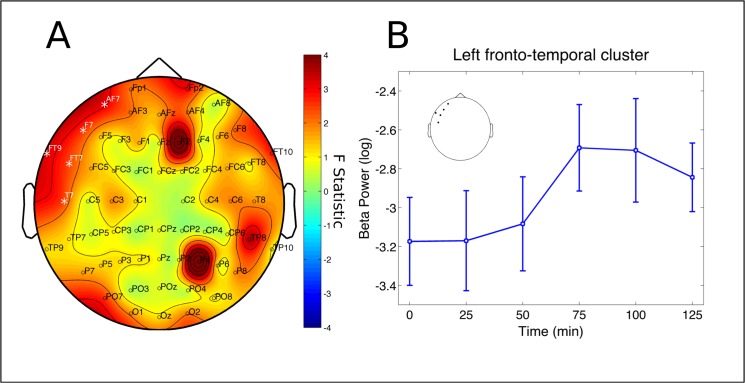
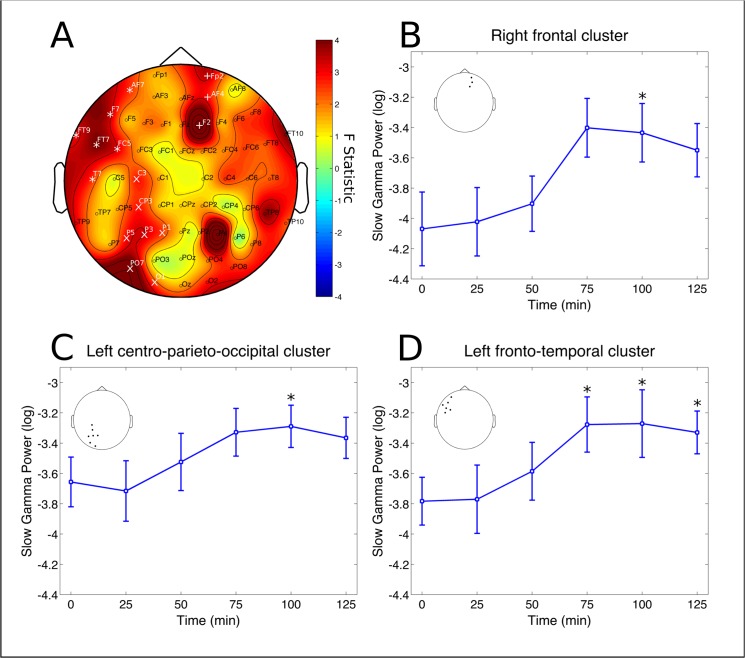
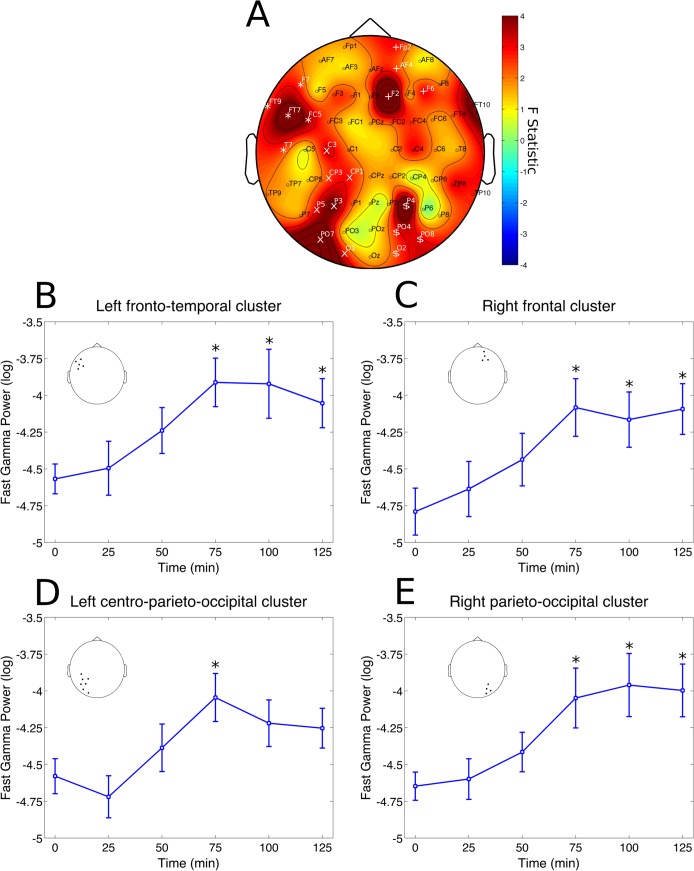
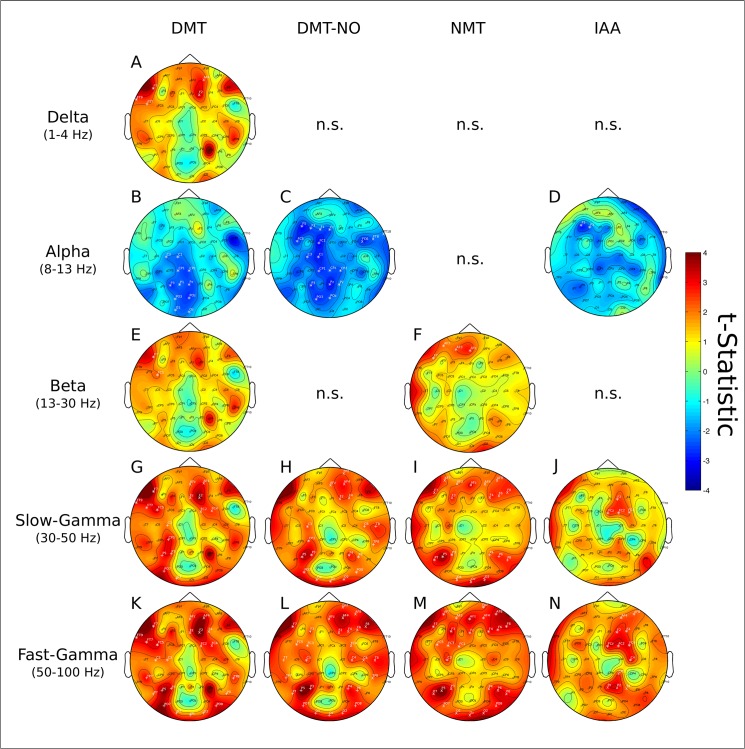
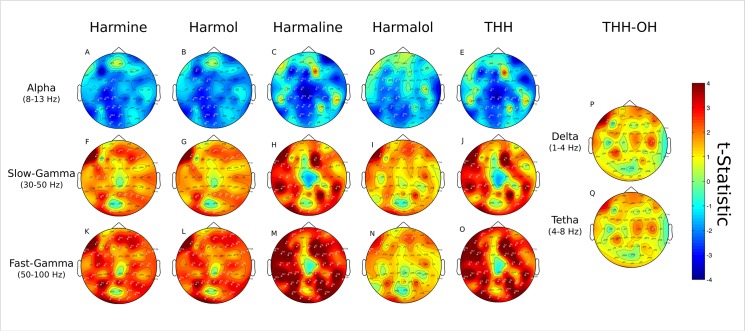
Ritual use of ayahuasca, an amazonian Amerindian medicine turned sacrament in syncretic religions in Brazil, is rapidly growing around the world. Because of this internationalization, a comprehensive understanding of the pharmacological mechanisms of action of the brew and the neural correlates of the modified states of consciousness it induces is important. Employing a combination of electroencephalogram (EEG) recordings and quantification of ayahuasca's compounds and their metabolites in the systemic circulation we found ayahuasca to induce a biphasic effect in the brain. This effect was composed of reduced power in the alpha band (8-13 Hz) after 50 minutes from ingestion of the brew and increased slow- and fast-gamma power (30-50 and 50-100 Hz, respectively) between 75 and 125 minutes. Alpha power reductions were mostly located at left parieto-occipital cortex, slow-gamma power increase was observed at left centro-parieto-occipital, left fronto-temporal and right frontal cortices while fast-gamma increases were significant at left centro-parieto-occipital, left fronto-temporal, right frontal and right parieto-occipital cortices. These effects were significantly associated with circulating levels of ayahuasca's chemical compounds, mostly N,N-dimethyltryptamine (DMT), harmine, harmaline and tetrahydroharmine and some of their metabolites. An interpretation based on a cognitive and emotional framework relevant to the ritual use of ayahuasca, as well as it's potential therapeutic effects is offered.
Overview
The claims and statistics of this paper haven’t been checked yet.
Run the check — free, no account needed. It reads the open-access text and checks the sources it cites.
Integrity signals
Registry
Cites
Statistics
Figures
Verification
Claims the paper makes
The claims and statistics of this paper haven’t been checked yet.
Run the check — free, no account needed. It reads the open-access text and checks the sources it cites.
Claims other papers make about this one
Each is checked against this paper’s own text: does it say what the citing paper says it does?
In the citing paper
“After 50 min from ingestion of the brew there was observed a reduced alpha band activation over the left parieto-occipital cortex, followed by increased slow- and fast-gamma power (30–50 and 50–100 Hz, respectively) between 75 and 125 min.”
From The therapeutic potentials of Ayahuasca: possible effects against various diseases of civilization (2016) · cites this paper as Schenberg et al., 2015
In the citing paper
“These effects correlated significantly with the circulating levels of ayahuasca’s main ingredients, such as DMT, harmine, tetrahydroharmine, and some of their metabolites.”
From The therapeutic potentials of Ayahuasca: possible effects against various diseases of civilization (2016) · cites this paper as Schenberg et al., 2015
Self-check
Percentages, sums and reported differences re-computed from the paper’s own numbers.
The self-check needs the paper’s full text.
Citations
Cites
Delorme, A., & Makeig, S. (2004) · Journal of Neuroscience Methods · doi:10.1016/j.jneumeth.2003.10.009 · Cited by 24,371
Oostenveld, R., Fries, P., Maris, E., & Schoffelen, J.-M. (2011) · Computational Intelligence and Neuroscience · doi:10.1155/2011/156869 · Cited by 10,323
Nonparametric statistical testing of EEG- and MEG-data
Maris, E., & Oostenveld, R. (2007) · Journal of Neuroscience Methods · doi:10.1016/j.jneumeth.2007.03.024 · Cited by 8,496
Shaping Functional Architecture by Oscillatory Alpha Activity: Gating by Inhibition
Jensen, O., & Mazaheri, A. (2010) · Frontiers in Human Neuroscience · doi:10.3389/fnhum.2010.00186 · Cited by 3,237
Spherical splines for scalp potential and current density mapping
Perrin, F., Pernier, J., Bertrand, O., & Echallier, J. F. (1989) · Electroencephalography and Clinical Neurophysiology · doi:10.1016/0013-4694(89)90180-6 · Cited by 2,706
Experimental and theoretical approaches to conscious processing
Dehaene, S., & Changeux, J.-P. (2011) · Neuron · doi:10.1016/j.neuron.2011.03.018 · Cited by 2,573
Perception's shadow: long-distance synchronization of human brain activity
Rodriguez, E., George, N., Lachaux, J.-P., Martinerie, J., Renault, B., & Varela, F. J. (1999) · Nature · doi:10.1038/17120 · Cited by 1,915
Gut feelings: the emerging biology of gut-brain communication
Mayer, E. A. (2011) · Nature Reviews Neuroscience · doi:10.1038/nrn3071 · Cited by 1,726
Long-term meditators self-induce high-amplitude gamma synchrony during mental practice
Lutz, A., Greischar, L. L., Rawlings, N. B., Ricard, M., & Davidson, R. J. (2004) · Proceedings of the National Academy of Sciences · doi:10.1073/pnas.0407401101 · Cited by 1,328 · cited 1×
“meditation [55] or lucid dreaming [56].”
A common role of insula in feelings, empathy and uncertainty
Singer, T., Critchley, H. D., & Preuschoff, K. (2009) · Trends in Cognitive Sciences · doi:10.1016/j.tics.2009.05.001 · Cited by 1,270
Research works printed but not linked: 4
- B Holmstedt, 1967, Chemical constituents and pharmacology of South American snuffs, Psychopharmacol Bull, 4, 16
- J Ott, 1997, Pharmahuasca, Anahuasca and Vinho da Jurema: Human Pharmacology of Oral DMT Plus Harmine, yearbook for Ethnomedicine, 1
- P Naranjo, 1959, Estudio comparativo de la harmina, la dietilamida del ácido lisérgico (LSD-25) y la mescalina, Revista de la Confederación Médica Panamericana, 6, 1
- AT Shulgin, 1977, Profile of Psychedelic Drugs. 4. Harmaline, Journal of Psychedelic drugs, 9, 79
Cited by
Sorted by citations
Psychedelic drugs: neurobiology and potential for treatment of psychiatric disorders
Vollenweider, F. X., & Preller, K. H. (2020) · Nature Reviews Neuroscience · doi:10.1038/s41583-020-0367-2 · Cited by 570
The entropic brain - revisited
Carhart-Harris, R. L. (2018) · Neuropharmacology · doi:10.1016/j.neuropharm.2018.03.010 · Cited by 522
Neural correlates of the DMT experience assessed with multivariate EEG
Timmermann, C., Roseman, L., Schartner, M., Milliere, R., Williams, L. T. J., Erritzoe, D., Muthukumaraswamy, S., Ashton, M., Bendrioua, A., Kaur, O., et al. (2019) · Scientific Reports · doi:10.1038/s41598-019-51974-4 · Cited by 315
Self-citationGregorio, D. D., Aguilar‐Valles, A., Preller, K. H., Heifets, B. D., Hibicke, M., Mitchell, J., & Gobbi, G. (2020) · Journal of Neuroscience · doi:10.1523/jneurosci.1659-20.2020 · Cited by 279
The therapeutic potentials of Ayahuasca: possible effects against various diseases of civilization
Frecska, E., Bokor, P., & Winkelman, M. (2016) · Frontiers in Pharmacology · doi:10.3389/fphar.2016.00035 · Cited by 242
Metadata
- Authors
- Schenberg, E. E., Alexandre, J. F. M., Filev, R., Cravo, A. M., Sato, J. R., Muthukumaraswamy, S. D., Yonamine, M., Waguespack, M., Lomnicka, I., Barker, S. A., & da Silveira, D. X.
- Affiliations
- Universidade Federal de São Paulo (BR)
- Universidade Federal do ABC (BR)
- University of Auckland (NZ)
- Louisiana State University (US)
- Corresponding author
- Schenberg, Eduardo Ekman
- ORCID
- Venue
- PLoS ONE
- Publisher
- Public Library of Science (PLoS)
- Published
- 2015-09-30
- Volume
- 10
- Issue
- 9
- Pages
- e0137202
- ISSN
- 1932-6203 (ISSN-L)
- PMC
- PMC4589238
- OpenAlex
- W1914275515
- Cited by
- 111
- References
- 95
- Citations by year
- 2026: 5 · 2025: 12 · 2024: 8 · 2023: 12 · 2022: 14 · 2021: 13 · 2020: 15 · 2019: 5 · 2018: 11 · 2017: 7 · 2016: 7 · 2015: 1
- FWCI
- 10.75
- Type
- journal article
- Language
- en
- Open access
- gold
- doi.org
- Licence
- Locations
- PLoS ONE (publishedVersion, cc-by)
- Europe PMC (PubMed Central) (publishedVersion, cc-by)
- PubMed Central (publishedVersion, cc-by)
- PubMed (publishedVersion)
- DOAJ (DOAJ: Directory of Open Access Journals) (submittedVersion, cc-by-sa)
- ResearchSpace (University of Auckland) (submittedVersion, cc-by)
- Funders
- Fundação de Amparo à Pesquisa do Estado de São Paulo (12/07699-7, 2014/, 2015/, 2011/, 15/13536-1)
- Topics
- Social Sciences › Psychology › Clinical Psychology › Psychedelics and Drug Studies
- Life Sciences › Pharmacology, Toxicology and Pharmaceutics › Pharmacology › Alkaloids: synthesis and pharmacology
- Physical Sciences › Chemistry › Organic Chemistry › Synthesis and bioactivity of alkaloids
- Keywords
- ayahuasca, N,N-dimethyltryptamine, harmine, harmaline, tetrahydroharmine, gamma power, syncretic religion
- MeSH terms
- Adult, Brain, Electroencephalography, Female, Humans, Male, Middle Aged, Plant Extracts, Psychometrics, Banisteriopsis, Young Adult, Brain Waves
About these checks
Registry, retraction, Cites and statistics results are computed, not judged, with one exception: a printed reference that no index lists is read once by a model before it counts as a citation error. Claims are extracted by a model and kept only when their quote appears verbatim in the text; each cited source is then checked, with a model’s help, for whether it says what the claim relies on. Those verdicts can be wrong — read the claim’s quote and the cited source before relying on one.
Statistics and arithmetic are recomputed, not judged.
Confidence bands are shown only for fields calibrated on our annotated test set. None is calibrated yet, so no band is shown.
What counts as a claim ›How we measure confidence ›How we check this ›
Are you an author, or do you see a problem with this page? Request a review
