Cited by 89

The DOI matches its Crossref record; 2 of the 2 references it cites were found in a registry or an index.

VMP1 Establishes ER-Microdomains that Regulate Membrane Contact Sites and Autophagy

Tábara, Luis-Carlos, Escalante, Ricardo·2016·PLOS ONE

Overview

The claims and statistics of this paper haven’t been checked yet.

Run the check — free, no account needed. It reads the open-access text and checks the sources it cites.

A few free checks a day · papers already verified open instantly · results are public

Integrity signals

Registry

Crossref · 10.1371/journal.pone.0166499

Cites

2 of 2 references verified0 citation errors · 0 not checkable

Statistics

Figures

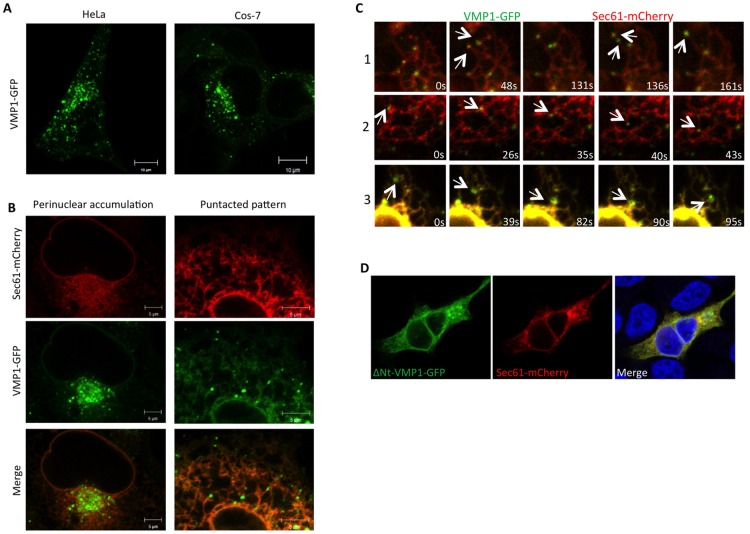
Fig 1 VMP1 is associated to ER sliding events. (A) HeLa and Cos-7 cells transfected with a plasmid encoding VMP1 fused to GFP (VMP1-GFP) and visualized by confocal microscopy show a similar pattern. (B) Analysis of confocal microscopy of Cos-7 cells expressing VMP1-GFP and the ER marker Sec61. The punctated pattern is evident in the peripheral tubules and the perinuclear area. (C) In vivo time-lapse confocal microscopy of cells expressing VMP1-GFP and Sec61-mCherry. Different examples of sliding events are shown in frames. The corresponding movies are available as supplementary material (S1–S3 Movies). (D) ΔNt-VMP1-GFP were transfected in HeLa cells and colocalized with the ER marker Sec61 by confocal microscopy. The protein distributes throughout the ER loosing the punctated pattern in HeLa cells.
Fig 1 VMP1 is associated to ER sliding events. (A) HeLa and Cos-7 cells transfected with a plasmid encoding VMP1 fused to GFP (VMP1-GFP) and visualized by confocal microscopy show a similar pattern. (B) Analysis of confocal microscopy of Cos-7 cells expressing VMP1-GFP and the ER marker Sec61. The punctated pattern is evident in the peripheral tubules and the perinuclear area. (C) In vivo time-lapse confocal microscopy of cells expressing VMP1-GFP and Sec61-mCherry. Different examples of sliding events are shown in frames. The corresponding movies are available as supplementary material (S1–S3 Movies). (D) ΔNt-VMP1-GFP were transfected in HeLa cells and colocalized with the ER marker Sec61 by confocal microscopy. The protein distributes throughout the ER loosing the punctated pattern in HeLa cells.CC BY · PubMed Central
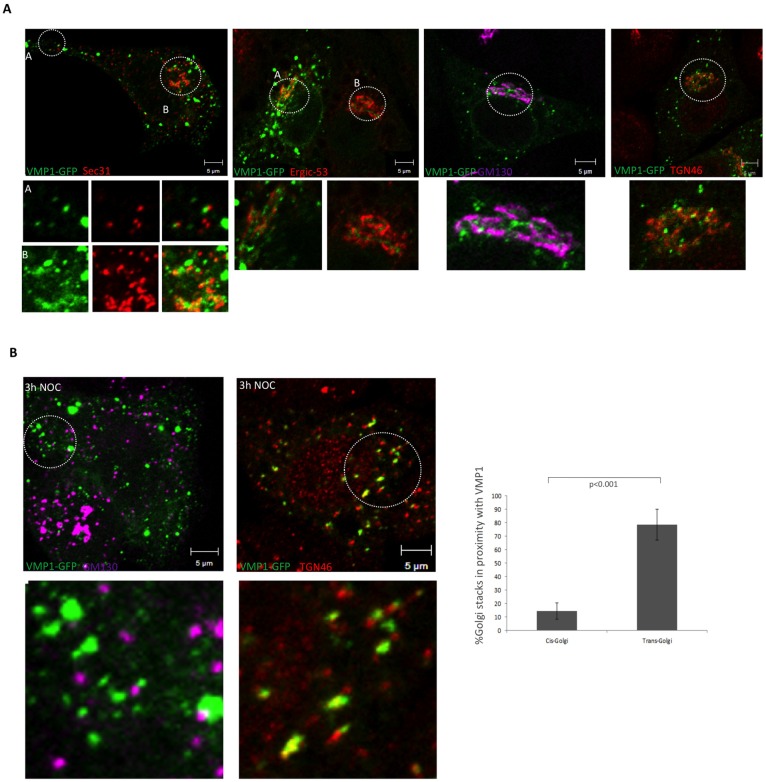
Fig 2 Analysis of colocalizations at the perinuclear area. (A) Confocal microscopy analysis of HeLa cells expressing VMP1-GFP and incubated with antibodies that recognize ERES (Sec31), ERGIC (Ergic53) and Golgi (GM130 and TGN46). No colocalizations were observed, although some regions showed close proximity. (B) Cells expressing VMP1-GFP were treated with nocodazole prior to fixation and detection of Golgi markers by confocal microscopy. Close localization and some degree of colocalization were observed with the trans-Golgi marker TGN46. The mean and the SD were obtained from two independent experiments (approximately 5–7 cells per experiment).
Fig 2 Analysis of colocalizations at the perinuclear area. (A) Confocal microscopy analysis of HeLa cells expressing VMP1-GFP and incubated with antibodies that recognize ERES (Sec31), ERGIC (Ergic53) and Golgi (GM130 and TGN46). No colocalizations were observed, although some regions showed close proximity. (B) Cells expressing VMP1-GFP were treated with nocodazole prior to fixation and detection of Golgi markers by confocal microscopy. Close localization and some degree of colocalization were observed with the trans-Golgi marker TGN46. The mean and the SD were obtained from two independent experiments (approximately 5–7 cells per experiment).CC BY · PubMed Central
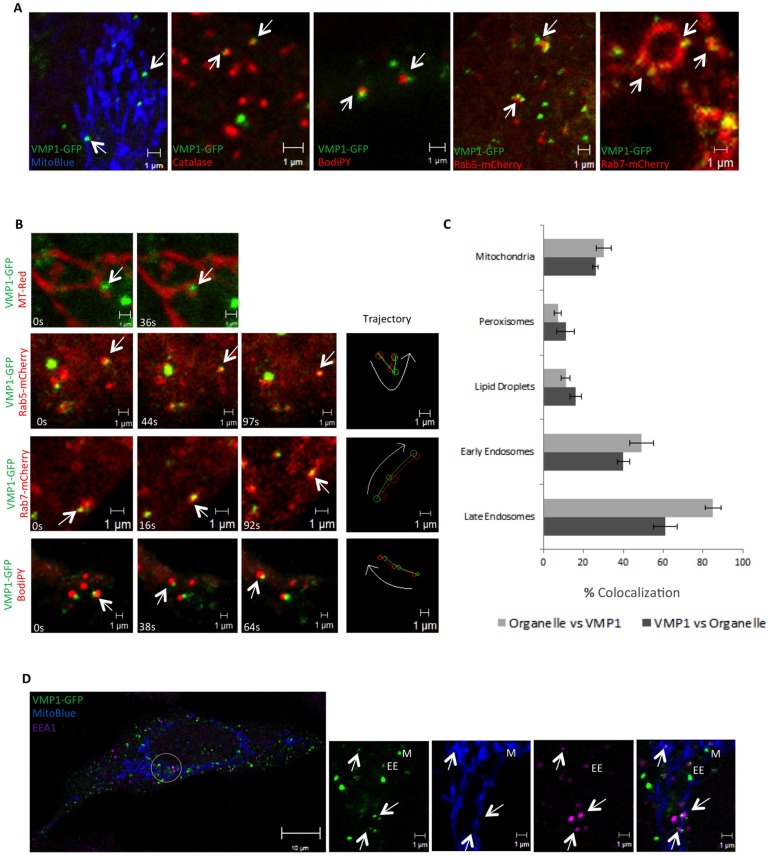
Fig 3 VMP1 establishes close contacts with organelles. (A) Confocal analysis of colocalization of VMP1-GFP expressing HeLa cells with different organelle markers as specified in the images. Similar results were obtained in Cos-7 cells (not shown). (B) In vivo time-lapse microscopy showing examples of concerted movement between VMP1 and mitochondria, lipid droplets and endosomes (corresponding to S4–S7 Movies). (C) Quantification of the proportion of VMP1 puncta in contact with organelles (and the proportion of organelles in contact with VMP1). The mean and standard deviation (SD) were obtained from three independent transfections (approximately10 cells per transfection were analyzed). (D) Triple colocalization of VMP1 puncta with mitochondria and endosomes. VMP1 puncta colocalizing or in close proximity to mitochondria and endosomes are marked by M or EE respectively. Triple colocalizations are marked by arrows.
Fig 3 VMP1 establishes close contacts with organelles. (A) Confocal analysis of colocalization of VMP1-GFP expressing HeLa cells with different organelle markers as specified in the images. Similar results were obtained in Cos-7 cells (not shown). (B) In vivo time-lapse microscopy showing examples of concerted movement between VMP1 and mitochondria, lipid droplets and endosomes (corresponding to S4–S7 Movies). (C) Quantification of the proportion of VMP1 puncta in contact with organelles (and the proportion of organelles in contact with VMP1). The mean and standard deviation (SD) were obtained from three independent transfections (approximately10 cells per transfection were analyzed). (D) Triple colocalization of VMP1 puncta with mitochondria and endosomes. VMP1 puncta colocalizing or in close proximity to mitochondria and endosomes are marked by M or EE respectively. Triple colocalizations are marked by arrows.CC BY · PubMed Central
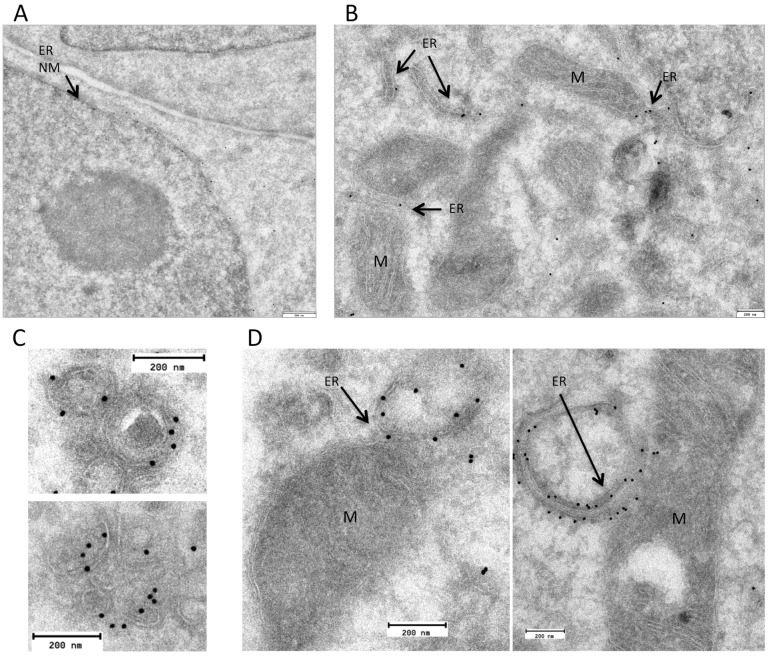
Fig 4 VMP1 is an ER protein in close proximity to vesicles and mitochondria. Cells expressing VMP1-GFP were subjected to inmuno-gold labeling with an antibody against GFP and visualized by TEM. Labeling is found in nuclear membrane (NM) (A) and ER tubules (B) as well as in close proximity to vesicles (C) and mitochondria (M)
Fig 4 VMP1 is an ER protein in close proximity to vesicles and mitochondria. Cells expressing VMP1-GFP were subjected to inmuno-gold labeling with an antibody against GFP and visualized by TEM. Labeling is found in nuclear membrane (NM) (A) and ER tubules (B) as well as in close proximity to vesicles (C) and mitochondria (M)CC BY · PubMed Central
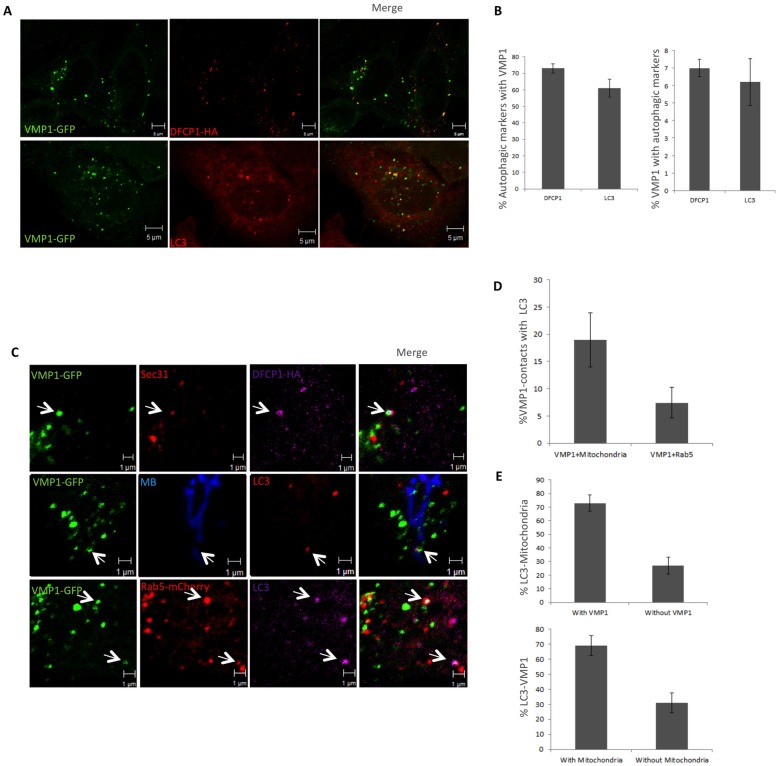
Fig 5 VMP1 associates simultaneously with organelles and autophagosomes. (A) Confocal microscopy analyses showing the level of colocalization of VMP1 puncta with the omegasome marker DFCP1(detected by expression of DFCP1-HA and subsequent inmunolocalization using anti-HA antibody) and LC3 (detected with LC3 Ab). Cells were under starvation conditions to induce autophagy (EBSS during 2 hours) (B) Quantification of VMP1 colocalizations with DFCP1 and LC3. The mean and standard deviation (SD) were obtained from three independent transfections (approximately 7 cells per transfecction). (C) Confocal analysis of colocalization between VMP1-GFP, autophagosome markers (LC3 or DFCP1) and organelles (Mitochondria labeled by MitoBlue, ERES detected by Sec31 Ab and early endosomes labeled by Rab5-mCherry). (D, E) Quantification of colocalization between VMP1 and mitochondria or endosomes as indicated in the figure. The mean and SD were obtained from 2 independent transfections (approximately 10 cells per transfection).
Fig 5 VMP1 associates simultaneously with organelles and autophagosomes. (A) Confocal microscopy analyses showing the level of colocalization of VMP1 puncta with the omegasome marker DFCP1(detected by expression of DFCP1-HA and subsequent inmunolocalization using anti-HA antibody) and LC3 (detected with LC3 Ab). Cells were under starvation conditions to induce autophagy (EBSS during 2 hours) (B) Quantification of VMP1 colocalizations with DFCP1 and LC3. The mean and standard deviation (SD) were obtained from three independent transfections (approximately 7 cells per transfecction). (C) Confocal analysis of colocalization between VMP1-GFP, autophagosome markers (LC3 or DFCP1) and organelles (Mitochondria labeled by MitoBlue, ERES detected by Sec31 Ab and early endosomes labeled by Rab5-mCherry). (D, E) Quantification of colocalization between VMP1 and mitochondria or endosomes as indicated in the figure. The mean and SD were obtained from 2 independent transfections (approximately 10 cells per transfection).CC BY · PubMed Central
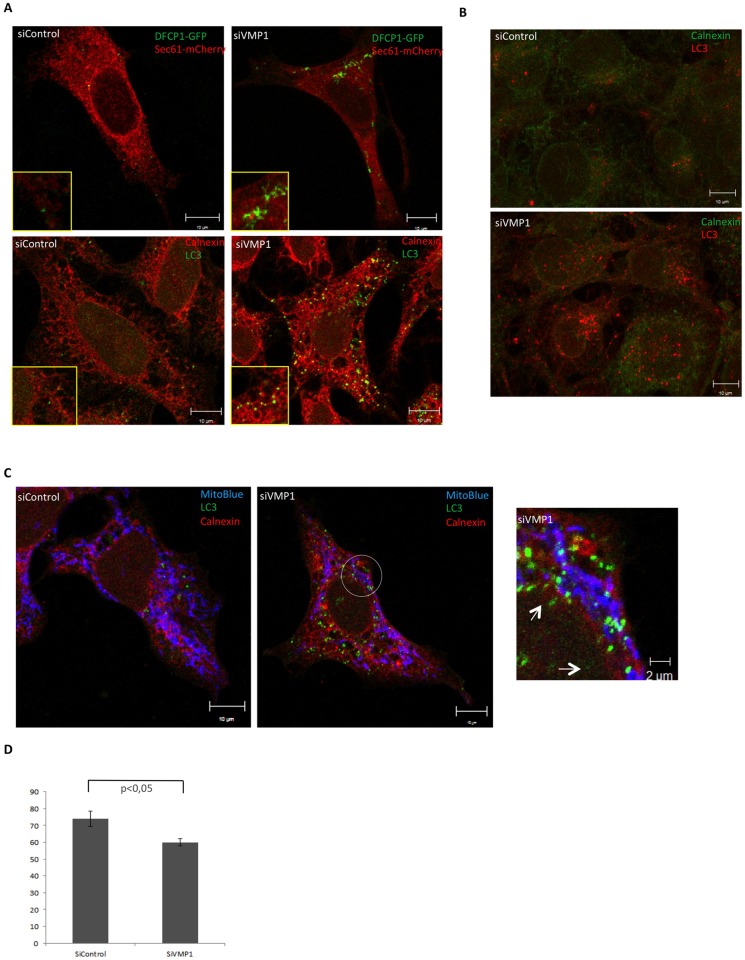
Fig 6 VMP1 depletion block starvation-induced autophagy in HeLa and Cos7 cells. (A) Confocal microscopy analysis of control and VMP1-depleted HeLa cells expressing the omegasome marker DFCP1 and the ER marker Sec61. Aberrant morphology of the omegasome marker DFCP1 is shown. Detection of LC3 and the ER-marker Calnexin in control and VMP1-depleted HeLa cells to show the accumulation of LC3 structures at the ER. (B) Detection by confocal microscopy of LC3 and the ER-marker Calnexin of control and VMP1-depleted Cos-7 cells to show the accumulation of LC3 structures at the ER. (C) Triple colocalization of Mitochondria, ER and LC3 in control and VMP1-depleted HeLa cells. Below the quantification of colocalization events between LC3 and mitochondria is shown. All experiments were under starvation conditions to induce autophagy (EBSS during 2 hours). The mean and the SD were obtained from two independent transfections (approximately 10 cells per transfection) and analyzed using the Student t-test.
Fig 6 VMP1 depletion block starvation-induced autophagy in HeLa and Cos7 cells. (A) Confocal microscopy analysis of control and VMP1-depleted HeLa cells expressing the omegasome marker DFCP1 and the ER marker Sec61. Aberrant morphology of the omegasome marker DFCP1 is shown. Detection of LC3 and the ER-marker Calnexin in control and VMP1-depleted HeLa cells to show the accumulation of LC3 structures at the ER. (B) Detection by confocal microscopy of LC3 and the ER-marker Calnexin of control and VMP1-depleted Cos-7 cells to show the accumulation of LC3 structures at the ER. (C) Triple colocalization of Mitochondria, ER and LC3 in control and VMP1-depleted HeLa cells. Below the quantification of colocalization events between LC3 and mitochondria is shown. All experiments were under starvation conditions to induce autophagy (EBSS during 2 hours). The mean and the SD were obtained from two independent transfections (approximately 10 cells per transfection) and analyzed using the Student t-test.CC BY · PubMed Central
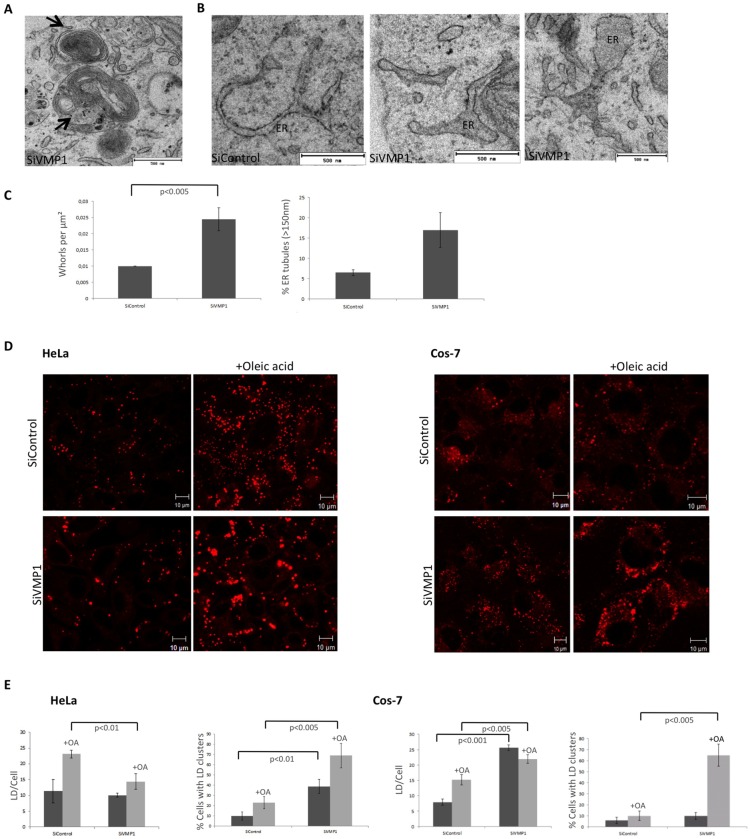
Fig 7 VMP1 dependent alterations in ER structure and lipid droplets. (A) TEM image of whorl structures from VMP1-depleted Cos-7 cells. (B) TEM image of altered ER structures in VMP1-depleted cells. (C) To analyze the abnormal ER features the mean and the SD were obtained fromof two independent inhibitions using 50 sections of 25 μm2 for each condition (25 sections per inhibition). (D) Control and VMP1-depleted HeLa and Cos-7 cells were treated with oleic acid and stained for LDs with Bodipy. Representative images of at least three independent experiments are shown. (E) Quantification analysis of LD number and clusters. The mean and the SD were obtained from three independent experiments (approximately 10 cells per experiment). The level of significance were analyzed using the Student t-test.
Fig 7 VMP1 dependent alterations in ER structure and lipid droplets. (A) TEM image of whorl structures from VMP1-depleted Cos-7 cells. (B) TEM image of altered ER structures in VMP1-depleted cells. (C) To analyze the abnormal ER features the mean and the SD were obtained fromof two independent inhibitions using 50 sections of 25 μm2 for each condition (25 sections per inhibition). (D) Control and VMP1-depleted HeLa and Cos-7 cells were treated with oleic acid and stained for LDs with Bodipy. Representative images of at least three independent experiments are shown. (E) Quantification analysis of LD number and clusters. The mean and the SD were obtained from three independent experiments (approximately 10 cells per experiment). The level of significance were analyzed using the Student t-test.CC BY · PubMed Central
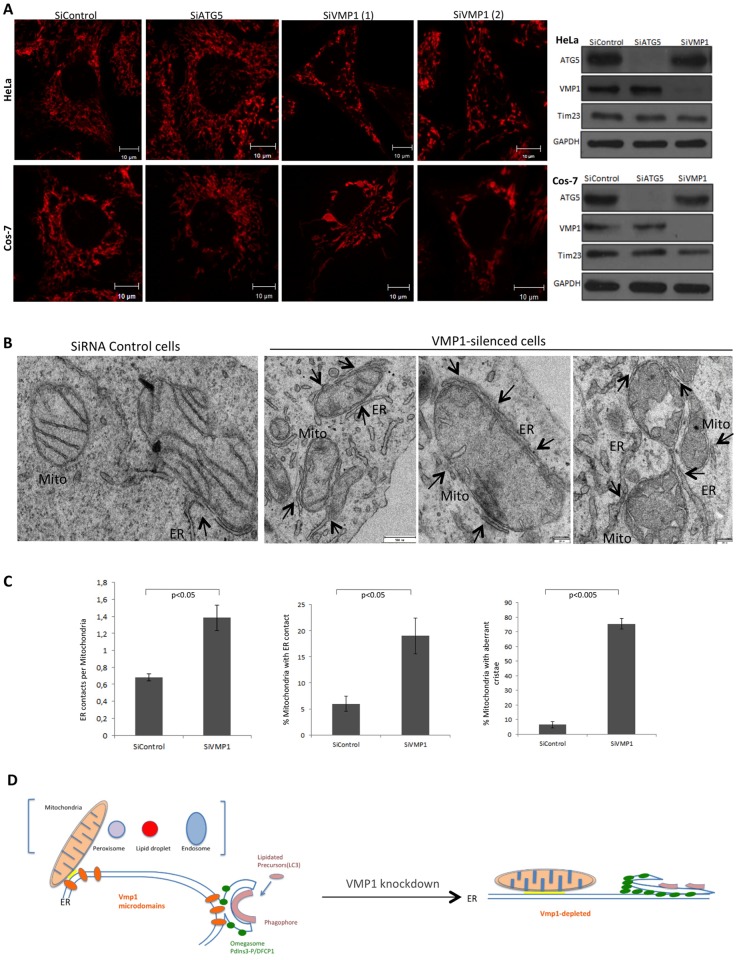
Fig 8 VMP1 regulates ER-mitochondria MCS. (A) Hela and Cos-7 cells were transfected with siRNAs of control, Atg5 and VMP1 (two different hairpins), stained with mitotracker and analyzed by confocal microscopy. Alterations in size and morphology of mitochondria were observed in VMP1-depleted cells. Representative images of at least three independent experiments. To the right, a representative western-blot analysis of the mitochondrial protein Tim23 form HeLa and Cos-7 cells treated with the different siRNAs is shown. Representative western blots of three independent experiments are shown. (B) TEM analysis of control and VMP1-depleted Cos-7 cells show altered mitochondria with dilated cristae and abundant MCS (marked by arrows). (C) Several parameters of MCS and mitochondria morphology between control and VMP1-depleted cells are compared. The mean and the SD were obtained from two independent inhibitions (150 and 100 mitochondrial profiles respectively were analyzed). (D) Model of VMP1 function regulating MCS of multiple organelles and the impact in autophagy. Accumulation of PtdIns3P and autophagic structures at the ER as a consequence of enlarged VMP1 depletion.
Fig 8 VMP1 regulates ER-mitochondria MCS. (A) Hela and Cos-7 cells were transfected with siRNAs of control, Atg5 and VMP1 (two different hairpins), stained with mitotracker and analyzed by confocal microscopy. Alterations in size and morphology of mitochondria were observed in VMP1-depleted cells. Representative images of at least three independent experiments. To the right, a representative western-blot analysis of the mitochondrial protein Tim23 form HeLa and Cos-7 cells treated with the different siRNAs is shown. Representative western blots of three independent experiments are shown. (B) TEM analysis of control and VMP1-depleted Cos-7 cells show altered mitochondria with dilated cristae and abundant MCS (marked by arrows). (C) Several parameters of MCS and mitochondria morphology between control and VMP1-depleted cells are compared. The mean and the SD were obtained from two independent inhibitions (150 and 100 mitochondrial profiles respectively were analyzed). (D) Model of VMP1 function regulating MCS of multiple organelles and the impact in autophagy. Accumulation of PtdIns3P and autophagic structures at the ER as a consequence of enlarged VMP1 depletion.CC BY · PubMed Central

Verification

Claims the paper makes

The claims and statistics of this paper haven’t been checked yet.

Run the check — free, no account needed. It reads the open-access text and checks the sources it cites.

A few free checks a day · papers already verified open instantly · results are public

Claims other papers make about this one

Each is checked against this paper’s own text: does it say what the citing paper says it does?

Self-check

Percentages, sums and reported differences re-computed from the paper’s own numbers.

The self-check needs the paper’s full text.

Citations

Cites

Show all 2 references

Research works printed but not linked: 41

  1. MJ Phillips, 2016, Structure and function of ER membrane contact sites with other organelles, Nature reviews Molecular cell biology, 17, 69, 10.1038/nrm.2015.8 · DOI · Paper page
  2. ER Eden, 2016, The formation and function of ER-endosome membrane contact sites, Biochimica et biophysica acta, 1861, 874, 10.1016/j.bbalip.2016.01.020 · DOI
  3. WA Prinz, 2014, Bridging the gap: membrane contact sites in signaling, metabolism, and organelle dynamics, The Journal of cell biology, 205, 759, 10.1083/jcb.201401126 · DOI
  4. M Hayashi-Nishino, 2010, Electron tomography reveals the endoplasmic reticulum as a membrane source for autophagosome formation, Autophagy, 6, 301, 10.4161/auto.6.2.11134 · DOI
  5. T Uemura, 2014, A cluster of thin tubular structures mediates transformation of the endoplasmic reticulum to autophagic isolation membrane, Mol Cell Biol, 34, 1695, 10.1128/MCB.01327-13 · DOI
  6. MI Wilson, 2014, WIPI2b and Atg16L1: setting the stage for autophagosome formation, Biochemical Society transactions, 42, 1327, 10.1042/BST20140177 · DOI
  7. HC Dooley, 2014, WIPI2 links LC3 conjugation with PI3P, autophagosome formation, and pathogen clearance by recruiting Atg12-5-16L1, Molecular cell, 55, 238, 10.1016/j.molcel.2014.05.021 · DOI
  8. L Ge, 2014, The ER-Golgi intermediate compartment feeds the phagophore membrane, Autophagy, 10, 170, 10.4161/auto.26787 · DOI
  9. C Puri, 2014, ATG16L1 meets ATG9 in recycling endosomes: additional roles for the plasma membrane and endocytosis in autophagosome biogenesis, Autophagy, 10, 182, 10.4161/auto.27174 · DOI
  10. A van der Vaart, 2010, The Golgi complex as a source for yeast autophagosomal membranes, Autophagy, 6, 800, 10.4161/auto.6.6.12575 · DOI
  11. M Hamasaki, 2013, Autophagosomes form at ER-mitochondria contact sites, Nature, 495, 389, 10.1038/nature11910 · DOI · Paper page
  12. AP Velazquez, 2016, Lipid droplet-mediated ER homeostasis regulates autophagy and cell survival during starvation, The Journal of cell biology, 212, 621, 10.1083/jcb.201508102 · DOI
  13. T Shpilka, 2015, Lipid droplets and their component triglycerides and steryl esters regulate autophagosome biogenesis, The EMBO journal, 34, 2117, 10.15252/embj.201490315 · DOI
  14. L Murrow, 2015, ATG12-ATG3 interacts with Alix to promote basal autophagic flux and late endosome function, Nature cell biology, 17, 300, 10.1038/ncb3112 · DOI
  15. M Graef, 2013, ER exit sites are physical and functional core autophagosome biogenesis components, Molecular Biology of the Cell, 24, 2918, 10.1091/mbc.E13-07-0381 · DOI
  16. J Sanchez-Wandelmer, 2015, ERES: sites for autophagosome biogenesis and maturation?, Journal of cell science, 15, 185, 10.1242/jcs.158758 · DOI
  17. J Biazik, 2015, Ultrastructural relationship of the phagophore with surrounding organelles, Autophagy, 11, 439, 10.1080/15548627.2015.1017178 · DOI · Paper page
  18. J Calvo-Garrido, 2008, Vacuole membrane protein 1 is an endoplasmic reticulum protein required for organelle biogenesis, protein secretion, and development, Mol Biol Cell, 19, 3442, 10.1091/mbc.E08-01-0075 · DOI
  19. P Wang, 2011, KMS1 and KMS2, two plant endoplasmic reticulum proteins involved in the early secretory pathway, The Plant journal: for cell and molecular biology, 66, 613, 10.1111/j.1365-313X.2011.04522.x · DOI
  20. E Itakura, 2010, Characterization of autophagosome formation site by a hierarchical analysis of mammalian Atg proteins, Autophagy, 6, 764, 10.4161/auto.6.6.12709 · DOI · Paper page
  21. C Kishi-Itakura, 2014, Ultrastructural analysis of autophagosome organization using mammalian autophagy-deficient cells, Journal of cell science, 127, 4089, 10.1242/jcs.156034 · DOI
  22. Y Tian, 2010, C. elegans screen identifies autophagy genes specific to multicellular organisms, Cell, 141, 1042, 10.1016/j.cell.2010.04.034 · DOI · Paper page
  23. J Calvo-Garrido, 2010, Autophagy dysfunction and ubiquitin-positive protein aggregates in Dictyostelium cells lacking Vmp1, Autophagy, 6, 100, 10.4161/auto.6.1.10697 · DOI
  24. J Calvo-Garrido, 2014, Vmp1 Regulates PtdIns3P Signaling During Autophagosome Formation in Dictyostelium discoideum, Traffic, 15, 1235, 10.1111/tra.12210 · DOI
  25. H Tenenboim, 2014, VMP1-deficient Chlamydomonas exhibits severely aberrant cell morphology and disrupted cytokinesis, BMC Plant Biol, 14, 121, 10.1186/1471-2229-14-121 · DOI
  26. AK Velikkakath, 2012, Mammalian Atg2 proteins are essential for autophagosome formation and important for regulation of size and distribution of lipid droplets, Molecular Biology of the Cell, 23, 896, 10.1091/mbc.E11-09-0785 · DOI
  27. MJ Wozniak, 2009, Role of kinesin-1 and cytoplasmic dynein in endoplasmic reticulum movement in VERO cells, Journal of cell science, 122, 1979, 10.1242/jcs.041962 · DOI
  28. S Hoepfner, 2005, Modulation of receptor recycling and degradation by the endosomal kinesin KIF16B, Cell, 121, 437, 10.1016/j.cell.2005.02.017 · DOI
  29. G Drin, 2010, Amphipathic helices and membrane curvature, FEBS letters, 584, 1840, 10.1016/j.febslet.2009.10.022 · DOI
  30. LM Westrate, 2015, Form follows function: the importance of endoplasmic reticulum shape, Annual review of biochemistry, 84, 791, 10.1146/annurev-biochem-072711-163501 · DOI
  31. M Giacomello, 2016, The coming of age of the mitochondria-ER contact: a matter of thickness, Cell death and differentiation, 23, 1417, 10.1038/cdd.2016.52 · DOI
  32. I Koyama-Honda, 2013, Temporal analysis of recruitment of mammalian ATG proteins to the autophagosome formation site, Autophagy, 9, 1491, 10.4161/auto.25529 · DOI
  33. GP Otto, 2003, Macroautophagy is required for multicellular development of the social amoeba Dictyostelium discoideum, J Biol Chem, 278, 17636, 10.1074/jbc.M212467200 · DOI · Paper page
  34. A Grippa, 2015, The seipin complex Fld1/Ldb16 stabilizes ER-lipid droplet contact sites, The Journal of cell biology, 211, 829, 10.1083/jcb.201502070 · DOI
  35. HT McMahon, 2015, Membrane curvature at a glance, Journal of cell science, 128, 1065, 10.1242/jcs.114454 · DOI
  36. J Calvo-Garrido, 2008, Vacuole membrane protein 1, autophagy and much more, Autophagy, 4, 835, 10.4161/auto.6574 · DOI
  37. V Starkuviene, 2004, High-content screening microscopy identifies novel proteins with a putative role in secretory membrane traffic, Genome Res, 14, 1948, 10.1101/gr.2658304 · DOI
  38. C Rabouille, 2006, TANGOing along the protein secretion pathway, Genome biology, 7, 213, 10.1186/gb-2006-7-4-213 · DOI
  39. MI Molejon, 2013, The VMP1-Beclin 1 interaction regulates autophagy induction, Sci Rep, 3, 1055, 10.1038/srep01055 · DOI
  40. P Cosson, 2012, Mitofusin-2 independent juxtaposition of endoplasmic reticulum and mitochondria: an ultrastructural study, PLoS ONE, 7, e46293, 10.1371/journal.pone.0046293 · DOI
  41. DW Hailey, 2010, Mitochondria supply membranes for autophagosome biogenesis during starvation, Cell, 141, 656, 10.1016/j.cell.2010.04.009 · DOI

Cited by

Sorted by citations

Metadata

Authors
Tábara, L.-C., & Escalante, R.
Venue
PLOS ONE
Published
2016-11-18
Volume
11
Issue
11
Pages
e0166499
ISSN
1932-6203
Cited by
89
References
2
Language
en
Funders
MINECO (BFU2015-64440-P)

About these checks

Registry, retraction, Cites and statistics results are computed, not judged, with one exception: a printed reference that no index lists is read once by a model before it counts as a citation error. Claims are extracted by a model and kept only when their quote appears verbatim in the text; each cited source is then checked, with a model’s help, for whether it says what the claim relies on. Those verdicts can be wrong — read the claim’s quote and the cited source before relying on one.

Statistics and arithmetic are recomputed, not judged.

Confidence bands are shown only for fields calibrated on our annotated test set. None is calibrated yet, so no band is shown.

What counts as a claim ›How we measure confidence ›How we check this ›

Are you an author, or do you see a problem with this page? Request a review