

The DOI matches its Crossref record; 78 of the 80 references it cites were found in a registry or an index.
Neutralizing misinformation through inoculation: Exposing misleading argumentation techniques reduces their influence
Open accessAbstract
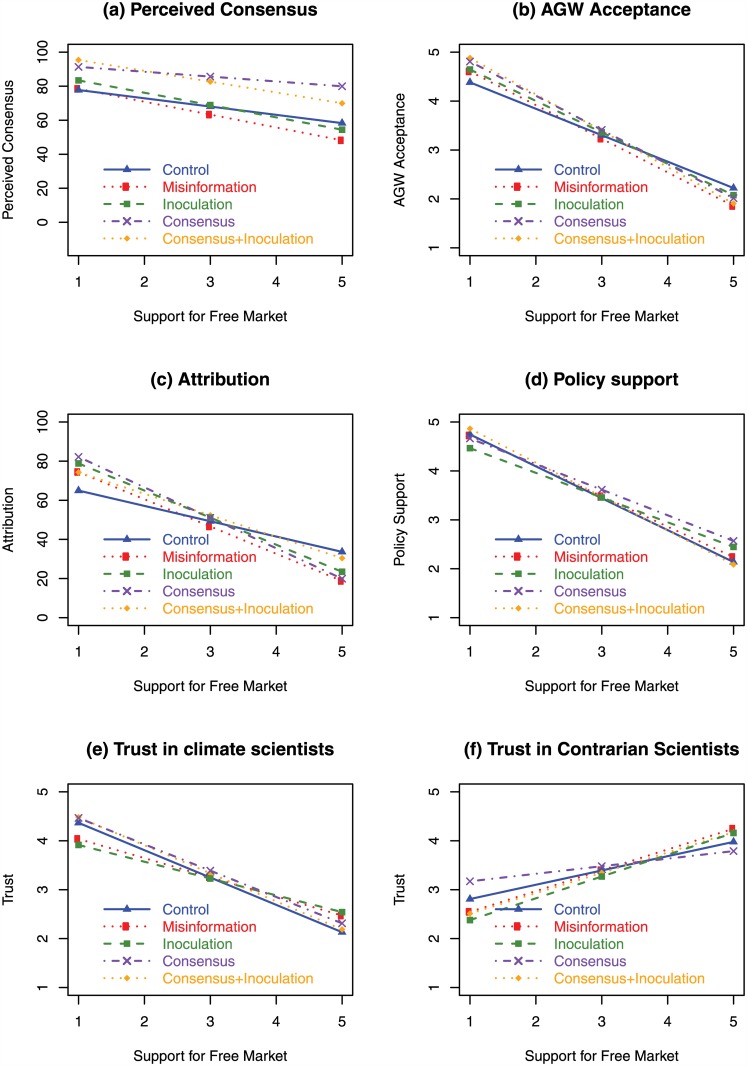
Misinformation can undermine a well-functioning democracy. For example, public misconceptions about climate change can lead to lowered acceptance of the reality of climate change and lowered support for mitigation policies. This study experimentally explored the impact of misinformation about climate change and tested several pre-emptive interventions designed to reduce the influence of misinformation. We found that false-balance media coverage (giving contrarian views equal voice with climate scientists) lowered perceived consensus overall, although the effect was greater among free-market supporters. Likewise, misinformation that confuses people about the level of scientific agreement regarding anthropogenic global warming (AGW) had a polarizing effect, with free-market supporters reducing their acceptance of AGW and those with low free-market support increasing their acceptance of AGW. However, we found that inoculating messages that (1) explain the flawed argumentation technique used in the misinformation or that (2) highlight the scientific consensus on climate change were effective in neutralizing those adverse effects of misinformation. We recommend that climate communication messages should take into account ways in which scientific content can be distorted, and include pre-emptive inoculation messages.
Overview
The claims and statistics of this paper haven’t been checked yet.
Run the check — free, no account needed. It reads the open-access text and checks the sources it cites.
Integrity signals
Registry
Cites
Statistics
Figures

Verification
Claims the paper makes
The claims and statistics of this paper haven’t been checked yet.
Run the check — free, no account needed. It reads the open-access text and checks the sources it cites.
Claims other papers make about this one
Each is checked against this paper’s own text: does it say what the citing paper says it does?
The check wasn’t confident either way, so it gives no verdict — never disputed.
In the citing paper
“Inoculation, while effective in preemptively refuting misinformation in specific domains (27–30), may not improve discernment when evaluating a diverse array of real-world news content.”
From A digital media literacy intervention increases discernment between mainstream and false news in the United States and India (2020) · cites this paper as [29]
Experimental — accuracy not yet measuredIn the citing paper
“focusing on the manipulation techniques and rhetorical strategies that underpin misinformation may significantly improve the potential scalability of inoculation interventions (17).”
From Psychological inoculation improves resilience against misinformation on social media (2022) · cites this paper as [17]
Self-check
Percentages, sums and reported differences re-computed from the paper’s own numbers.
The self-check needs the paper’s full text.
Citations
Cites
Maps of Bounded Rationality: Psychology for Behavioral Economics
Kahneman, D. (2003) · American Economic Review · doi:10.1257/000282803322655392 · Cited by 5,377
A Theory of Psychological Reactance
Torrance, E. P., & Brehm, J. W. (1968) · The American Journal of Psychology · doi:10.2307/1420824 · Cited by 4,759
Ohanian, R. (1990) · Journal of Advertising · doi:10.1080/00913367.1990.10673191 · Cited by 4,043
When Corrections Fail: The Persistence of Political Misperceptions
Nyhan, B., & Reifler, J. (2010) · Political Behavior · doi:10.1007/s11109-010-9112-2 · Cited by 3,173
Misinformation and Its Correction: Continued Influence and Successful Debiasing
Lewandowsky, S., Ecker, U. K. H., Seifert, C. M., Schwarz, N., & Cook, J. (2012) · Psychological Science in the Public Interest · doi:10.1177/1529100612451018 · Cited by 2,920
Self-citationMcCright, A. M., & Dunlap, R. E. (2011) · The Sociological Quarterly · doi:10.1111/j.1533-8525.2011.01198.x · Cited by 2,340
The Scientific Consensus on Climate Change
Oreskes, N. (2004) · Science · doi:10.1126/science.1103618 · Cited by 1,814
Balance as bias: global warming and the US prestige press
Boykoff, M. T., & Boykoff, J. M. (2004) · Global Environmental Change · doi:10.1016/j.gloenvcha.2003.10.001 · Cited by 1,699
Cultural cognition of scientific consensus.
Kahan, D. M., Jenkins‐Smith, H., & Braman, D. (2011) · Journal of Risk Research · doi:10.1080/13669877.2010.511246 · Cited by 1,686
Consensus on consensus: a synthesis of consensus estimates on human-caused global warming
Cook, J., Oreskes, N., Doran, P. T., Anderegg, W. R. L., Verheggen, B., Maibach, E. W., Carlton, J. S., Lewandowsky, S., Skuce, A. G., Green, S. A., et al. (2016) · Environmental Research Letters · doi:10.1088/1748-9326/11/4/048002 · Cited by 1,441
Self-citation
Cited by
Pennycook, G., & Rand, D. G. (2019) · Cognition · doi:10.1016/j.cognition.2018.06.011 · Cited by 2,022
“Alternatively, adding a pre-emptive inoculation statement (Cook et al., 2017), such as a warning that not all news stories are accurate, may further increase the strength of the correlation between analytic thinking and media truth discernment.”
Beyond misinformation: Understanding and coping with the “post-truth” era.
Lewandowsky, S., Ecker, U. K. H., & Cook, J. (2017) · Journal of Applied Research in Memory and Cognition · doi:10.1016/j.jarmac.2017.07.008 · Cited by 1,985
“…for correcting misnformation are bound to remain helpful and necessary, and ffectively pointing out logical flaws in argumentation will coninue to be valuable in inoculating people against potential isinformation campaigns (Cook et al., 2017; Ecker, Hogan, & ewandowsky, 2017; Schwarz et al., 2016).”
BackgroundSelf-citationThe psychological drivers of misinformation belief and its resistance to correction
Ecker, U. K. H., Lewandowsky, S., Cook, J., Schmid, P., Fazio, L. K., Brashier, N., Kendeou, P., Vraga, E. K., & Amazeen, M. A. (2022) · Nature Reviews Psychology · doi:10.1038/s44159-021-00006-y · Cited by 1,372
Self-citationPennycook, G., & Rand, D. G. (2021) · Trends in Cognitive Sciences · doi:10.1016/j.tics.2021.02.007 · Cited by 1,360
“, in the context of climate change [103]) may be more scalable.”
BackgroundGuess, A. M., Lerner, M., Lyons, B., Montgomery, J. M., Nyhan, B., Reifler, J., & Sircar, N. (2020) · Proceedings of the National Academy of Sciences · doi:10.1073/pnas.1920498117 · Cited by 773
Metadata
- Authors
- Cook, J., Lewandowsky, S., & Ecker, U. K. H.
- Affiliations
- George Mason University (US)
- The University of Western Australia (AU)
- Corresponding author
- Cook, John
- Lewandowsky, Stephan
- Ecker, Ullrich K. H.
- Venue
- PLOS ONE
- Publisher
- Public Library of Science (PLoS)
- Published
- 2017-05-05
- Volume
- 12
- Issue
- 5
- Pages
- e0175799
- ISSN
- 1932-6203 (ISSN-L)
- PMC
- PMC5419564
- OpenAlex
- W2610353045
- Cited by
- 971
- References
- 80
- Citations by year
- 2026: 120 · 2025: 124 · 2024: 110 · 2023: 129 · 2022: 135 · 2021: 116 · 2020: 130 · 2019: 59 · 2018: 29 · 2017: 19
- FWCI
- 165.41
- Type
- journal article
- Language
- en
- Open access
- gold
- doi.org
- Licence
- Locations
- PLoS ONE (publishedVersion, cc-by)
- PubMed Central (publishedVersion, cc-by)
- UWA Profiles and Research Repository (UWA) (publishedVersion, cc-by)
- PubMed (publishedVersion)
- RePEc: Research Papers in Economics (submittedVersion)
- DOAJ (DOAJ: Directory of Open Access Journals) (submittedVersion, cc-by-sa)
- Figshare (submittedVersion, cc-by)
- Bristol Research (University of Bristol) (submittedVersion, cc-by)
- Explore Bristol Research (submittedVersion, cc-by)
- George Mason University (cc-by)
- Funders
- Australian Research Council
- Royal Society
- Psychonomics Society
- Topics
- Social Sciences › Sociology and Political Science › Climate Change Communication and Perception
- Social Sciences › Sociology and Political Science › Misinformation and Its Impacts
- Social Sciences › Economics, Econometrics and Finance › Economics and Econometrics › Climate Change Policy and Economics
- Keywords
- misinformation, inoculation, climate change misinformation, false balance, scientific consensus, anthropogenic climate change, free market ideology, political polarization, argumentation techniques, climate change communication
- MeSH terms
- Information Services, Climate Change
About these checks
Registry, retraction, Cites and statistics results are computed, not judged, with one exception: a printed reference that no index lists is read once by a model before it counts as a citation error. Claims are extracted by a model and kept only when their quote appears verbatim in the text; each cited source is then checked, with a model’s help, for whether it says what the claim relies on. Those verdicts can be wrong — read the claim’s quote and the cited source before relying on one.
Statistics and arithmetic are recomputed, not judged.
Confidence bands are shown only for fields calibrated on our annotated test set. None is calibrated yet, so no band is shown.
What counts as a claim ›How we measure confidence ›How we check this ›
Are you an author, or do you see a problem with this page? Request a review
How to cite
Cite CoChat for the checks on this page, and the paper for its own findings.
- This page
- CoChat. (2026). Citation check: Neutralizing misinformation through inoculation: Exposing misleading argumentation techniques reduces their influence. https://app.cochat.ai/papers/10.1371/journal.pone.0175799
- The paper
- Cook, J., Lewandowsky, S., & Ecker, U. K. H. (2017). Neutralizing misinformation through inoculation: Exposing misleading argumentation techniques reduces their influence. PLOS ONE. https://doi.org/10.1371/journal.pone.0175799
Data sources
Bibliographic data: Semantic Scholar, OpenAlex, Crossref.
Contains information from the Semantic Scholar Academic Graph Datasets, made available under the ODC Attribution License (ODC-BY 1.0).
Semantic Scholar’s data is described in: Kinney, R., et al. (2023). The Semantic Scholar Open Data Platform. arXiv:2301.10140.
