

The DOI matches its Crossref record; 79 of the 79 references it cites were found in a registry or an index.
Effects of microplastic exposure on the body condition and behaviour of planktivorous reef fish (Acanthochromis polyacanthus)
Open accessAbstract
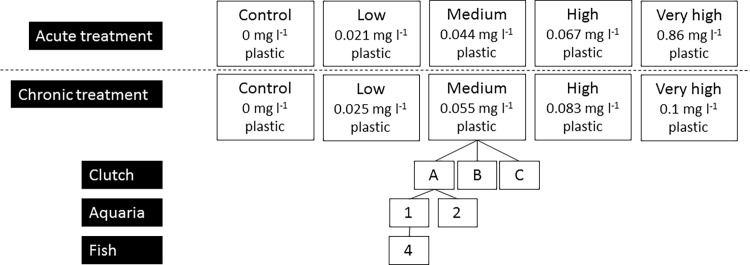
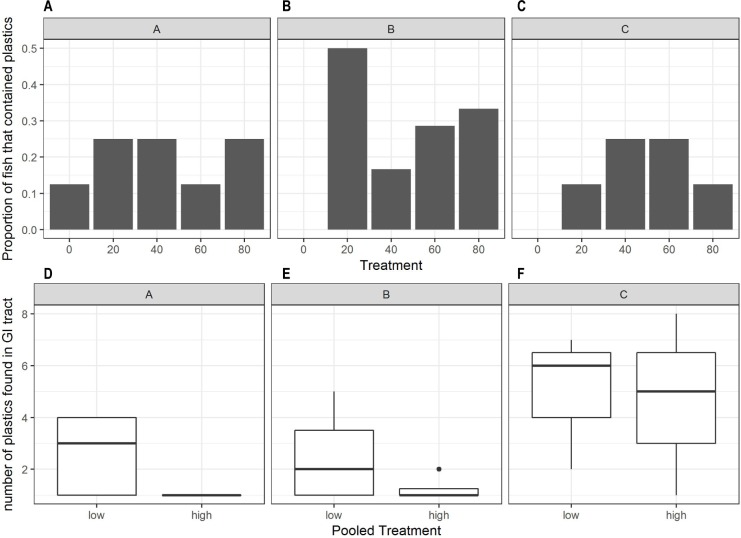
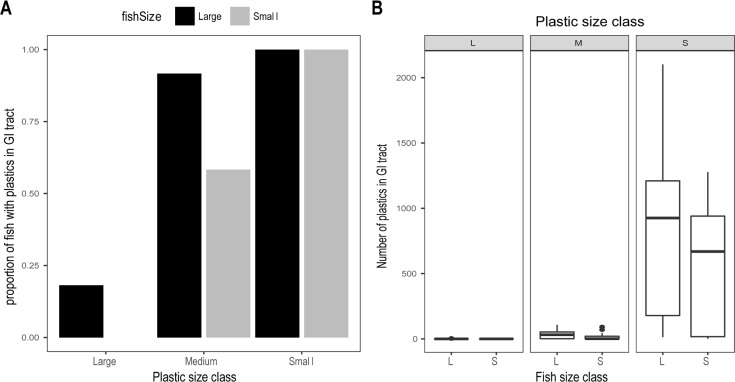
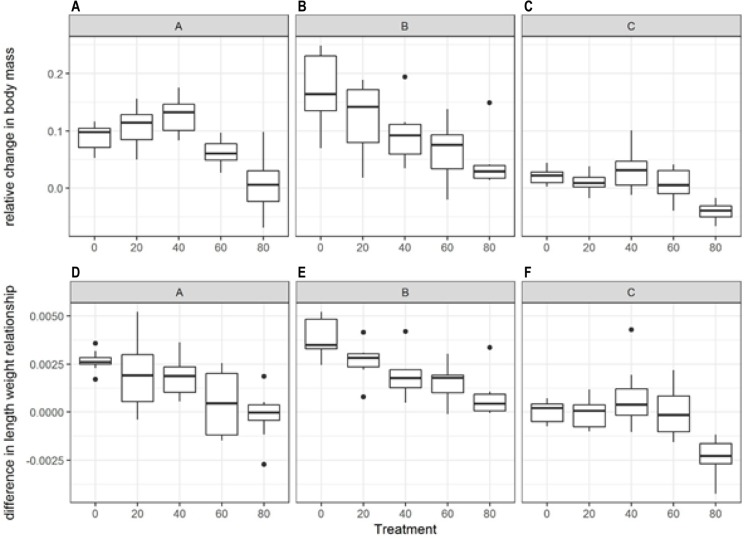
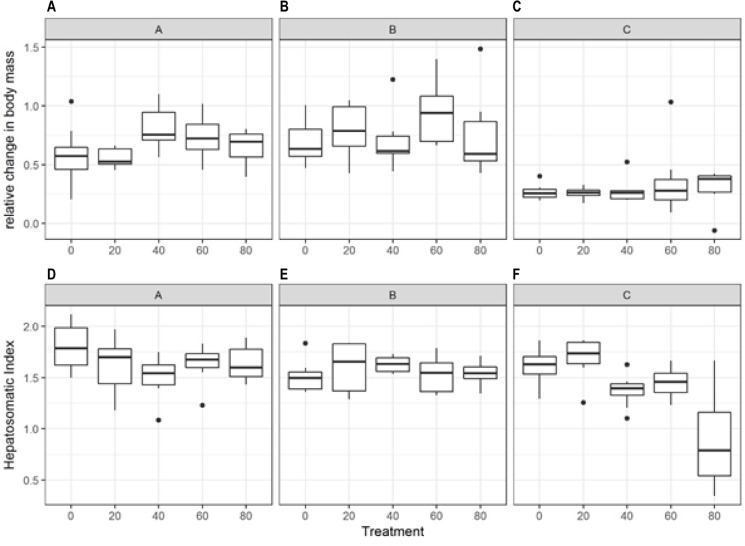
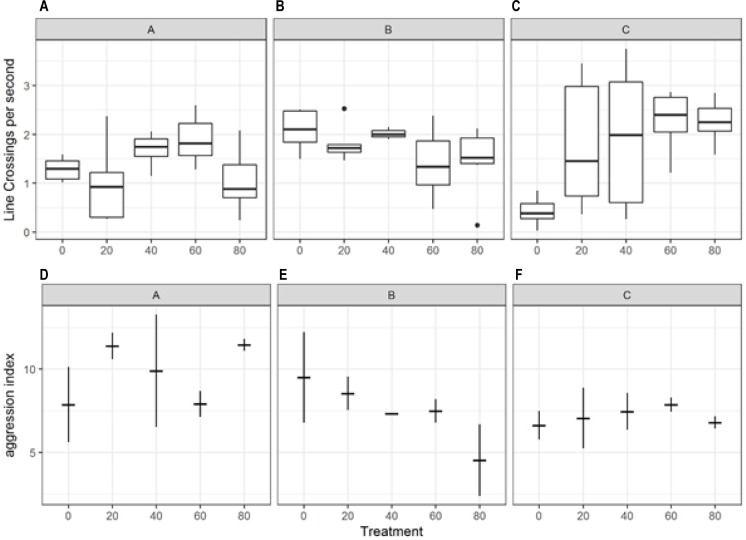
The effect of a pollutant on the base of the food web can have knock-on effects for trophic structure and ecosystem functioning. In this study we assess the effect of microplastic exposure on juveniles of a planktivorous fish (Acanthochromis polyacanthus), a species that is widespread and abundant on Indo-Pacific coral reefs. Under five different plastic concentration treatments, with plastics the same size as the natural food particles (mean 2mm diameter), there was no significant effect of plastic exposure on fish growth, body condition or behaviour. The amount of plastics found in the gastro-intestinal (GI) tract was low, with a range of one to eight particles remaining in the gut of individual fish at the end of a 6-week plastic-exposure period, suggesting that these fish are able to detect and avoid ingesting microplastics in this size range. However, in a second experiment the number of plastics in the GI tract vastly increased when plastic particle size was reduced to approximately one quarter the size of the food particles, with a maximum of 2102 small (< 300μm diameter) particles present in the gut of individual fish after a 1-week plastic exposure period. Under conditions where food was replaced by plastic, there was a negative effect on the growth and body condition of the fish. These results suggest plastics could become more of a problem as they break up into smaller size classes, and that environmental changes that lead to a decrease in plankton concentrations combined with microplastic presence is likely have a greater influence on fish populations than microplastic presence alone.
Overview
The claims and statistics of this paper haven’t been checked yet.
Run the check — free, no account needed. It reads the open-access text and checks the sources it cites.
Integrity signals
Registry
Cites
Statistics
Figures
Verification
Claims the paper makes
The claims and statistics of this paper haven’t been checked yet.
Run the check — free, no account needed. It reads the open-access text and checks the sources it cites.
Claims other papers make about this one
Each is checked against this paper’s own text: does it say what the citing paper says it does?
The source backs part of the claim, not all of it — or backs it for a different population, condition or comparison.
In the citing paper
“The inclusion of higher order mesopredators (i.e., reef fish) in such studies is less frequent (Critchell and Hoogenboom, 2018; Santana et al., 2021), leaving a gap in our understanding of the mech anisms of MPs transfer to and their ecological fate in these higher trophic level organisms.”
From Trophic transfer of polyester microfibres across a multi-level marine food web. (2025) · cites this paper as Critchell and Hoogenboom, 2018
Experimental — accuracy not yet measured
Self-check
Percentages, sums and reported differences re-computed from the paper’s own numbers.
The self-check needs the paper’s full text.
Citations
Cites
R: A Language and Environment for Statistical Computing
R Core Team (2000) · doi:10.32614/r.manuals · Cited by 355,817
Microplastics in the marine environment
Andrady, A. L. (2011) · Marine Pollution Bulletin · doi:10.1016/j.marpolbul.2011.05.030 · Cited by 8,105
Eriksen, M., Lebreton, L. C. M., Carson, H. S., Thiel, M., Moore, C. J., Borerro, J. C., Galgani, F., Ryan, P. G., & Reisser, J. (2014) · PLoS ONE · doi:10.1371/journal.pone.0111913 · Cited by 4,710
The pollution of the marine environment by plastic debris: a review.
Derraik, J. G. B. (2002) · Marine Pollution Bulletin · doi:10.1016/s0025-326x(02)00220-5 · Cited by 4,042
Developmental Effects of Endocrine-Disrupting Chemicals in Wildlife and Humans
Colborn, T., Saal, F. S. V., & Soto, A. M. (1993) · Environmental Health Perspectives · doi:10.1289/ehp.93101378 · Cited by 3,570
Plastics, the environment and human health: current consensus and future trends
Thompson, R. C., Moore, C. J., Saal, F. S. V., & Swan, S. H. (2009) · Philosophical Transactions of the Royal Society B Biological Sciences · doi:10.1098/rstb.2009.0053 · Cited by 3,069
Microplastic ingestion by zooplankton
Cole, M., Lindeque, P., Fileman, E., Halsband, C., Goodhead, R., Moger, J., & Galloway, T. S. (2013) · Environmental Science & Technology · doi:10.1021/es400663f · Cited by 2,763
Eerkes-Medrano, D., Thompson, R. C., & Aldridge, D. C. (2015) · Water Research · doi:10.1016/j.watres.2015.02.012 · Cited by 2,638
Ingested plastic transfers hazardous chemicals to fish and induces hepatic stress
Rochman, C. M., Hoh, E., Kurobe, T., & Teh, S. J. (2013) · Scientific Reports · doi:10.1038/srep03263 · Cited by 2,169
Lusher, A. L., McHugh, M., & Thompson, R. C. (2013) · Marine Pollution Bulletin · doi:10.1016/j.marpolbul.2012.11.028 · Cited by 2,075
Research works printed but not linked: 3
- I Kinan, 2000, Abundance of plastic debris and ingestion by albatross on Kure Atoll, North-western Hawaiian Islands, Marine Ornithology, 28
- Hoss D, Settle L, editors. ingestion of plastics by teleost fishes. Second International Conference on Marine Debris; 1989; Honolulu, Hawaii. USA1990.
- AR Emery, 1973, Comparative Ecology and Functional Osteology of Fourteen Species of Damselfish (Pisces: Pomacentridae) at Alligator Reef, Florida Keys, Bulletin of Marine Science, 23, 649
Cited by
Sorted by citations
Items 301–310 of 310
Teo, X. S., Lai, K. S., Kwik, J. T. B., Mowe, M. A. D., & Yeo, D. C. J. (2026) · Aquatic Ecology · doi:10.1007/s10452-026-10312-3
“Nevertheless, the results are still generally representative of trends displayed by the water, sediment and fish gut microplastics.”
InfluentialMicroplastics and their environmental effects across aquatic habitats to human
Arslan, P., Günal, A. Ç., & Faggio, C. (2026) · Elsevier eBooks · doi:10.1016/b978-0-443-45248-2.00020-1
Ndlovu, I. S., Christison, K. W., Vosloo, D., & Vosloo, A. (2026) · Frontiers in Physiology · doi:10.3389/fphys.2026.1826309
“…aquarium-maintained fi sh. PVC pipes, cleaning agents, and other materials used in aquarium maintenance can leach phthalates into the water, which are then absorbed by fi sh through the skin, gills, or ingestion (Xu et al., 2018; Critchell and Hoogenboom, 2018; Przybylin ́ ska and Wyszkowski, 2016).”
Gomes, R. V. C., Bolotas, D., Ramos, J., Grade, A., Ambrosino, A. C., Chainho, T., Raimundo, J., Barata, M., Pousão‐Ferreira, P., Lourenço, S., et al. (2026) · Aquatic Toxicology · doi:10.1016/j.aquatox.2026.107976
Hodkovicová, N., Hollerová, A., Gebauer, J., Crhánová, M., Šťastný, K., Svobodová, Z., & Faldyna, M. (2026) · Veterinární Medicína · doi:10.17221/85/2025-vetmed
“For example, increased locomotor activity has been associated with aggression (Critchell and Hoogenboom 2018).”
Khan, F. R., Nchimbi, A. A., Mbugani, J. J., & Shilla, D. A. (2026) · Marine Pollution Bulletin · doi:10.1016/j.marpolbul.2026.120304
MIKROPLASTIK W MORZU BAŁTYCKIM – STAN WIEDZY NA TEMAT METOD, ANALIZY I OCENY RYZYKA EKOLOGICZNEGO
Dereszewska, A., Heimowska, A., Krasowska, K., & Popek, M. (2025) · Rocznik Bezpieczeństwa Morskiego · doi:10.5604/01.3001.0055.3310
Capangpangan, R. Y., & Alguno, A. C. (2026) · Springer eBooks · doi:10.1007/978-3-032-28978-0_5
Diversity and Vulnerability of Reef Fishes in Marginal and Extreme Habitats
Morais, J., Siqueira, A. C., Rocha, L. A., Medeiros, A. P. M., Cardoso, A. P. L. R., & Santos, B. A. (2026) · Coral reefs of the world · doi:10.1007/978-3-032-28035-0_3
Suresh, A., Sarasamma, J. D., Williams, E. S., Prasad, V., S., A. P., & Krishnan, A. (2026) · Environmental Monitoring and Assessment · doi:10.1007/s10661-026-15930-w
“These small particles are highly bio-available via prey mimicry or passive “gulping” (Yin et al., 2022; Critchell & Hoogenboom, 2018).”
Metadata
- Authors
- Critchell, K., & Hoogenboom, M. O.
- Affiliations
- James Cook University (AU)
- ARC Centre of Excellence for Coral Reef Studies (AU)
- Corresponding author
- Critchell, Kay
- Venue
- PLOS ONE
- Publisher
- Public Library of Science (PLoS)
- Published
- 2018-03-01
- Volume
- 13
- Issue
- 3
- Pages
- e0193308
- ISSN
- 1932-6203 (ISSN-L)
- PMC
- PMC5832226
- OpenAlex
- W2793168889
- Cited by
- 310
- References
- 79
- Citations by year
- 2026: 26 · 2025: 46 · 2024: 32 · 2023: 43 · 2022: 45 · 2021: 49 · 2020: 41 · 2019: 24 · 2018: 3
- FWCI
- 10.98
- Type
- journal article
- Language
- en
- Update notices
- correction (2024-07-02)
- Open access
- gold
- doi.org
- Licence
- Locations
- PLoS ONE (publishedVersion, cc-by)
- PubMed Central (publishedVersion, cc-by)
- PubMed (publishedVersion)
- ResearchOnline at James Cook University (James Cook University) (submittedVersion)
- DOAJ (DOAJ: Directory of Open Access Journals) (submittedVersion)
- Own your potential (DEAKIN) (submittedVersion)
- Figshare (submittedVersion, cc-by)
- Topics
- Physical Sciences › Environmental Science › Pollution › Microplastics and Plastic Pollution
- Physical Sciences › Environmental Science › Health, Toxicology and Mutagenesis › Environmental Toxicology and Ecotoxicology
- Physical Sciences › Environmental Science › Ecology › Coral and Marine Ecosystems Studies
- Keywords
- microplastics, Acanthochromis polyacanthus, juvenile fish, body condition, fish growth, fish behavior, plastic ingestion, gastrointestinal tract, plastic particle size, coral reef fish, food webs
- MeSH terms
- Animals, Behavior, Animal, Body Composition, Environmental Monitoring, Particle Size, Perciformes, Plankton, Plastics, Water Pollutants, Chemical, Ecosystem, Food Chain, Gastrointestinal Tract
About these checks
Registry, retraction, Cites and statistics results are computed, not judged, with one exception: a printed reference that no index lists is read once by a model before it counts as a citation error. Claims are extracted by a model and kept only when their quote appears verbatim in the text; each cited source is then checked, with a model’s help, for whether it says what the claim relies on. Those verdicts can be wrong — read the claim’s quote and the cited source before relying on one.
Statistics and arithmetic are recomputed, not judged.
Confidence bands are shown only for fields calibrated on our annotated test set. None is calibrated yet, so no band is shown.
What counts as a claim ›How we measure confidence ›How we check this ›
Are you an author, or do you see a problem with this page? Request a review
