

The DOI matches its Crossref record; 74 of the 74 references it cites were found in a registry or an index.
Chronic oral application of a periodontal pathogen results in brain inflammation, neurodegeneration and amyloid beta production in wild type mice
Open accessAbstract
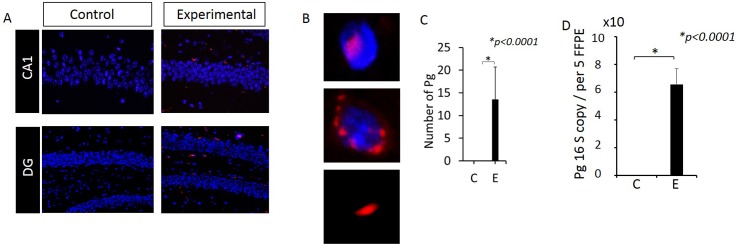
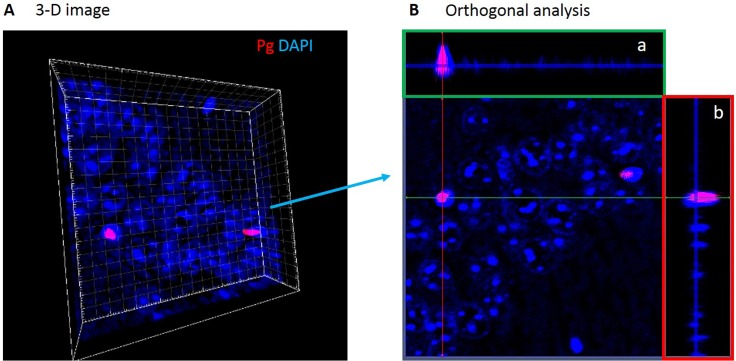
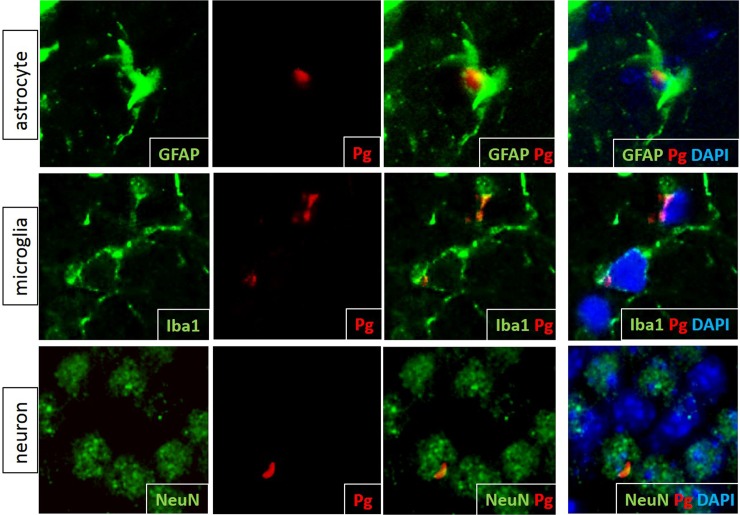
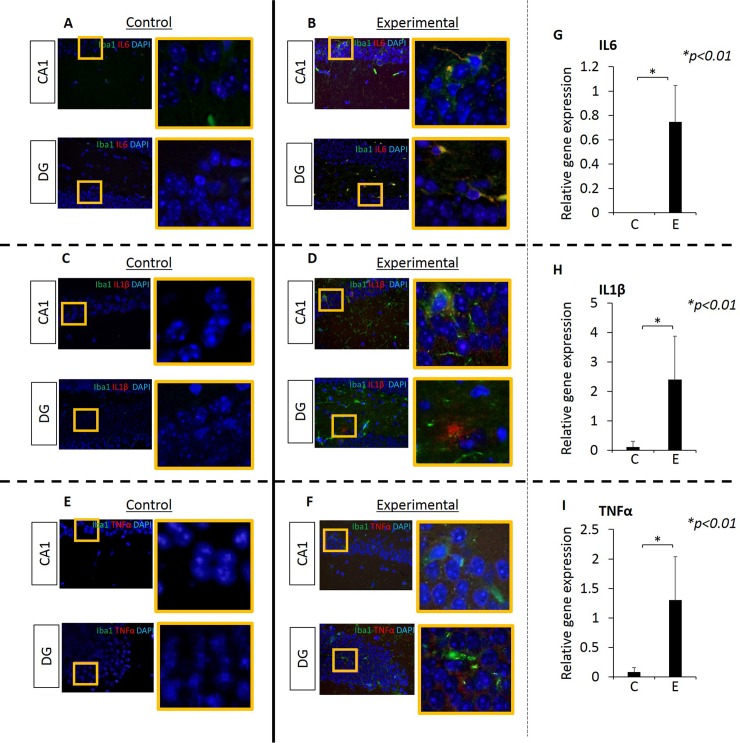
BACKGROUND: The results from cross sectional and longitudinal studies show that periodontitis is closely associated with cognitive impairment (CI) and Alzhemer's Disease (AD). Further, studies using animal model of periodontitis and human post-mortem brain tissues from subjects with AD strongly suggest that a gram-negative periodontal pathogen, Porphyromonas gingivalis (Pg) and/or its product gingipain is/are translocated to the brain. However, neuropathology resulting from Pg oral application is not known. In this work, we tested the hypothesis that repeated exposure of wild type C57BL/6 mice to orally administered Pg results in neuroinflammation, neurodegeneration, microgliosis, astrogliosis and formation of intra- and extracellular amyloid plaque and neurofibrillary tangles (NFTs) which are pathognomonic signs of AD. METHODS: Experimental chronic periodontitis was induced in ten wild type 8-week old C57BL/6 WT mice by repeated oral application (MWF/week) of Pg/gingipain for 22 weeks (experimental group). Another 10 wild type 8-week old C57BL/6 mice received vehicle alone (control group) MWF per week for 22 weeks. Brain tissues were collected and the presence of Pg/gingipain was determined by immunofluorescence (IF) microscopy, confocal microscopy, and quantitative PCR (qPCR). The hippocampi were examined for the signs of neuropathology related to AD: TNFα, IL1β, and IL6 expression (neuroinflammation), NeuN and Fluoro Jade C staining (neurodegeneration) and amyloid beta1-42 (Aβ42) production and phosphorylation of tau protein at Ser396 were assessed by IF and confocal microscopy. Further, gene expression of amyloid precursor protein (APP), beta-site APP cleaving enzyme 1 (BACE1), a disintegrin and metalloproteinase domain-containing protein10 (ADAM10) for α-secretase and presenilin1 (PSEN1) for ɣ-secretase, and NeuN (rbFox3) were determined by RT-qPCR. Microgliosis and astrogliosis were also determined by IF microscopy. RESULTS: Pg/gingipain was detected in the hippocampi of mice in the experimental group by immunohistochemistry, confocal microscopy, and qPCR confirming the translocation of orally applied Pg to the brain. Pg/gingipain was localized intra-nuclearly and peri-nuclearly in microglia (Iba1+), astrocytes (GFAP+), neurons (NeuN+) and was evident extracellularly. Significantly greater levels of expression of IL6, TNFα and IL1β were evident in experimental as compared to control group (p<0.01, p<0.00001, p<0.00001 respectively). In addition, microgliosis and astrogliosis were evident in the experimental but not in control group (p <0.01, p<0.0001 respectively). Neurodegeneration was evident in the experimental group based on a fewer number of intact neuronal cells assessed by NeuN positivity and rbFOX3 gene expression, and there was a greater number of degenerating neurons in the hippocampi of experimental mice assessed by Fluoro Jade C positivity. APP and BACE1 gene expression were increased in experimental group compared with control group (p<0.05, p<0.001 respectively). PSEN1 gene expression was higher in experimental than control group but the difference was not statistically significant (p = 0.07). ADAM10 gene expression was significantly decreased in experimental group compared with control group (p<0.01). Extracellular Aβ42 was detected in the parenchyma in the experimental but not in the control group (p< 0.00001). Finally, phospho-Tau (Ser396) protein was detected and NFTs were evident in experimental but not in the control group (p<0.00001). CONCLUSIONS: This study is the first to show neurodegeneration and the formation of extracellular Aβ42 in young adult WT mice after repeated oral application of Pg. The neuropathological features observed in this study strongly suggest that low grade chronic periodontal pathogen infection can result in the development of neuropathology that is consistent with that of AD.
Overview
The claims and statistics of this paper haven’t been checked yet.
Run the check — free, no account needed. It reads the open-access text and checks the sources it cites.
Integrity signals
Registry
Cites
Statistics
Figures
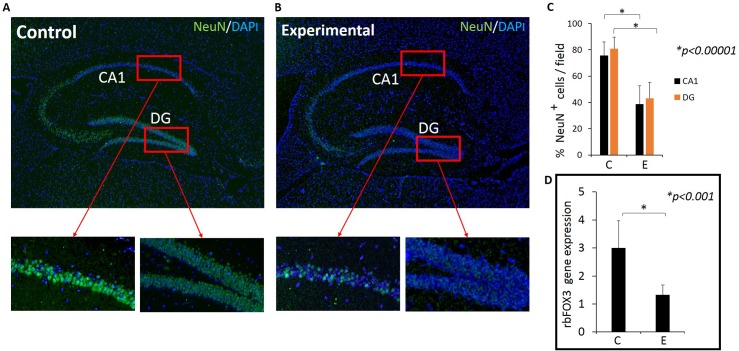
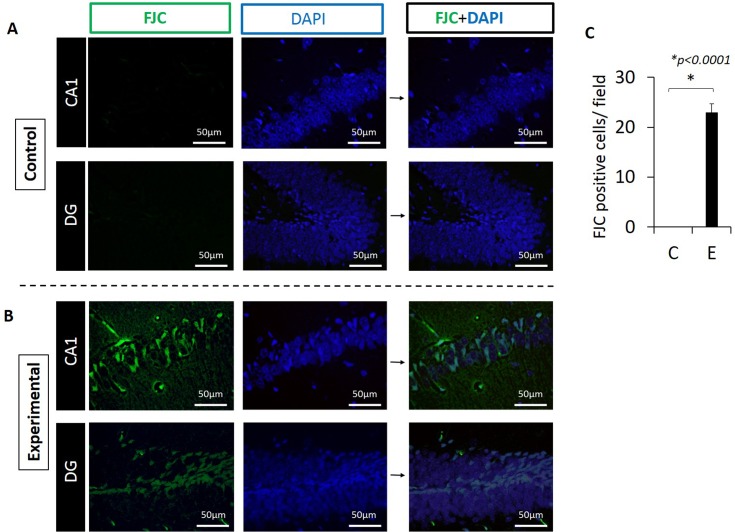
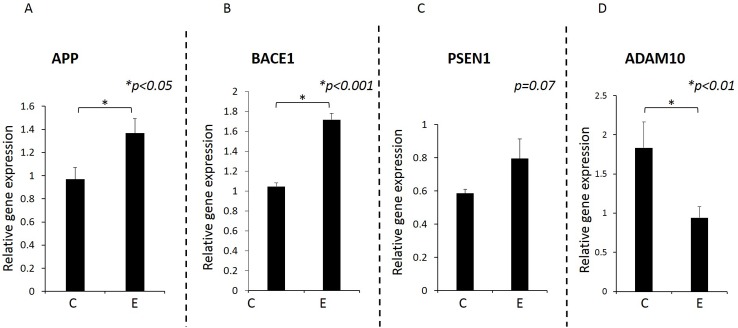
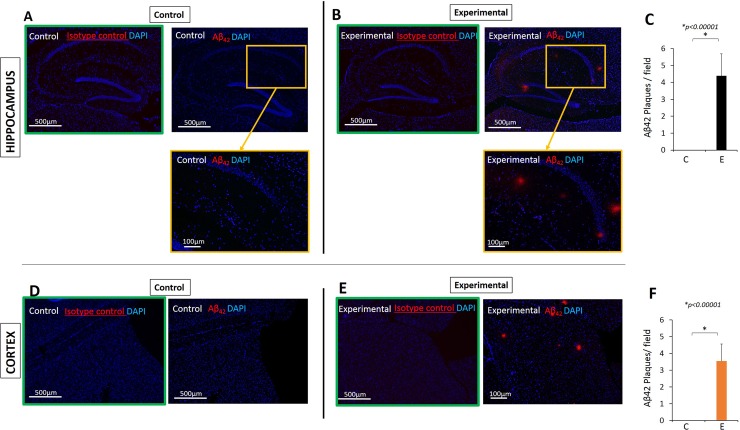
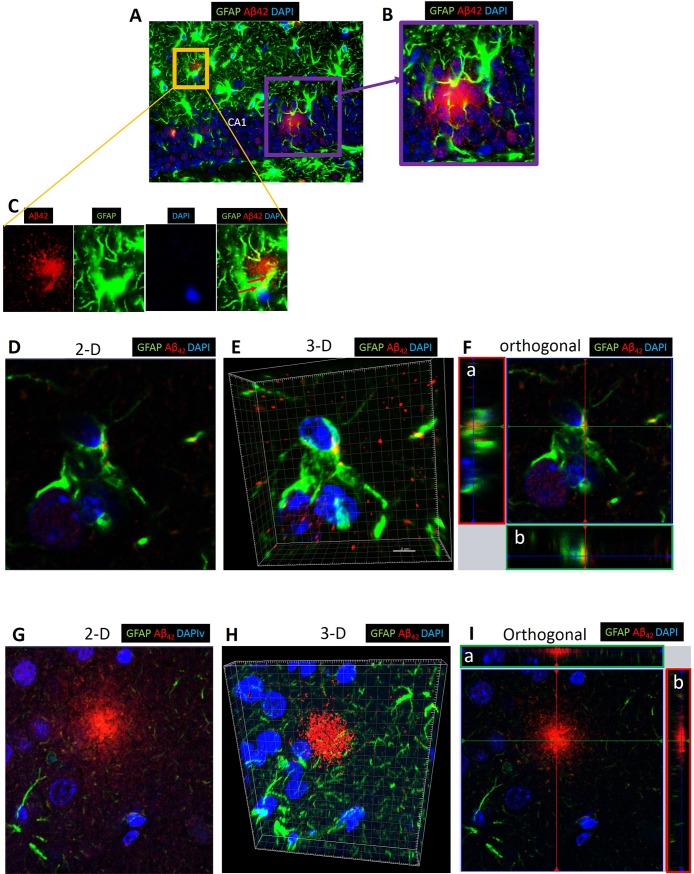
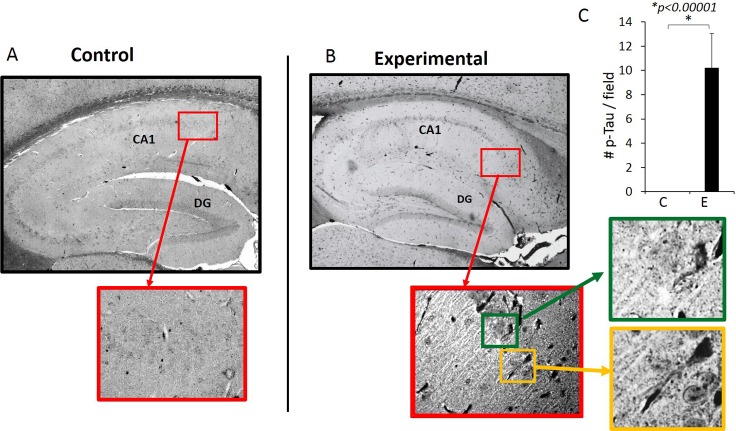
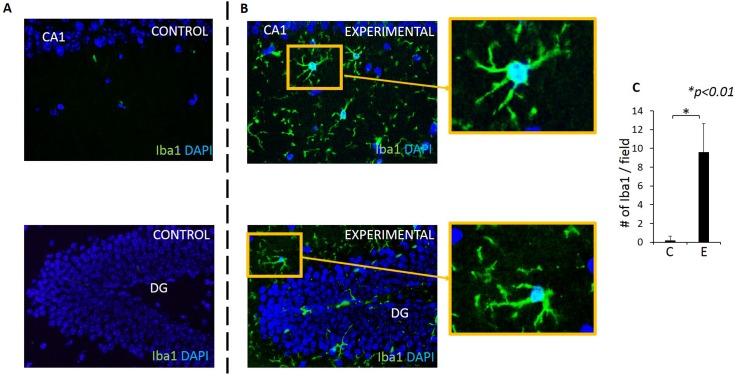
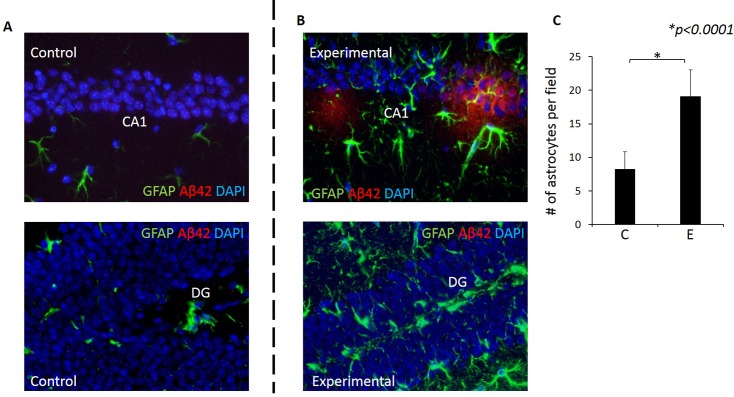
Verification
Claims the paper makes
The claims and statistics of this paper haven’t been checked yet.
Run the check — free, no account needed. It reads the open-access text and checks the sources it cites.
Claims other papers make about this one
Each is checked against this paper’s own text: does it say what the citing paper says it does?
In the citing paper
“There is a large increase in bacterial load and bacterial species in AD brains [79, 90], including P. gingivalis, which can live intracellularly in glia and neurons [91].”
From The endotoxin hypothesis of neurodegeneration (2019) · cites this paper as [91]
Self-check
Percentages, sums and reported differences re-computed from the paper’s own numbers.
The self-check needs the paper’s full text.
Citations
Cites
Clinical and biomarker changes in dominantly inherited Alzheimer's disease
Bateman, R. J., Xiong, C., Benzinger, T. L. S., Fagan, A. M., Goate, A., Fox, N. C., Marcus, D. S., Cairns, N. J., Xie, X., Blazey, T. M., et al. (2012) · New England Journal of Medicine · doi:10.1056/nejmoa1202753 · Cited by 3,814
Villemagne, V. L., Burnham, S., Bourgeat, P., Brown, B., Ellis, K. A., Salvado, O., Szoeke, C., Macaulay, S. L., Martins, R., Maruff, P., et al. (2013) · The Lancet Neurology · doi:10.1016/s1474-4422(13)70044-9 · Cited by 2,279
Update on Prevalence of Periodontitis in Adults in the United States: NHANES 2009 – 2012
Eke, P., Dye, B., Wei, L., Slade, G., Thornton-Evans, G., Borgnakke, W., Taylor, G., Page, R., Beck, J., & Genco, R. (2015) · The Journal of Periodontology · doi:10.1902/jop.2015.140520 · Cited by 1,442
Debris clearance by microglia: an essential link between degeneration and regeneration
Neumann, H., Kotter, M. R., & Franklin, R. J. M. (2008) · Brain · doi:10.1093/brain/awn109 · Cited by 1,111
Kumar, D. K. V., Choi, S. H., Washicosky, K. J., Eimer, W. A., Tucker, S., Ghofrani, J., Lefkowitz, A., McColl, G., Goldstein, L. E., Tanzi, R. E., et al. (2016) · Science Translational Medicine · doi:10.1126/scitranslmed.aaf1059 · Cited by 971
Bacteremia Associated With Toothbrushing and Dental Extraction
Lockhart, P. B., Brennan, M. T., Sasser, H. C., Fox, P. C., Paster, B. J., & Bahrani‐Mougeot, F. K. (2008) · Circulation · doi:10.1161/circulationaha.107.758524 · Cited by 847
APP mouse models for Alzheimer’s disease preclinical studies.
Sasaguri, H., Nilsson, P., Hashimoto, S., Nagata, K., Saito, T., De Strooper, B., Hardy, J., Vassar, R., Winblad, B., & Saido, T. C. (2017) · The EMBO Journal · doi:10.15252/embj.201797397 · Cited by 793
Lee, J. W., Lee, Y. K., Yuk, D. Y., Choi, D. Y., Ban, S. B., Oh, K. W., & Hong, J. T. (2008) · Journal of Neuroinflammation · doi:10.1186/1742-2094-5-37 · Cited by 772
apoE isoform–specific disruption of amyloid β peptide clearance from mouse brain
Deane, R., Sagare, A., Hamm, K., Parisi, M., Lane, S., Finn, M. B., Holtzman, D. M., & Zlokovic, B. V. (2008) · Journal of Clinical Investigation · doi:10.1172/jci36663 · Cited by 771
Forner, L. E., Larsen, T. E., Kilian, M., & Holmstrup, P. (2006) · Journal Of Clinical Periodontology · doi:10.1111/j.1600-051x.2006.00924.x · Cited by 769
Research works printed but not linked: 1
- CS Little, 2014, Detection of bacterial antigens and Alzheimer's disease-like pathology in the central nervous system of BALB/c mice following intranasal infection with a laboratory isolate of Chlamydia pneumoniae, Front Aging Neurosci, 6, 304, 10.3389/fnagi.2014.00304 · DOI · Paper page
Cited by
Sorted by citations
Neuroinflammation in Alzheimer disease
Heneka, M. T., van der Flier, W. M., Jessen, F., Hoozemanns, J., Thal, D. R., Boche, D., Brosseron, F., Teunissen, C., Zetterberg, H., Jacobs, A. H., et al. (2025) · Nature Reviews Immunology · doi:10.1038/s41577-024-01104-7 · Cited by 638
The endotoxin hypothesis of neurodegeneration
Brown, G. C. (2019) · Journal of Neuroinflammation · doi:10.1186/s12974-019-1564-7 · Cited by 457
Oral–Gut Microbiome Axis in Gastrointestinal Disease and Cancer
Park, S.-Y., Hwang, B.-O., Lim, M., Ok, S.-H., Lee, S., Chun, K., Park, K.-K., Hu, Y., Chung, W., & Song, N. (2021) · Cancers · doi:10.3390/cancers13092124 · Cited by 247
The Microbiome as a Modifier of Neurodegenerative Disease Risk
Fang, P., Kazmi, S. A., Jameson, K. G., & Hsiao, E. Y. (2020) · Cell Host & Microbe · doi:10.1016/j.chom.2020.06.008 · Cited by 226
Beydoun, M. A., Beydoun, H. A., Hossain, S., El-Hajj, Z. W., Weiss, J., & Zonderman, A. B. (2020) · Journal of Alzheimer's Disease · doi:10.3233/jad-200064 · Cited by 201
Periodontal microorganisms and Alzheimer disease – A causative relationship?
Jungbauer, G., Stähli, A., Zhu, X., Auber Alberi, L., Sculean, A., & Eick, S. (2022) · Periodontology 2000 · doi:10.1111/prd.12429 · Cited by 174
Time to test antibacterial therapy in Alzheimer’s disease
Panza, F., Lozupone, M., Solfrizzi, V., Watling, M., & Imbimbo, B. P. (2019) · Brain · doi:10.1093/brain/awz244 · Cited by 161
Periodontal disease as a possible cause for Alzheimer's disease
Kamer, A. R., Craig, R. G., Niederman, R., Fortea, J., & de Leon, M. J. (2020) · Periodontology 2000 · doi:10.1111/prd.12327 · Cited by 159
Kim, H. S., Kim, S., Shin, S. J., Park, Y. H., Nam, Y., Lee, K. W., Lee, K. W., Kim, S., Yang, H. D., Yang, H. D., et al. (2021) · Translational Neurodegeneration · doi:10.1186/s40035-021-00273-y · Cited by 168
Microglial priming of antigen presentation and adaptive stimulation in Alzheimer’s disease
Das, R., & Chinnathambi, S. (2019) · Cellular and Molecular Life Sciences · doi:10.1007/s00018-019-03132-2 · Cited by 147
Zhang, W., Qu, W., Wang, H., & Yan, H. (2021) · Translational Psychiatry · doi:10.1038/s41398-021-01254-5 · Cited by 155
Singhrao, S. K., & Olsen, I. (2019) · Journal of Oral Microbiology · doi:10.1080/20002297.2018.1563405 · Cited by 145
The Immunopathogenesis of Alzheimer’s Disease Is Related to the Composition of Gut Microbiota
Leblhuber, F., Ehrlich, D., Steiner, K., Geisler, S., Fuchs, D., Lanser, L., & Kurz, K. (2021) · Nutrients · doi:10.3390/nu13020361 · Cited by 149
Molecular Strategies Underlying Porphyromonas gingivalis Virulence
Silva, I. L., & Cascalès, E. (2021) · Journal of Molecular Biology · doi:10.1016/j.jmb.2021.166836 · Cited by 146
Gong, T., Chen, Q., Mao, H., Zhang, Y., Ren, H., Xu, M., Chen, H., & Yang, D. (2022) · Frontiers in Cellular and Infection Microbiology · doi:10.3389/fcimb.2022.925435 · Cited by 138
Sun, L., Ma, L., Zhang, H., Cao, Y., Wang, C., Hou, N., Huang, N., von Deneen, K. M., Zhao, C., Shi, Y., et al. (2019) · Theranostics · doi:10.7150/thno.31562 · Cited by 139
The endotoxin hypothesis of Alzheimer’s disease
Brown, G. C., & Heneka, M. T. (2024) · Molecular Neurodegeneration · doi:10.1186/s13024-024-00722-y · Cited by 148
Wang, R. P., Huang, J., Chan, K. W. Y., Leung, W. K., Goto, T., Ho, J. Y. S., & Chang, R. C. (2023) · Journal of Neuroinflammation · doi:10.1186/s12974-023-02747-4 · Cited by 149
The Oral-Gut-Brain AXIS: The Influence of Microbes in Alzheimer’s Disease
Narengaowa, Kong, W., Lan, F., Awan, M. U. F., Qing, H., & Ni, J. (2021) · Frontiers in Cellular Neuroscience · doi:10.3389/fncel.2021.633735 · Cited by 134
Periodontal Health and Disease in the Context of Systemic Diseases
Isola, G., Santonocito, S., Lupi, S. M., Polizzi, A., Sclafani, R., Patini, R., & Marchetti, E. (2023) · Mediators of Inflammation · doi:10.1155/2023/9720947 · Cited by 140
Systemic inflammation linking chronic periodontitis to cognitive decline
Wang, R. P., Ho, J. Y. S., Leung, W. K., Goto, T., & Chang, R. C. (2019) · Brain Behavior and Immunity · doi:10.1016/j.bbi.2019.07.002 · Cited by 129
Potential Bidirectional Relationship Between Periodontitis and Alzheimer’s Disease
Liccardo, D., Marzano, F., Carraturo, F., Guida, M., Femminella, G. D., Bencivenga, L., Agrimi, J., Addonizio, A., Melino, I., Valletta, A., et al. (2020) · Frontiers in Physiology · doi:10.3389/fphys.2020.00683 · Cited by 148
Lei, S., Li, J., Yu, J., Li, F., Pan, Y., Chen, X., Ma, C., Zhao, W., & Tang, X. (2023) · International Journal of Oral Science · doi:10.1038/s41368-022-00215-y · Cited by 129
Neuroinflammation: A Distal Consequence of Periodontitis
Li, X., Kiprowska, M., Kansara, T., Kansara, P., & Li, P. (2022) · Journal of Dental Research · doi:10.1177/00220345221102084 · Cited by 128
Decreased salivary lactoferrin levels are specific to Alzheimer's disease
González‐Sánchez, M., Bartolomé, F. B., Antequera, D., Puertas‐Martín, V., González, P., Gómez‐Grande, A., Velasco, S. L., Martín, A. H. S., Pérez-Martínez, D. A., Villarejo‐Galende, A., et al. (2020) · EBioMedicine · doi:10.1016/j.ebiom.2020.102834 · Cited by 116
Haditsch, U., Roth, T., Rodriguez, L., Hancock, S., Cecere, T. E., Nguyen, M., Arastu‐Kapur, S., Broce, S., Raha, D., Lynch, C. C., et al. (2020) · Journal of Alzheimer s Disease · doi:10.3233/jad-200393 · Cited by 116
Oral Microbiota: A Major Player in the Diagnosis of Systemic Diseases
Thomas, C., Minty, M., Vinel, A., Canceill, T., Loubières, P., Burcelin, R., Kaddech, M., Blasco‐Baqué, V., & Laurencin‐Dalicieux, S. (2021) · Diagnostics · doi:10.3390/diagnostics11081376 · Cited by 122
Patrick, K. L., Bell, S. L., Weindel, C. G., & Watson, R. O. (2019) · Frontiers in Cellular and Infection Microbiology · doi:10.3389/fcimb.2019.00138 · Cited by 110
Porphyromonas gingivalis Infection Induces Amyloid-β Accumulation in Monocytes/Macrophages
Nie, R., Wu, Z., Ni, J., Zeng, F., Yu, W., Zhang, Y., Kadowaki, T., Kashiwazaki, H., Teeling, J. L., & Zhou, Y. (2019) · Journal of Alzheimer s Disease · doi:10.3233/jad-190298 · Cited by 114
Sansores‐España, L. D., Melgar‐Rodríguez, S., Sagredo-Olivares, K., Cafferata, E. A., Martínez-Aguilar, V. M., Vernal, R., Paula-Lima, A. C., & Díaz‐Zúñiga, J. (2021) · Frontiers in Aging · doi:10.3389/fragi.2021.781582 · Cited by 110
Microbial Infections Are a Risk Factor for Neurodegenerative Diseases
Lotz, S. K., Blackhurst, B. M., Reagin, K. L., & Funk, K. E. (2021) · Frontiers in Cellular Neuroscience · doi:10.3389/fncel.2021.691136 · Cited by 100
Hashioka, S., Inoue, K., Miyaoka, T., Hayashida, M., Wake, R., Oh‐Nishi, A., & Inagaki, M. (2019) · International Journal of Molecular Sciences · doi:10.3390/ijms20153723 · Cited by 99
Nonaka, S., Kadowaki, T., & Nakanishi, H. (2022) · Neurochemistry International · doi:10.1016/j.neuint.2022.105282 · Cited by 99
Porphyromonas gingivalis and Alzheimer disease: Recent findings and potential therapies
Ryder, M. I. (2020) · Journal of Periodontology · doi:10.1002/jper.20-0104 · Cited by 104
Oral frailty and neurodegeneration in Alzheimer’s disease
Lozupone, M., Panza, F., Dibello, V., Manfredini, D., Dibello, A., Zupo, R., Sardone, R., Daniele, A., & Lobbezoo, F. (2021) · Neural Regeneration Research · doi:10.4103/1673-5374.310672 · Cited by 96
Porphyromonas gingivalis and the pathogenesis of Alzheimer’s disease
Liu, S., Butler, C. A., Ayton, S., Reynolds, E. C., & Dashper, S. G. (2023) · Critical Reviews in Microbiology · doi:10.1080/1040841x.2022.2163613 · Cited by 94
Self-citationLinking mechanisms of periodontitis to Alzheimer's disease
Sadrameli, M., Bathini, P., & Alberi, L. A. (2020) · Current Opinion in Neurology · doi:10.1097/wco.0000000000000797 · Cited by 93
Singhrao, S. K., & Olsen, I. (2018) · Journal of Alzheimer s Disease Reports · doi:10.3233/adr-180080 · Cited by 94
Porphyromonas gingivalis is a Strong Risk Factor for Alzheimer’s Disease
Kanagasingam, S., Chukkapalli, S. S., Welbury, R. R., & Singhrao, S. K. (2020) · Journal of Alzheimer s Disease Reports · doi:10.3233/adr-200250 · Cited by 99
Díaz‐Zúñiga, J., More, J., Melgar‐Rodríguez, S., Jiménez-Unión, M., Villalobos-Orchard, F., Muñoz‐Manríquez, C., Monasterio, G., Valdés, J. L., Vernal, R., & Paula-Lima, A. C. (2020) · Frontiers in Immunology · doi:10.3389/fimmu.2020.588036 · Cited by 93
Hu, Y., Zhang, X., Zhang, J., Xia, X., Li, H., Qiu, C., Liao, Y., Chen, H., He, Z., Song, Z., et al. (2021) · Journal of Neuroinflammation · doi:10.1186/s12974-021-02071-9 · Cited by 87
Oral Microbiota Changes in Elderly Patients, an Indicator of Alzheimer’s Disease
Wu, Y., Lee, W.-F., Salamanca, E., Yao, W.-L., Su, J.-N., Wang, S.-Y., Hu, C., & Chang, W. (2021) · International Journal of Environmental Research and Public Health · doi:10.3390/ijerph18084211 · Cited by 85
Hu, Y., Li, H., Zhang, J., Zhang, X., Xia, X., Qiu, C., Liao, Y., Chen, H., Song, Z., & Zhou, W. (2020) · Frontiers in Neuroscience · doi:10.3389/fnins.2020.00658 · Cited by 81
Nadim, R., Tang, J., Dilmohamed, A., Yuan, S., Wu, C., Bakre, A. T., Partridge, M., Ni, J., Copeland, J. R., Anstey, K. J., et al. (2020) · European Journal of Epidemiology · doi:10.1007/s10654-020-00648-x · Cited by 81
Giordano-Kelhoffer, B., Lorca, C., March‐Llanes, J., Rábano, A., del Ser, T., Serra, A., & Gallart‐Palau, X. (2022) · Biomedicines · doi:10.3390/biomedicines10081803 · Cited by 89
Knock-on effect of periodontitis to the pathogenesis of Alzheimer’s disease?
Leblhuber, F., Huemer, J., Steiner, K., Gostner, J. M., & Fuchs, D. (2020) · Wiener klinische Wochenschrift · doi:10.1007/s00508-020-01638-5 · Cited by 77
Costa, M. J. F., de Araújo, I. D. T., Alves, L. D. R., da Silva, R. L., Calderón, P. D. S., Borges, B. C. D., Martins, A. R. L. D. A., Gurgel, B. C. D. V., & Lins, R. D. A. U. (2021) · Clinical Oral Investigations · doi:10.1007/s00784-020-03764-w · Cited by 79
Furutama, D., Matsuda, S., Yamawaki, Y., Hatano, S., Okanobu, A., Memida, T., Oue, H., Fujita, T., Ouhara, K., Kajiya, M., et al. (2020) · Brain Sciences · doi:10.3390/brainsci10100679 · Cited by 77
The impact of neuroinflammation on neuronal integrity
Tastan, B., & Heneka, M. T. (2024) · Immunological Reviews · doi:10.1111/imr.13419 · Cited by 81
Wu, H., Qiu, W., Zhu, X., Li, X., Xie, Z., Carreras, I., Dedeoglu, A., Dyke, T. E. V., Han, Y. W., Karimbux, N. Y., et al. (2022) · Frontiers in Aging Neuroscience · doi:10.3389/fnagi.2022.912709 · Cited by 73
Periodontal Pathogens and Their Links to Neuroinflammation and Neurodegeneration
Visentin, D., Gobin, I., & Maglica, Ž. (2023) · Microorganisms · doi:10.3390/microorganisms11071832 · Cited by 76
Oral microbiota and autism spectrum disorder (ASD)
Olsen, I., & Hicks, S. D. (2019) · Journal of Oral Microbiology · doi:10.1080/20002297.2019.1702806 · Cited by 74
Beydoun, M. A., Beydoun, H. A., Weiss, J., Hossain, S. A., El‐Hajj, Z. W., & Zonderman, A. B. (2020) · Molecular Psychiatry · doi:10.1038/s41380-020-0736-2 · Cited by 72
Zeng, F., Liu, Y., Huang, W., Qing, H., Kadowaki, T., Kashiwazaki, H., Ni, J., & Wu, Z. (2020) · Journal of Neurochemistry · doi:10.1111/jnc.15096 · Cited by 72
Díaz‐Zúñiga, J., Muñoz, Y., Melgar‐Rodríguez, S., More, J., Bruna, B., Lobos, P., Monasterio, G., Vernal, R., & Paula-Lima, A. C. (2019) · Journal of Oral Microbiology · doi:10.1080/20002297.2019.1586423 · Cited by 75
Mechanisms of Porphyromonas gingivalis to translocate over the oral mucosa and other tissue barriers
de Jongh, C. A., de Vries, T. J., Bikker, F. J., Gibbs, S., & Krom, B. P. (2023) · Journal of Oral Microbiology · doi:10.1080/20002297.2023.2205291 · Cited by 73
Microglial response to experimental periodontitis in a murine model of Alzheimer’s disease
Kantarcı, A., Tognoni, C. M., Yaghmoor, W., Marghalani, A. A., Stephens, D. N., Ahn, J.-Y., Carreras, I., & Dedeoglu, A. (2020) · Scientific Reports · doi:10.1038/s41598-020-75517-4 · Cited by 72
Pritchard, A. B., Fabian, Z., Lawrence, C. L., Morton, G., Crean, S., & Alder, J. E. (2022) · Journal of Alzheimer s Disease · doi:10.3233/jad-215054 · Cited by 72
Did the Brain and Oral Microbiota Talk to Each Other? A Review of the Literature
Maitre, Y., Micheneau, P., Delpierre, A., Mahalli, R., Guérin, M., Amador, G., & Denis, F. (2020) · Journal of Clinical Medicine · doi:10.3390/jcm9123876 · Cited by 65
Squitti, R., Faller, P., Hureau, C., Granzotto, A., White, A. R., & Kepp, K. P. (2021) · Journal of Alzheimer s Disease · doi:10.3233/jad-201556 · Cited by 67
Vascular Changes and Hypoxia in Periodontal Disease as a Link to Systemic Complications
Çelik, D. T., & Kantarcı, A. (2021) · Pathogens · doi:10.3390/pathogens10101280 · Cited by 71
Importance of oral health in mental health disorders: An updated review
Skallevold, H. E., Rokaya, N., Wongsirichat, N., & Rokaya, D. (2023) · Journal of Oral Biology and Craniofacial Research · doi:10.1016/j.jobcr.2023.06.003 · Cited by 72
Implications of gut and oral microbiota in neuroinflammatory responses in Alzheimer's disease
Bello-Corral, L., Gomes, L., Fernández-Fernández, J. A., Fernández-García, D., Verdejo, I. C., & Sánchez-Valdeón, L. (2023) · Life Sciences · doi:10.1016/j.lfs.2023.122132 · Cited by 73
Yang, J., Zhi, W., & Wang, L. (2024) · Molecules · doi:10.3390/molecules29122812 · Cited by 63
“Porphyromonas gingivalis (PG) is the main causative agent of periodontitis, and PG infection leads to tau hyperphosphorylation [111], with increased phosphorylation at the Ser396 [112] and Thr231 sites, which plays an important role in NFT lesions in AD [113].”
BackgroundProfiling the oral microbiomes in patients with Alzheimer's disease
Guo, H., Li, B., Yao, H., Liu, D., Chen, R., Zhou, S., Ji, Y., Zeng, L., & Du, M. (2021) · Oral Diseases · doi:10.1111/odi.14110 · Cited by 62
Association Between Oral Bacteria and Alzheimer’s Disease: A Systematic Review and Meta-Analysis
Liu, S., Dashper, S. G., & Zhao, R. (2022) · Journal of Alzheimer s Disease · doi:10.3233/jad-220627 · Cited by 65
Nara, P. L., Sindelar, D., Penn, M. S., Potempa, J., & Griffin, W. S. T. (2021) · Journal of Alzheimer's Disease · doi:10.3233/jad-210448 · Cited by 59
Porphyromonas gingivalis outside the oral cavity
Bregaint, S., Boyer, É., Fong, S. B., Meuric, V., Bonnaure‐Mallet, M., & Jolivet‐Gougeon, A. (2021) · Odontology · doi:10.1007/s10266-021-00647-8 · Cited by 63
Periodontal bacteria in the brain—Implication for Alzheimer's disease: A systematic review
Parra‐Torres, V., Melgar‐Rodríguez, S., Muñoz‐Manríquez, C., Sanhueza, B., Cafferata, E. A., Paula-Lima, A. C., & Díaz‐Zúñiga, J. (2021) · Oral Diseases · doi:10.1111/odi.14054 · Cited by 60
Sun, Y., Richmond, R. C., Chen, Y., & Mai, X. (2020) · PLoS ONE · doi:10.1371/journal.pone.0228206 · Cited by 59
Alzheimer disease and the periodontal patient: New insights, connections, and therapies
Ryder, M. I., & Xenoudi, P. (2021) · Periodontology 2000 · doi:10.1111/prd.12389 · Cited by 55
Verma, A., Azhar, G., Zhang, X., Patyal, P., Grishma, K. C., Sharma, S., Che, Y., & Wei, J. Y. (2023) · International Journal of Molecular Sciences · doi:10.3390/ijms24020950 · Cited by 55
Alzheimer’s Disease and Helicobacter pylori Infection: Inflammation from Stomach to Brain?
Albaret, G., Sifré, E., Floch, P., Layé, S., Aubert, A., Dubus, P. R., Martin, L. A., Giese, A., Salles, N., Mégraud, F., et al. (2019) · Journal of Alzheimer s Disease · doi:10.3233/jad-190496 · Cited by 56
Tang, Z., Liang, D., Cheng, M., Su, X., Liu, R., Zhang, Y., & Wu, H. (2020) · Journal of Molecular Neuroscience · doi:10.1007/s12031-020-01629-1 · Cited by 56
Li, C., Yu, R., & Ding, Y. (2022) · Frontiers in Cellular and Infection Microbiology · doi:10.3389/fcimb.2022.1026457 · Cited by 55
Maitre, Y., Mahalli, R., Micheneau, P., Delpierre, A., Amador, G., & Denis, F. (2021) · International Journal of Environmental Research and Public Health · doi:10.3390/ijerph182111157 · Cited by 55
The role of microglia in Alzheimer's disease and progress of treatment
Guan, Y., Zhang, L., Wang, S., Deng, Y., Zhou, H., Chen, D., & Zhang, L. (2022) · Ibrain · doi:10.1002/ibra.12023 · Cited by 52
Kim, H. S., Son, J. L., Lee, D., Tsai, J., Wang, D., Chocrón, E. S., Jeong, S., Kittrell, P., Murchison, C., Kennedy, R., et al. (2022) · BMC Neurology · doi:10.1186/s12883-022-02586-5 · Cited by 54
Psychobiotics and the Microbiota–Gut–Brain Axis: Where Do We Go from Here?
Binda, S., Tremblay, A., Iqbal, U., Kassem, O., Barz, M. L., Thomas, V., Bronner, S., Perrot, T. S., Ismail, N., & Parker, J. A. (2024) · Microorganisms · doi:10.3390/microorganisms12040634 · Cited by 62
Periodontal diseases and depression: A pre‐clinical in vivo study
Martínez, M., Martín‐Hernández, D., Virto, L., MacDowell, K. S., Montero, E., Bris, Á. G., Marín, M. J., Ambrosio, N., Herrera, D., Leza, J. C., et al. (2021) · Journal Of Clinical Periodontology · doi:10.1111/jcpe.13420 · Cited by 56
COR388 (atuzaginstat): an investigational gingipain inhibitor for the treatment of Alzheimer disease
Sabbagh, M. N., & Decourt, B. (2022) · Expert Opinion on Investigational Drugs · doi:10.1080/13543784.2022.2117605 · Cited by 51
The role of microbiome-host interactions in the development of Alzheimer´s disease
Weber, C., Dilthey, A., & Finzer, P. (2023) · Frontiers in Cellular and Infection Microbiology · doi:10.3389/fcimb.2023.1151021 · Cited by 51
González-Sanmiguel, J., Schuh, C. M. A. P., Muñoz-Montesino, C., Contreras‐Kallens, P., Aguayo, L. G., & Aguayo, S. D. (2020) · Cells · doi:10.3390/cells9112476 · Cited by 50
Su, X., Tang, Z., Lu, Z.-Y., Liu, Y., He, W., Jiang, J., Zhang, Y., & Wu, H. (2021) · Journal of Molecular Neuroscience · doi:10.1007/s12031-021-01827-5 · Cited by 47
Periodontal dysbiosis associates with reduced CSF Aβ42 in cognitively normal elderly
Kamer, A. R., Pushalkar, S., Gulivindala, D., Butler, T., Li, Y., Annam, K. R. C., Glodzik, L., Ballman, K. V., Corby, P. M. A., Blennow, K., et al. (2021) · Alzheimer s & Dementia Diagnosis Assessment & Disease Monitoring · doi:10.1002/dad2.12172 · Cited by 48
Thouvenot, K., Turpin, T., Taïlé, J., Clément, K., Meilhac, O., & Gonthier, M. (2022) · Biomolecules · doi:10.3390/biom12030378 · Cited by 51
Olsen, I., & Singhrao, S. K. (2019) · Journal of Oral Microbiology · doi:10.1080/20002297.2019.1676486 · Cited by 48
Zhou, X., Afzal, S., Wohlmuth, H., Münch, G. W., Leach, D. N., Low, M., & Li, C. G. (2022) · Molecules · doi:10.3390/molecules27123877 · Cited by 45
Qian, J., Lu, J., Cheng, S., Zou, X., Tao, Q., Wang, M., Wang, N., Zheng, L., Liao, W., Li, Y., et al. (2023) · npj Biofilms and Microbiomes · doi:10.1038/s41522-023-00462-9 · Cited by 47
Rubinstein, T., Brickman, A. M., Cheng, B., Burkett, S., Park, H., Annavajhala, M. K., Uhlemann, A., Andrews, H., Gutierrez, J., Paster, B. J., et al. (2024) · Alzheimer s & Dementia · doi:10.1002/alz.13683 · Cited by 45
Porphyromonas Gingivalis as a Risk Factor to Alzheimer’s Disease: A Systematic Review
Elwishahy, A., Antia, K., Bhusari, S., Ilechukwu, C., Horstick, O., & Winkler, V. F. (2021) · Journal of Alzheimer s Disease Reports · doi:10.3233/adr-200237 · Cited by 48
Li, R., Wang, J., Xiong, W., Luo, Y., Feng, H., Zhou, H., Peng, Y., He, Y., & Ye, Q. (2024) · Frontiers in Microbiology · doi:10.3389/fmicb.2024.1358179 · Cited by 45
Porphyromonas gingivalis-Induced Neuroinflammation in Alzheimer’s Disease
Olsen, I. (2021) · Frontiers in Neuroscience · doi:10.3389/fnins.2021.691016 · Cited by 41
A closer look at the mycobiome in Alzheimer’s disease: Fungal species, pathogenesis and transmission
Phuna, Z. X., & Madhavan, P. (2022) · European Journal of Neuroscience · doi:10.1111/ejn.15599 · Cited by 41
Yamaguchi, S., Murakami, T., Satoh, M., Komiyama, T., Ohi, T., Miyoshi, Y., Endo, K., Hiratsuka, T., Hara, A., Tatsumi, Y., et al. (2023) · Neurology · doi:10.1212/wnl.0000000000207579 · Cited by 42
Nonaka, S., & Nakanishi, H. (2020) · Neurochemistry International · doi:10.1016/j.neuint.2020.104840 · Cited by 41
Zhao, C., Kuraji, R., Ye, C., Gao, L., Radaic, A., Kamarajan, P., Taketani, Y., & Kapila, Y. L. (2023) · Journal of Neuroinflammation · doi:10.1186/s12974-023-02915-6 · Cited by 45
Recent Aspects of Periodontitis and Alzheimer’s Disease—A Narrative Review
Cichońska, D., Mazuś, M., & Kusiak, A. (2024) · International Journal of Molecular Sciences · doi:10.3390/ijms25052612 · Cited by 47
Plachokova, A. S., Gjaltema, J., Hagens, E., Hashemi, Z., Knüppe, T., Kootstra, T. J. M., Visser, A., & Bloem, B. R. (2024) · International Journal of Molecular Sciences · doi:10.3390/ijms25084504 · Cited by 45
Tang, Z., Cheng, X., Su, X., Wu, L., Cai, Q., & Wu, H. (2022) · Journal of Dental Research · doi:10.1177/00220345221076772 · Cited by 40
Metadata
- Authors
- Ilievski, V., Zuchowska, P. K., Green, S. J., Toth, P. T., Ragozzino, M. E., Le, K., Aljewari, H. W., O’Brien-Simpson, N. M., Reynolds, E. C., & Watanabe, K.
- Affiliations
- University of Illinois Chicago (US)
- The University of Melbourne (AU)
- Corresponding author
- Watanabe, Keiko
- ORCID
- Venue
- PLOS ONE
- Publisher
- Public Library of Science (PLoS)
- Published
- 2018-10-03
- Volume
- 13
- Issue
- 10
- Pages
- e0204941
- ISSN
- 1932-6203 (ISSN-L)
- PMC
- PMC6169940
- OpenAlex
- W2895374072
- Cited by
- 372
- References
- 74
- Citations by year
- 2026: 40 · 2025: 55 · 2024: 53 · 2023: 48 · 2022: 42 · 2021: 61 · 2020: 51 · 2019: 21 · 2018: 1
- FWCI
- 22.97
- Type
- journal article
- Language
- en
- Open access
- gold
- doi.org
- Licence
- Locations
- PLoS ONE (publishedVersion, cc-by)
- Europe PMC (PubMed Central) (publishedVersion, cc-by)
- PubMed Central (publishedVersion, cc-by)
- PubMed (publishedVersion)
- DOAJ (DOAJ: Directory of Open Access Journals) (submittedVersion, cc-by-sa)
- Figshare (submittedVersion, cc-by)
- Minerva Access (University of Melbourne) (submittedVersion, cc-by)
- Funders
- National Institutes of Health (R01DE021405)
- Topics
- Life Sciences › Neuroscience › Cellular and Molecular Neuroscience › Alzheimer's disease research and treatments
- Health Sciences › Dentistry › Periodontics › Oral microbiology and periodontitis research
- Life Sciences › Neuroscience › Neurology › Neuroinflammation and Neurodegeneration Mechanisms
- Keywords
- periodontitis, Porphyromonas gingivalis, gingipains, Alzheimer's disease, neuroinflammation, neurodegeneration, amyloid-beta, tau phosphorylation, microglial activation, astrocyte activation, amyloid plaques, neurofibrillary tangles, hippocampus, APP processing, BACE1, ADAM10
- MeSH terms
- ADAM10 Protein, Administration, Oral, Alzheimer Disease, Animals, Astrocytes, Cell Count, Cross-Sectional Studies, DNA-Binding Proteins, Encephalitis, Frontal Lobe, Gene Expression Regulation, Hippocampus, Male, Mice, Inbred C57BL, Nerve Tissue Proteins, Neurons, Nuclear Proteins, Peptide Fragments, Periodontitis, Amyloid beta-Peptides, Aspartic Acid Endopeptidases, tau Proteins, Porphyromonas gingivalis, Microglia, Intracellular Space, Mice, Presenilin-1, Amyloid Precursor Protein Secretases, Cognitive Dysfunction
About these checks
Registry, retraction, Cites and statistics results are computed, not judged, with one exception: a printed reference that no index lists is read once by a model before it counts as a citation error. Claims are extracted by a model and kept only when their quote appears verbatim in the text; each cited source is then checked, with a model’s help, for whether it says what the claim relies on. Those verdicts can be wrong — read the claim’s quote and the cited source before relying on one.
Statistics and arithmetic are recomputed, not judged.
Confidence bands are shown only for fields calibrated on our annotated test set. None is calibrated yet, so no band is shown.
What counts as a claim ›How we measure confidence ›How we check this ›
Are you an author, or do you see a problem with this page? Request a review
