

The DOI matches its Crossref record; 5 of the 5 references it cites were found in a registry or an index.
The effect of aging in primary human dermal fibroblasts
Overview
The claims and statistics of this paper haven’t been checked yet.
Run the check — free, no account needed. It reads the open-access text and checks the sources it cites.
Integrity signals
Registry
Cites
Statistics
Figures
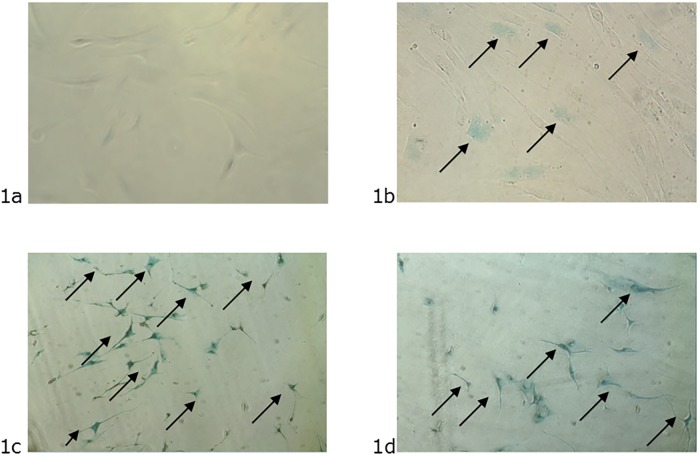
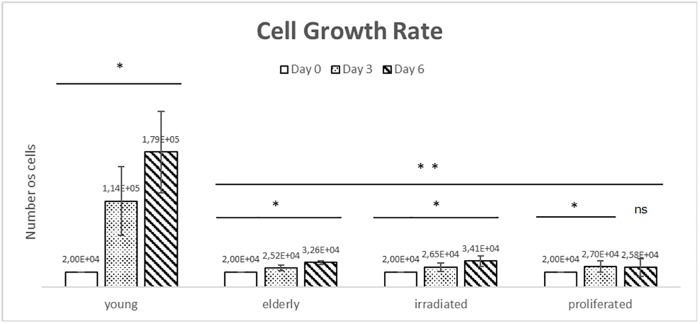
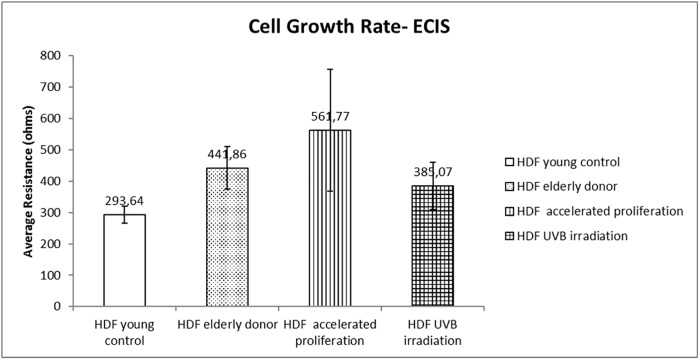
Verification
Claims the paper makes
The claims and statistics of this paper haven’t been checked yet.
Run the check — free, no account needed. It reads the open-access text and checks the sources it cites.
Claims other papers make about this one
Each is checked against this paper’s own text: does it say what the citing paper says it does?
The cited source doesn’t support the claim as written.
In the citing paper
“As shown previously (Varani et al., 2006; Lago and Puzzi, 2019), we found collagen I and IV were downregulated with age, with collagen IV demonstrating a more dramatic reduction.”
From Multi-omic rejuvenation of human cells by maturation phase transient reprogramming (2022) · cites this paper as Lago and Puzzi, 2019
Checked by a reasoning model — may be wrong.
Experimental — accuracy not yet measured
Self-check
Percentages, sums and reported differences re-computed from the paper’s own numbers.
The self-check needs the paper’s full text.
Citations
Cites
Biochemical and Biological Attributes of Matrix Metalloproteinases
Cui, N., Hu, M., & Khalil, R. A. (2017) · Progress in Molecular Biology and Translational Science · doi:10.1016/bs.pmbts.2017.02.005 · Cited by 1,359
Aubert, G., & Lansdorp, P. M. (2008) · Physiological Reviews · doi:10.1152/physrev.00026.2007 · Cited by 1,188
Tanaka, M., Yamamoto, Y., Misawa, E., Nabeshima, K., Saito, M., Yamauchi, K., Abe, F., & Furukawa, F. (2016) · Skin Pharmacology and Physiology · doi:10.1159/000454718 · Cited by 1,092
Morphological changes in nerve cells during normal aging
Pannese, E. (2011) · Brain Structure and Function · doi:10.1007/s00429-011-0308-y · Cited by 205
Quantitative assay of senescence-associated β-galactosidase activity in mammalian cell extracts
Gary, R. K., & Kindell, S. M. (2005) · Analytical Biochemistry · doi:10.1016/j.ab.2005.06.003 · Cited by 195
Research works printed but not linked: 10
- ED Lephart, 2018, A review of the role of estrogen in dermal aging and facial attractiveness in women, 10.1111/jocd.12508 · DOI · Paper page
- A Ibuki, 2018, Aging-like physiological changes in the skin of Japanese obese diabetic patients, Vol. 6
- S Hatem, 2018, Recent advances in antioxidant cosmeceutical topical delivery, 10.2174/1567201815666180214143551 · DOI
- W Kaisers, 2017, Age, gender and UV-exposition related effects on gene expression in in vivo aged short term cultivated human dermal fibroblasts, Vol. 12, e0175657
- H Chen, 2017, AKT and its related molecular feature in aged mice skin, Vol. 12, e0178969
- T Shoko, 2018, Anti-aging potential of extracts from Sclerocarya birrea (A. Rich.) Hochst and its chemical profiling by UPLC-Q-TOF-MS, Vol. 18, 54
- A Porcheron, 2013, Aspects of facial contrast decrease with age and are cues for age perception, Vol. 8, e57985
- H Abbas, 2018, Dermal anti-oxidant, anti-inflammatory and anti-aging effects of Compritol ATO-based Resveratrol colloidal carriers prepared using mixed surfactants, 10.1016/j.ijpharm.2018.01.054 · DOI
- L Subedi, 2017, Resveratrol-Enriched Rice Attenuates UVB-ROS-Induced Skin Aging via Downregulation of Inflammatory Cascades, Vol. 2017
- V Kostyuk, 2012, Photo-oxidation products of skin surface squalene mediate metabolic and inflammatory responses to solar UV in human keratinocytes, Vol. 7, e44472
Cited by
Sorted by citations
Nonlinear dynamics of multi-omics profiles during human aging
Shen, X., Wang, C., Zhou, X., Zhou, W., Hornburg, D., Wu, S., & Snyder, M. P. (2024) · Nature Aging · doi:10.1038/s43587-024-00692-2 · Cited by 500
Multi-omic rejuvenation of human cells by maturation phase transient reprogramming
Gill, D., Parry, A., Santos, F., Okkenhaug, H., Todd, C. D., Hernando-Herraez, I., Stubbs, T. M., Milagre, I., & Reik, W. (2022) · eLife · doi:10.7554/elife.71624 · Cited by 185
Buranasudja, V., Rani, D., Malla, A., Kobtrakul, K., & Vimolmangkang, S. (2021) · Scientific Reports · doi:10.1038/s41598-021-92958-7 · Cited by 112
Microneedles: A novel clinical technology for evaluating skin characteristics
Kim, S. H., Kim, J. H., Choi, Y. M., Seo, S. M., Jang, E. Y., Lee, S. J., Cho, S., Jeong, D. H., & Lee, K. H. (2024) · Skin Research and Technology · doi:10.1111/srt.13647 · Cited by 10
Metadata
- Authors
- Lago, J. C., & Puzzi, M. B.
- Venue
- PLOS ONE
- Publisher
- Public Library of Science (PLoS)
- Published
- 2019-07-03
- Volume
- 14
- Issue
- 7
- Pages
- e0219165
- ISSN
- 1932-6203
- PMC
- PMC6608952
- Cited by
- 168
- References
- 5
- Language
- en
About these checks
Registry, retraction, Cites and statistics results are computed, not judged, with one exception: a printed reference that no index lists is read once by a model before it counts as a citation error. Claims are extracted by a model and kept only when their quote appears verbatim in the text; each cited source is then checked, with a model’s help, for whether it says what the claim relies on. Those verdicts can be wrong — read the claim’s quote and the cited source before relying on one.
Statistics and arithmetic are recomputed, not judged.
Confidence bands are shown only for fields calibrated on our annotated test set. None is calibrated yet, so no band is shown.
What counts as a claim ›How we measure confidence ›How we check this ›
Are you an author, or do you see a problem with this page? Request a review
