

The DOI matches its Crossref record; 72 of the 73 references it cites were found in a registry or an index.
Fecal transplant prevents gut dysbiosis and anxiety-like behaviour after spinal cord injury in rats
Open accessAbstract
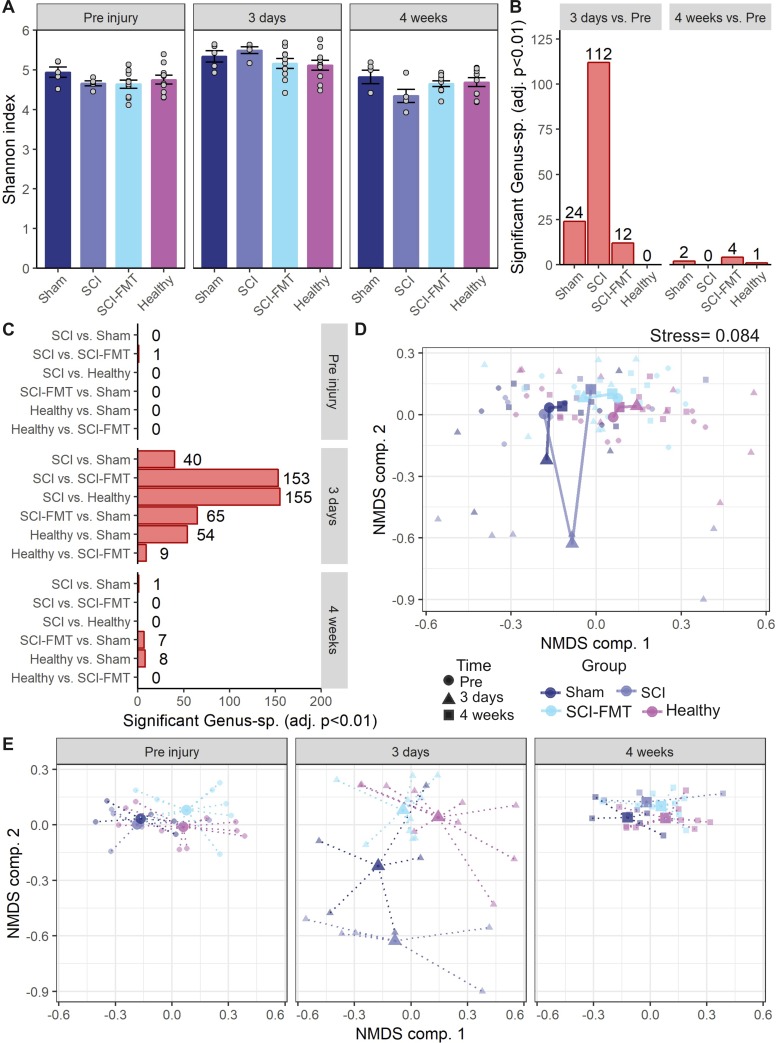
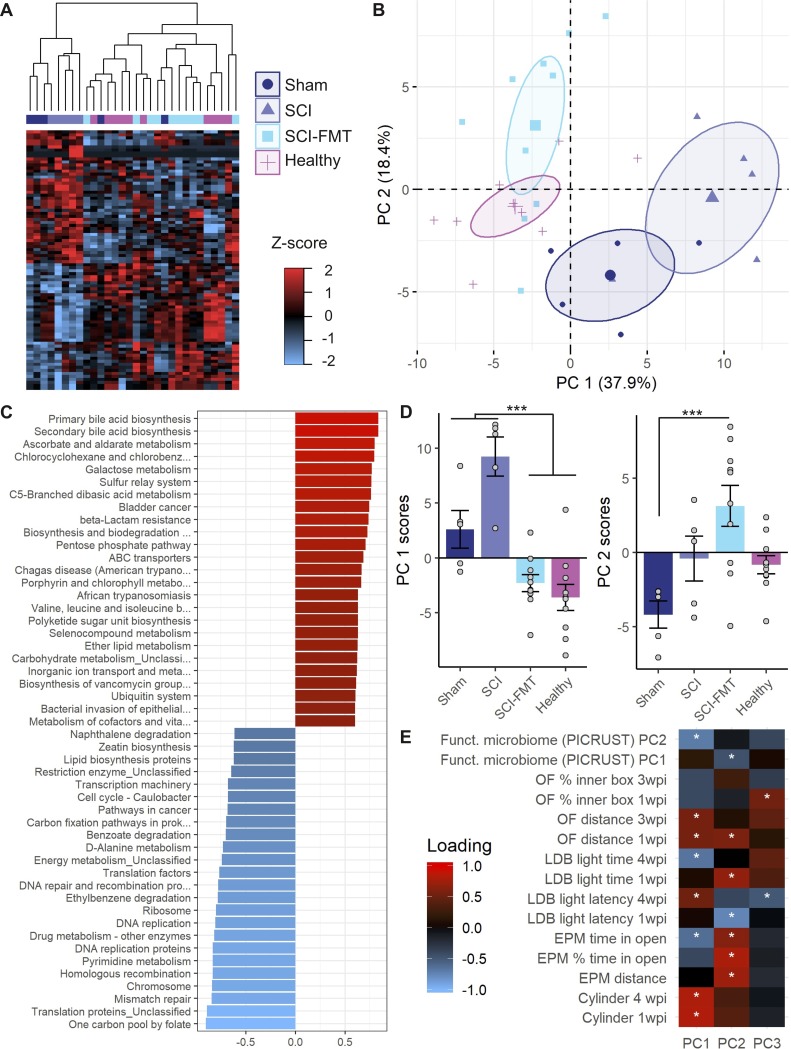
Secondary manifestations of spinal cord injury beyond motor and sensory dysfunction can negatively affect a person's quality of life. Spinal cord injury is associated with an increased incidence of depression and anxiety; however, the mechanisms of this relationship are currently not well understood. Human and animal studies suggest that changes in the composition of the intestinal microbiota (dysbiosis) are associated with mood disorders. The objective of the current study is to establish a model of anxiety following a cervical contusion spinal cord injury in rats and to determine whether the microbiota play a role in the observed behavioural changes. We found that spinal cord injury caused dysbiosis and increased symptoms of anxiety-like behaviour. Treatment with a fecal transplant prevented both spinal cord injury-induced dysbiosis as well as the development of anxiety-like behaviour. These results indicate that an incomplete unilateral cervical spinal cord injury can cause affective disorders and intestinal dysbiosis, and that both can be prevented by treatment with fecal transplant therapy.
Overview
The claims and statistics of this paper haven’t been checked yet.
Run the check — free, no account needed. It reads the open-access text and checks the sources it cites.
Integrity signals
Registry
Cites
Statistics
Figures
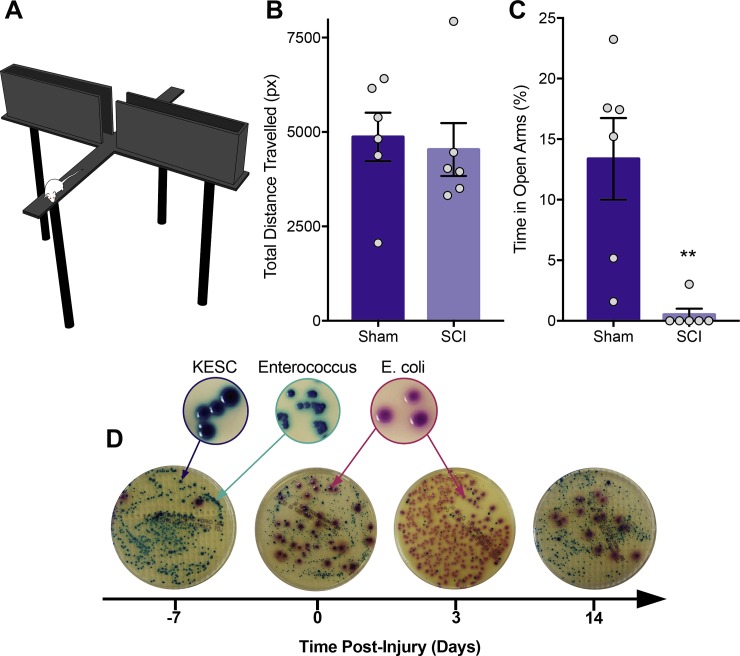
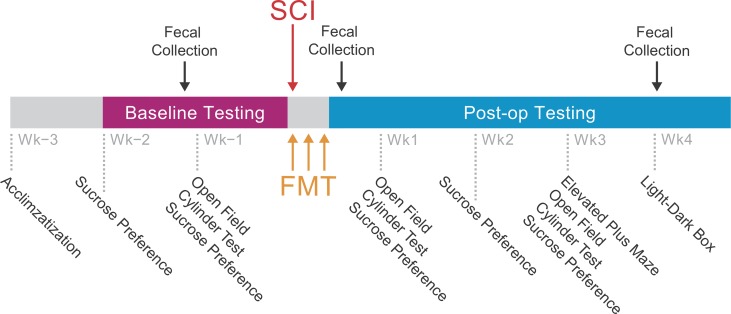
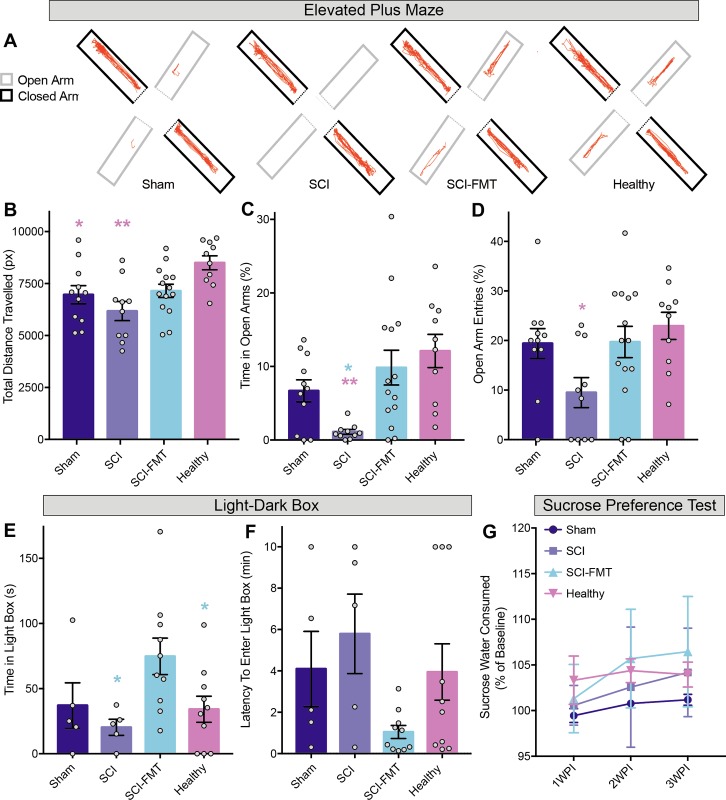
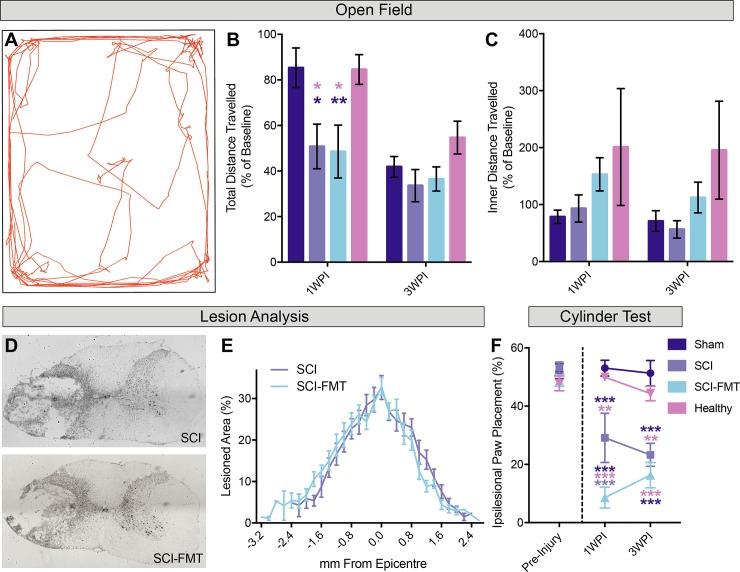
Verification
Claims the paper makes
The claims and statistics of this paper haven’t been checked yet.
Run the check — free, no account needed. It reads the open-access text and checks the sources it cites.
Claims other papers make about this one
Each is checked against this paper’s own text: does it say what the citing paper says it does?
In the citing paper
“FMT was reported to decrease antibiotic, chemotherapy, and injury-induced gut permeability and increased the prevalence of specific microbiota strains exhibiting anti-inflammatory properties.195,196”
From Regulation of Intestinal Barrier Function by Microbial Metabolites (2021) · cites this paper as [196]
Self-check
Percentages, sums and reported differences re-computed from the paper’s own numbers.
The self-check needs the paper’s full text.
Citations
Cites
limma powers differential expression analyses for RNA-sequencing and microarray studies
Ritchie, M. E., Phipson, B., Wu, D., Hu, Y., Law, C. W., Shi, W., & Smyth, G. K. (2015) · Nucleic Acids Research · doi:10.1093/nar/gkv007 · Cited by 40,458
vegan: Community Ecology Package
Oksanen, J., Simpson, G. L., Blanchet, F. G., Kindt, R., Legendre, P., Minchin, P. R., O’Hara, R. B., Sólymos, P., Stevens, M. H. H., Szöcs, E., et al. (2001) · doi:10.32614/cran.package.vegan · Cited by 27,099
phyloseq: An R Package for Reproducible Interactive Analysis and Graphics of Microbiome Census Data
McMurdie, P. J., & Holmes, S. (2013) · PLoS ONE · doi:10.1371/journal.pone.0061217 · Cited by 21,942
Schloss, P. D., Westcott, S. L., Ryabin, T., Hall, J. R., Hartmann, M., Hollister, E. B., Lesniewski, R. A., Oakley, B. B., Parks, D. H., Robinson, C. J., et al. (2009) · Applied and Environmental Microbiology · doi:10.1128/aem.01541-09 · Cited by 19,549
Predictive functional profiling of microbial communities using 16S rRNA marker gene sequences
Langille, M. G. I., Zaneveld, J., Caporaso, J. G., McDonald, D., Knights, D., Reyes, J. A., Clemente, J. C., Burkepile, D. E., Vega Thurber, R. L., Knight, R., et al. (2013) · Nature Biotechnology · doi:10.1038/nbt.2676 · Cited by 9,116
Molecular Mechanisms of Depression: Perspectives on New Treatment Strategies
Lang, U. E., & Borgwardt, S. (2013) · Cellular Physiology and Biochemistry · doi:10.1159/000350094 · Cited by 8,526
From inflammation to sickness and depression: when the immune system subjugates the brain
Dantzer, R., O'Connor, J. C., Freund, G. G., Johnson, R. W., & Kelley, K. W. (2008) · Nature Reviews Neuroscience · doi:10.1038/nrn2297 · Cited by 7,395
Validation of open:closed arm entries in an elevated plus-maze as a measure of anxiety in the rat
Pellow, S., Chopin, P., File, S. E., & Briley, M. (1985) · Journal of Neuroscience Methods · doi:10.1016/0165-0270(85)90031-7 · Cited by 5,822
A Meta-Analysis of Cytokines in Major Depression
Dowlati, Y., Herrmann, N., Swardfager, W., Liu, H., Sham, L., Reim, E. K., & Lanctôt, K. L. (2010) · Biological Psychiatry · doi:10.1016/j.biopsych.2009.09.033 · Cited by 4,729
Inflammation and Its Discontents: The Role of Cytokines in the Pathophysiology of Major Depression
Miller, A. H., Maletic, V., & Raison, C. L. (2009) · Biological Psychiatry · doi:10.1016/j.biopsych.2008.11.029 · Cited by 3,848
Research works printed but not linked: 1
- R Studio Team, 2015, RStudio: integrated development for R
Cited by
Sorted by citations
The Role of Microbiota-Gut-Brain Axis in Neuropsychiatric and Neurological Disorders
Socała, K., Doboszewska, U., Szopa, A., Serefko, A., Włodarczyk, M., Zielińska, A., Poleszak, E., Fichna, J., & Wlaź, P. (2021) · Pharmacological Research · doi:10.1016/j.phrs.2021.105840 · Cited by 857
Regulation of Intestinal Barrier Function by Microbial Metabolites
Ghosh, S., Whitley, C. S., Haribabu, B., & Jala, V. R. (2021) · Cellular and Molecular Gastroenterology and Hepatology · doi:10.1016/j.jcmgh.2021.02.007 · Cited by 835
Effect of fecal microbiota transplant on symptoms of psychiatric disorders: a systematic review
Chinna Meyyappan, A., Forth, E., Wallace, C. J. K., & Milev, R. (2020) · BMC Psychiatry · doi:10.1186/s12888-020-02654-5 · Cited by 254
The Role of Gut Dysbiosis in the Pathophysiology of Neuropsychiatric Disorders
Anand, N., Gorantla, V. R., & Chidambaram, S. B. (2022) · Cells · doi:10.3390/cells12010054 · Cited by 194
The neuroanatomical–functional paradox in spinal cord injury
Fouad, K., Popovich, P. G., Kopp, M. A., & Schwab, J. M. (2020) · Nature Reviews Neurology · doi:10.1038/s41582-020-00436-x · Cited by 163
Self-citationGheorghe, C. E., Ritz, N. L., Martin, J. A., Wardill, H. R., Cryan, J. F., & Clarke, G. A. (2021) · Gut Microbes · doi:10.1080/19490976.2021.1941711 · Cited by 156
Gut Microbiota Interaction with the Central Nervous System throughout Life
Ojeda, J., Ávila, A., & Vidal, P. M. (2021) · Journal of Clinical Medicine · doi:10.3390/jcm10061299 · Cited by 112
Settanni, C. R., Ianiro, G., Bibbò, S., Cammarota, G., & Gasbarrini, A. (2021) · Progress in Neuro-Psychopharmacology and Biological Psychiatry · doi:10.1016/j.pnpbp.2021.110258 · Cited by 106
Glial-Neuronal Interactions in Pathogenesis and Treatment of Spinal Cord Injury
Lukáčová, N., Kisucká, A., Bimbová, K., Bačová, M., Ileninová, M., Kuruc, T., & Gálik, J. (2021) · International Journal of Molecular Sciences · doi:10.3390/ijms222413577 · Cited by 94
Green, J. E., Berk, M., Mohebbi, M., Loughman, A., McGuinness, A. J., Castle, D. J., Chatterton, M. L., Perez, J., Strandwitz, P., Athan, E., et al. (2023) · The Canadian Journal of Psychiatry · doi:10.1177/07067437221150508 · Cited by 87
Gut Microbiota and Acute Central Nervous System Injury: A New Target for Therapeutic Intervention
Yuan, B., Lu, X., & Wu, Q. (2021) · Frontiers in Immunology · doi:10.3389/fimmu.2021.800796 · Cited by 92
Review of microbiota gut brain axis and innate immunity in inflammatory and infective diseases
Yuan, C., He, Y., Xie, K., Feng, L., Gao, S., & Cai, L. (2023) · Frontiers in Cellular and Infection Microbiology · doi:10.3389/fcimb.2023.1282431 · Cited by 87
Gut-brain axis: A matter of concern in neuropsychiatric disorders…!
Naveed, M., Zhou, Q.-G., Chu, X., Taleb, A., Meng, F. J., Ahmed, B., Zhang, Y., Fukunaga, K., & Han, F. (2020) · Progress in Neuro-Psychopharmacology and Biological Psychiatry · doi:10.1016/j.pnpbp.2020.110051 · Cited by 82
Gastrointestinal Microbiome and Neurologic Injury
Panther, E. J., Dodd, W., Clark, A., & Lucke-Wold, B. P. (2022) · Biomedicines · doi:10.3390/biomedicines10020500 · Cited by 77
Fecal Microbiota Transplantation and Other Gut Microbiota Manipulation Strategies
Quaranta, G., Guarnaccia, A., Fancello, G., Agrillo, C., Iannarelli, F., Sanguinetti, M., & Masucci, L. (2022) · Microorganisms · doi:10.3390/microorganisms10122424 · Cited by 72
Du, J., Zayed, A. A., Kigerl, K. A., Zane, K., Sullivan, M. B., & Popovich, P. G. (2021) · mSystems · doi:10.1128/msystems.01356-20 · Cited by 71
Self-citationBile acid receptors and signaling crosstalk in the liver, gut and brain
Ferrell, J. M., & Chiang, J. Y. L. (2021) · Liver Research · doi:10.1016/j.livres.2021.07.002 · Cited by 72
Microbiota-targeted interventions for mental health
Berding, K., & Cryan, J. F. (2021) · Current Opinion in Psychiatry · doi:10.1097/yco.0000000000000758 · Cited by 69
Marwaha, K., Cain, R., Asmis, K., Czaplinski, K., Holland, N. A., Mayer, D. C. G., & Chacon, J. A. (2025) · Journal of Applied Physiology · doi:10.1152/japplphysiol.00652.2024 · Cited by 65
Ortega, M. A., Fraile‐Μartinez, O., Montero, C. G., Haro, S., Álvarez-Mon, M. Á., León-Oliva, D. D., Gomez-Lahoz, A. M., Monserrat, J., Atienza-Pérez, M., Díaz, D., et al. (2023) · Military Medical Research · doi:10.1186/s40779-023-00461-z · Cited by 54
Schmidt, E. K. A., Raposo, P. J. F., Espin, A. T., Fenrich, K. K., & Fouad, K. (2021) · Journal of Neuroinflammation · doi:10.1186/s12974-021-02123-0 · Cited by 53
Self-citationTraumatic Spinal Cord Injury and the Gut Microbiota: Current Insights and Future Challenges
Jogia, T., & Ruitenberg, M. J. (2020) · Frontiers in Immunology · doi:10.3389/fimmu.2020.00704 · Cited by 51
Deng, J., Zou, X., Liang, Y., Zhong, J., Zhou, K., Zhang, J., Zhang, M., Wang, Z., Sun, Y., & Li, M. (2022) · International Journal of Biological Macromolecules · doi:10.1016/j.ijbiomac.2022.12.160 · Cited by 49
Spinal cord injury and gut microbiota: A review
Jing, Y., Bai, F., & Yu, Y. (2020) · Life Sciences · doi:10.1016/j.lfs.2020.118865 · Cited by 49
Mokhtari, T., & Uludağ, K. (2023) · ACS Chemical Neuroscience · doi:10.1021/acschemneuro.3c00596 · Cited by 48
Valido, E. M., Bertolo, A., Fränkl, G., Itodo, O. A., Pinheiro, T., Pannek, J., Kopp‐Heim, D., Glišić, M., & Stoyanov, J. V. (2022) · Spinal Cord · doi:10.1038/s41393-021-00737-y · Cited by 42
Chen, S., Zhang, P., Duan, H., Wang, J., Qiu, Y., Cui, Z., Yin, Y., Wan, D., & Xie, L. (2023) · The Innovation · doi:10.1016/j.xinn.2023.100479 · Cited by 40
Behavioral testing in animal models of spinal cord injury
Fouad, K., Ng, C., & Basso, D. (2020) · Experimental Neurology · doi:10.1016/j.expneurol.2020.113410 · Cited by 31
Self-citationSystem failure: Systemic inflammation following spinal cord injury
DiSabato, D. J., Marion, C. M., Mifflin, K. A., Alfredo, A. N., Rodgers, K. A., Kigerl, K. A., Popovich, P. G., & McTigue, D. M. (2023) · European Journal of Immunology · doi:10.1002/eji.202250274 · Cited by 40
Self-citationMood and microbes: a comprehensive review of intestinal microbiota’s impact on depression
Luqman, A., He, M., Hassan, A., Ullah, M., Zhang, L., Khan, M. R., Din, A. U., Ullah, K., Wang, W. J., & Wang, G. (2024) · Frontiers in Psychiatry · doi:10.3389/fpsyt.2024.1295766 · Cited by 39
Jing, Y., Bai, F., Wang, L., Yang, D., Yan, Y., Wang, Q., Zhu, Y., Yu, Y., & Chen, Z. (2022) · Microbiology Spectrum · doi:10.1128/spectrum.00177-22 · Cited by 37
Dual-directional regulation of spinal cord injury and the gut microbiota
Cui, Y., Liu, J., Xiao, L., Liu, S., Chen, H., Wei, Z., Li, H., Yang, Y., Zheng, C., & Li, Z. (2023) · Neural Regeneration Research · doi:10.4103/1673-5374.380881 · Cited by 38
The Microbiota‐Gut‐Brain Connection: A New Horizon in Neurological and Neuropsychiatric Disorders
Faysal, M. F., Zehravi, M., Sutradhar, B., Amin, M. A., Shanmugarajan, T. S., Arjun, U. V. N. V., Ethiraj, S., Durairaj, A., Dayalan, G., Ahamad, S. K., et al. (2025) · CNS Neuroscience & Therapeutics · doi:10.1111/cns.70593 · Cited by 41
Qu, Z., Tian, P., Yang, B. K., Zhao, J., Wang, G., & Chen, W. (2022) · Life Sciences · doi:10.1016/j.lfs.2022.120719 · Cited by 37
Peripheral Immune Dysfunction: A Problem of Central Importance after Spinal Cord Injury
Jeffries, M. A., & Tom, V. J. (2021) · Biology · doi:10.3390/biology10090928 · Cited by 38
Bai, H., Sun, K., Wu, J., Zhong, Z.-H., Xu, S.-L., Zhang, H., Gu, Y.-H., & Lu, S.-F. (2020) · PLoS ONE · doi:10.1371/journal.pone.0231797 · Cited by 36
Fenrich, K. K., Hallworth, B. W., Vavrek, R., Raposo, P. J. F., Misiaszek, J. E., Bennett, D. J., Fouad, K., & Espin, A. T. (2020) · Experimental Neurology · doi:10.1016/j.expneurol.2020.113543 · Cited by 34
Self-citationThe gut microbiota and metabolite profiles are altered in patients with spinal cord injury
Kong, G., Zhang, W., Zhang, S., Chen, J., He, K., Zhang, C., Yuan, X., & Xie, B. (2023) · Molecular Brain · doi:10.1186/s13041-023-01014-0 · Cited by 33
The gut-brain axis and beyond: Microbiome control of spinal cord injury pain in humans and rodents
Bannerman, C. A., Douchant, K., Sheth, P. M., & Ghasemlou, N. (2020) · Neurobiology of Pain · doi:10.1016/j.ynpai.2020.100059 · Cited by 34
Jogia, T., Kopp, M. A., Schwab, J. M., & Ruitenberg, M. J. (2021) · Current Opinion in Neurology · doi:10.1097/wco.0000000000000995 · Cited by 33
Hassib, L., de Oliveira, C. L., Rouvier, G. A., Kanashiro, A., Guimarães, F. S., & Ferreira, F. R. (2023) · Gut Microbes · doi:10.1080/19490976.2023.2226282 · Cited by 33
Sefiani, A., & Geoffroy, C. G. (2021) · Frontiers in Neuroscience · doi:10.3389/fnins.2021.682259 · Cited by 31
Mohammadi, S. O., Yadegar, A., Kargar, M., Mirjalali, H., & Kafilzadeh, F. (2020) · Journal of Diabetes & Metabolic Disorders · doi:10.1007/s40200-020-00608-y · Cited by 30
Pang, R., Wang, J., Xiong, Y.-S., Liu, J., Ma, X., Gou, X., He, X., Cheng, C., Wang, W., Zheng, J., et al. (2022) · Frontiers in Microbiology · doi:10.3389/fmicb.2022.986480 · Cited by 30
Epigenetic Aberrations in Major Psychiatric Diseases Related to Diet and Gut Microbiome Alterations
Nohesara, S., Abdolmaleky, H. M., & Thiagalingam, S. (2023) · Genes · doi:10.3390/genes14071506 · Cited by 32
Bornbusch, S. L., Harris, R. L., Grebe, N. M., Roche, K. E., Dimac-Stohl, K. A., & Drea, C. M. (2021) · Animal Microbiome · doi:10.1186/s42523-021-00126-z · Cited by 27
Blood-derived factors to brain communication in brain diseases
He, J., Zhang, Y., Guo, Y., Guo, J., Chen, X., Xu, S., Xu, X., Wu, C., Liu, C., Chen, J., et al. (2024) · 中国科学通报:英文版 · doi:10.1016/j.scib.2024.09.022 · Cited by 26
The effects of GelMA hydrogel on nerve repair and regeneration in mice with spinal cord injury
Zhang, H., Xu, J., & Saijilafu (2021) · Annals of Translational Medicine · doi:10.21037/atm-21-2874 · Cited by 25
Schmidt, E. K. A., Raposo, P. J. F., Madsen, K. L., Fenrich, K. K., Kabarchuk, G., & Fouad, K. (2021) · Biology · doi:10.3390/biology10040254 · Cited by 24
Self-citationHunthai, S., Usawachintachit, M., Taweevisit, M., Srisa‐Art, M., Anegkamol, W., Tosukhowong, P., Rattanachaisit, P., Chuaypen, N., & Dissayabutra, T. (2024) · Scientific Reports · doi:10.1038/s41598-024-72694-4 · Cited by 23
Green, J. E., McGuinness, A. J., Berk, M., Castle, D. J., Athan, E., Hair, C., Strandwitz, P., Loughman, A., Nierenberg, A. A., Cryan, J. F., et al. (2023) · Pilot and Feasibility Studies · doi:10.1186/s40814-023-01235-z · Cited by 23
The Brain-gut Axis-where are we now and how can we Modulate these Connections?
Dąbrowski, W., Siwicka-Gieroba, D., Kotfis, K., Zaid, S., Terpiłowska, S., Robba, C., & Siwicki, A. K. (2020) · Current Neuropharmacology · doi:10.2174/1570159x18666201119155535 · Cited by 21
Guha, L., Agnihotri, T. G., Jain, A., & Kumar, H. (2023) · Life Sciences · doi:10.1016/j.lfs.2023.122193 · Cited by 20
Frankot, M. A., O’Hearn, C. M., Blancke, A. M., Rodríguez, B. A., Pechacek, K. M., Gandhi, J., Hu, G., Martens, K. M., & Haar, C. V. (2022) · Behavioral Neuroscience · doi:10.1037/bne0000532 · Cited by 19
Interrogating the role of the milk microbiome in mastitis in the multi-omics era
Couvillion, S., Mostoller, K. E., Williams, J. E., Pace, R. M., Stohel, I. L., Peterson, H. K., Nicora, C., Nakayasu, E. S., Webb‐Robertson, B., McGuire, M. A., et al. (2023) · Frontiers in Microbiology · doi:10.3389/fmicb.2023.1105675 · Cited by 21
Schmidt, E. K. A., Raposo, P. J. F., Vavrek, R., & Fouad, K. (2020) · Brain Behavior and Immunity · doi:10.1016/j.bbi.2020.12.013 · Cited by 19
Self-citationLack of gut microbiome recovery with spinal cord injury rehabilitation
Arie, A. G., Toren, I., Hadar, R., Braun, T., Efroni, G., Saar, E. G., Madar, Z., Amir, A., Zeilig, G., & Haberman, Y. (2024) · Gut Microbes · doi:10.1080/19490976.2024.2309682 · Cited by 18
Gut Microbiota–Brain Axis as a Potential Modulator of Psychological Stress after Spinal Cord Injury
Musleh-Vega, S., Ojeda, J., & Vidal, P. M. (2022) · Biomedicines · doi:10.3390/biomedicines10040847 · Cited by 15
Mah, K. M., Espin, A. T., Hallworth, B. W., Bixby, J. L., Lemmon, V., Fouad, K., & Fenrich, K. K. (2021) · Experimental Neurology · doi:10.1016/j.expneurol.2021.113647 · Cited by 13
Self-citationDong, J., Xie, T., Shi, C., Feng, G., Zhang, H., Xu, Z., & Dong, L. (2025) · Journal of Inflammation Research · doi:10.2147/jir.s543912 · Cited by 12
Goodus, M. T., Alfredo, A. N., Carson, K. E., Dey, P., Pukos, N., Schwab, J. M., Popovich, P. G., Gao, J., Mo, X. M., Bruno, R. S., et al. (2024) · Experimental Neurology · doi:10.1016/j.expneurol.2024.114847 · Cited by 12
Self-citationThe Role of the Gut Microbiome in Orthopedic Surgery—a Narrative Review
Hiltzik, D. M., Goodwin, A. M., Kurapaty, S. S., Inglis, J. E., Pagadala, M. S., Edelstein, A. I., & Hsu, W. K. (2023) · Current Reviews in Musculoskeletal Medicine · doi:10.1007/s12178-023-09878-4 · Cited by 10
Pawlowski, K. D., David, B. T., & Fessler, R. G. (2022) · Journal of Neurotrauma · doi:10.1089/neu.2022.0264 · Cited by 9
The biomechanical implications of neck position in cervical contusion animal models of SCI
Obaid, N., Morioka, K., Sinopoulou, E., Nout‐Lomas, Y. S., Salegio, E. A., Bresnahan, J. C., Beattie, M. S., & Sparrey, C. J. (2023) · Frontiers in Neurology · doi:10.3389/fneur.2023.1152472 · Cited by 9
Wang, J., Zhao, X., Zhou, R.-H., Wang, M., Xiang, W., You, Z., Li, M., Tang, R., Zheng, J., Li, J., et al. (2023) · Frontiers in Microbiology · doi:10.3389/fmicb.2023.1206909 · Cited by 9
Shen, C., Deshmukh, H., Santos, J. M., Elmassry, M. M., Presto, P., Driver, Z., Bhakta, V., Yakhnitsa, V., Kiritoshi, T., Ji, G., et al. (2024) · The Journal of Frailty & Aging · doi:10.14283/jfa.2024.65 · Cited by 9
Gut microbiome and neurosurgery: Implications for treatment
Willman, J., Willman, M., Reddy, R., Fusco, A. F., Sriram, S., Mehkri, Y., Charles, J. H., Goeckeritz, J., & Lucke-Wold, B. P. (2022) · Clinical and Translational Discovery · doi:10.1002/ctd2.139 · Cited by 9
Zhang, Z., Cheng, N., Liang, J., Deng, Y., Xiang, P., Hei, Z., & Li, X. (2023) · Annals of Medicine · doi:10.1080/07853890.2023.2269379 · Cited by 8
Jahani‐Sherafat, S., Taghavi, H., Asri, N., Rezaei–Tavirani, M., Razzaghi, Z., & Rostami‐Nejad, M. (2023) · Gastroenterology and hepatology from bed to bench. · doi:10.22037/ghfbb.v16i4.2687 · Cited by 8
Lucas‐Osma, A. M., Schmidt, E. K. A., Vavrek, R., Bennett, D. J., Fouad, K., & Fenrich, K. K. (2021) · Behavioural Brain Research · doi:10.1016/j.bbr.2021.113731 · Cited by 8
Self-citationAn Updated Narrative Mini-Review on the Microbiota Changes in Antenatal and Post-Partum Depression
Doroftei, B., Ilie, O., Diaconu, R., Huțanu, D., Stoian, I. L., & Ilea, C. G. (2022) · Diagnostics · doi:10.3390/diagnostics12071576 · Cited by 10
Traumatic spinal cord injury and the contributions of the post-injury microbiome
Hamilton, A. M., & Sampson, T. R. (2022) · International review of neurobiology · doi:10.1016/bs.irn.2022.06.003 · Cited by 8
Kramp, R. D., Kohl, K. D., & Stephenson, J. F. (2022) · Biology Letters · doi:10.1098/rsbl.2022.0167 · Cited by 8
Dried plum mitigates spinal cord injury‐induced bone loss in mice
Liu, X., Liu, M., Turner, R. T., Iwaniec, U. T., Kim, H., & Halloran, B. P. (2020) · JOR Spine · doi:10.1002/jsp2.1113 · Cited by 7
Kalaga, P., & Ray, S. K. (2025) · Brain Sciences · doi:10.3390/brainsci15020197 · Cited by 6
Rani, M., Akhilesh, A., Chouhan, D., Uniyal, A., & Tiwari, V. (2024) · ACS Chemical Neuroscience · doi:10.1021/acschemneuro.4c00267 · Cited by 6
Salia, S., Martin, Y. H., Burke, F. F., Myles, L. A., Jackman, L. M., Halievski, K., Bambico, F. R., & Swift‐Gallant, A. (2023) · Brain Behavior & Immunity - Health · doi:10.1016/j.bbih.2023.100637 · Cited by 6
Hamad, I., Broeckhoven, J. V., Cardilli, A., Hellings, N., Strowig, T., Lemmens, S., Hendrix, S., & Kleinewietfeld, M. (2023) · Nutrients · doi:10.3390/nu15194184 · Cited by 7
Vidal, P. M., Brockie, S. T., Farkas, C., Hong, J., Zhou, C., & Fehlings, M. G. (2024) · Neurobiology of Disease · doi:10.1016/j.nbd.2024.106640 · Cited by 6
Allani, M., Nath, G., Juyal, G., Joshi, M. C., & Tiwari, V. (2026) · Microbial Pathogenesis · doi:10.1016/j.micpath.2026.108275 · Cited by 5
Nishigaki, A., Marchesi, J. R., & Previdelli, R. L. (2025) · Veterinary Sciences · doi:10.3390/vetsci12060541 · Cited by 5
Iaquinta, F. S., Mauro, D., Pantano, I., Naty, S., Iacono, D., Gaggiano, E., Riccio, L., Ciccia, F., Grembiale, R. D., & Spagnuolo, R. (2023) · Journal of Clinical Medicine · doi:10.3390/jcm12093248 · Cited by 5
Xie, Z., Xu, T., Chen, J., Gui, Y., Wan, D., & Li, M. (2025) · ACS Chemical Neuroscience · doi:10.1021/acschemneuro.4c00413 · Cited by 4
Kříž, J., Hyšperská, V., Bébrová, E., & Roznětinská, M. (2024) · Infection Prevention in Practice · doi:10.1016/j.infpip.2024.100340 · Cited by 4
Raposo, P. J. F., Nguyen, A. T., Schmidt, E. K. A., Espin, A. T., Fenrich, K. K., Bennett, D. J., & Fouad, K. (2025) · Topics in Spinal Cord Injury Rehabilitation · doi:10.46292/sci24-00004 · Cited by 4
Self-citationZhang, D., Peng, R., & Yang, D. (2025) · Spinal Cord Series and Cases · doi:10.1038/s41394-025-00698-x · Cited by 4
Exploring gut microbiota and spinal cord injury: pathogenesis, treatment strategies and prospects
Chen, Q., Zhong, M., & Ye, L. (2025) · Frontiers in Immunology · doi:10.3389/fimmu.2025.1693883 · Cited by 3
Targeting the Microbiome to Improve Gut Health and Breathing Function After Spinal Cord InjuryPreprint
Wilson, J. N., Kigerl, K. A., Sunshine, M. D., Taylor, C. E., Speed, S. L., Rose, B. C., Calulot, C. M., Dong, B. E., Hawkinson, T. R., Clarke, H. A., et al. (2023) · bioRxiv (Cold Spring Harbor Laboratory) · doi:10.1101/2023.06.23.546264 · Cited by 3
Self-citationHurtado, J. C., Raposo, P. J. F., Vavrek, R., Nguyen, A., Nelson, B., Monnier, P. P., Espin, A. T., Fenrich, K. K., & Fouad, K. (2024) · Experimental Neurology · doi:10.1016/j.expneurol.2024.115039 · Cited by 3
Self-citationZhang, Y., Chen, L., Jin, J., Xin, Y., Wang, J., & Zhang, A. (2025) · Experimental Neurology · doi:10.1016/j.expneurol.2025.115631 · Cited by 2
A new paradigm of bidirectional regulation of the gut–spinal cord axis
Ni, S., Chen, K., Wang, H., Chen, S., Qiu, Y., Wang, T., Mo, F., Wang, S., Li, B., Bai, Y., et al. (2025) · Neural Regeneration Research · doi:10.4103/nrr.nrr-d-25-01016 · Cited by 2
Gut Microbes and Inflammation: Their Role in Spinal Cord Injury Progression and Secondary Damage
Dong, J., Xie, T., Xu, C., Xu, Z., Hao, D., & Dong, L. (2025) · Current Microbiology · doi:10.1007/s00284-025-04469-7 · Cited by 2
Hurtado, J. C., Rakheja, R., Scatterty, K. R., Armstrong, E., Storvold, S., Nguyen, A. T., Fenrich, K. K., Monnier, P., & Fouad, K. (2026) · Scientific Reports · doi:10.1038/s41598-026-48842-3 · Cited by 1
Self-citationTong, C. (2024) · Clinical Nutrition Open Science · doi:10.1016/j.nutos.2024.07.001 · Cited by 1
Castillo, E. D. L. C., & García, E. (2020) · IntechOpen eBooks · doi:10.5772/intechopen.92599 · Cited by 1
Hulsebosch, C. E. (2021) · Elsevier eBooks · doi:10.1016/b978-0-12-818662-6.00002-9 · Cited by 1
Spinal cord injury and the gut microbiota
Kigerl, K. A., & Popovich, P. G. (2022) · Elsevier eBooks · doi:10.1016/b978-0-12-822427-4.00036-8 · Cited by 1
Self-citationReveles, K. R., Hickmott, A. J., Strey, K. A., Mustoe, A. C., Arroyo, J. P., Power, M. L., Ridenhour, B. J., Amato, K. R., & Ross, C. N. (2024) · Microorganisms · doi:10.3390/microorganisms12050852 · Cited by 1
Inbred mouse model of brain development and intestinal microbiota
Oriá, R. B., Pinto, D. V., Dias, R. P., Raposo, R. D. S., Foley, P. L., Malva, J. O., & Guerrant, R. L. (2021) · Elsevier eBooks · doi:10.1016/b978-0-12-817988-8.00048-8 · Cited by 1
Spinal cord injury as a trigger for changes in the intestinal microbiota
Ivanova, E. Y., Kirilina, S. I., Сергеевич, С. В., & Gusev, A. F. (2023) · Russian Journal of Spine Surgery (Khirurgiya Pozvonochnika) · doi:10.14531/ss2023.2.49-56 · Cited by 2
Metadata
- Authors
- Schmidt, E. K. A., Torres-Espin, A., Raposo, P. J. F., Madsen, K. L., Kigerl, K. A., Popovich, P. G., Fenrich, K. K., & Fouad, K.
- Affiliations
- University of Alberta (CA)
- The Ohio State University Wexner Medical Center (US)
- Corresponding author
- Fouad, Karim
- ORCID
- Venue
- PLoS ONE
- Publisher
- Public Library of Science (PLoS)
- Published
- 2020-01-15
- Volume
- 15
- Issue
- 1
- Pages
- e0226128
- ISSN
- 1932-6203 (ISSN-L)
- PMC
- PMC6961833
- OpenAlex
- W2998874562
- Cited by
- 119
- References
- 73
- Citations by year
- 2026: 8 · 2025: 12 · 2024: 12 · 2023: 24 · 2022: 17 · 2021: 31 · 2020: 15
- FWCI
- 7.13
- Type
- journal article
- Language
- en
- Open access
- gold
- doi.org
- Licence
- Locations
- PLoS ONE (publishedVersion, cc-by)
- Europe PMC (PubMed Central) (publishedVersion, cc-by)
- PubMed Central (publishedVersion, cc-by)
- PubMed (publishedVersion)
- RePEc: Research Papers in Economics (submittedVersion)
- DOAJ (DOAJ: Directory of Open Access Journals) (submittedVersion, cc-by-sa)
- Figshare (submittedVersion, cc-by)
- Funders
- Craig H. Neilsen Foundation (542589)
- Canadian Institutes of Health Research (119281)
- Topics
- Life Sciences › Biochemistry, Genetics and Molecular Biology › Molecular Biology › Gut microbiota and health
- Health Sciences › Medicine › Clinical Neurology › Spinal Cord Injury Research
- Health Sciences › Medicine › Gastroenterology › Gastrointestinal motility and disorders
- Keywords
- fecal microbiota transplantation, spinal cord injury, gut dysbiosis, anxiety-like behavior, gut microbiota, mood disorders, depression
- MeSH terms
- Gastrointestinal Microbiome, Fecal Microbiota Transplantation, Animals, Anxiety, Behavior, Animal, Spinal Cord Injuries, Maze Learning, Recovery of Function, Rats, Dysbiosis
About these checks
Registry, retraction, Cites and statistics results are computed, not judged, with one exception: a printed reference that no index lists is read once by a model before it counts as a citation error. Claims are extracted by a model and kept only when their quote appears verbatim in the text; each cited source is then checked, with a model’s help, for whether it says what the claim relies on. Those verdicts can be wrong — read the claim’s quote and the cited source before relying on one.
Statistics and arithmetic are recomputed, not judged.
Confidence bands are shown only for fields calibrated on our annotated test set. None is calibrated yet, so no band is shown.
What counts as a claim ›How we measure confidence ›How we check this ›
Are you an author, or do you see a problem with this page? Request a review
