

Can a semi-quantitative method replace the current quantitative method for the annual screening of microalbuminuria in patients with diabetes? Diagnostic accuracy and cost-saving analysis considering the potential health burden
Open accessThe DOI matches its Crossref record; 47 of the 47 references it cites were found in a registry or an index.
Abstract
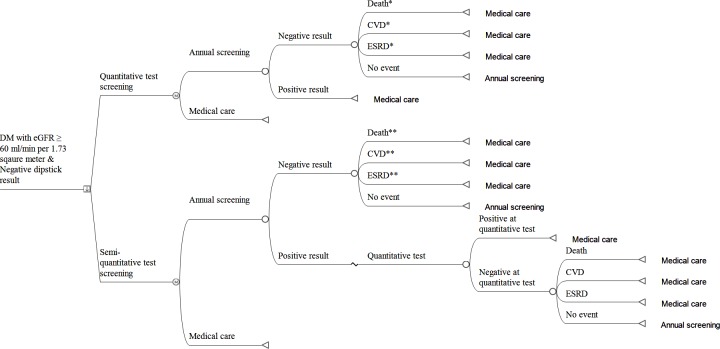
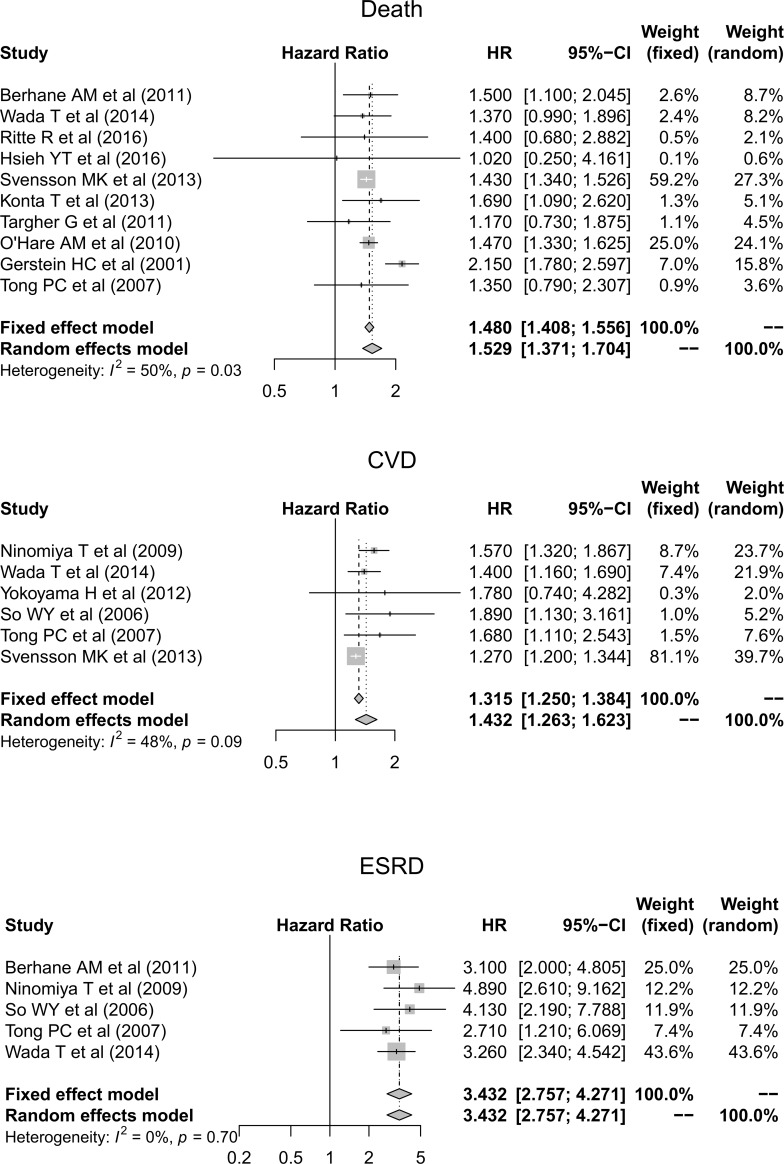
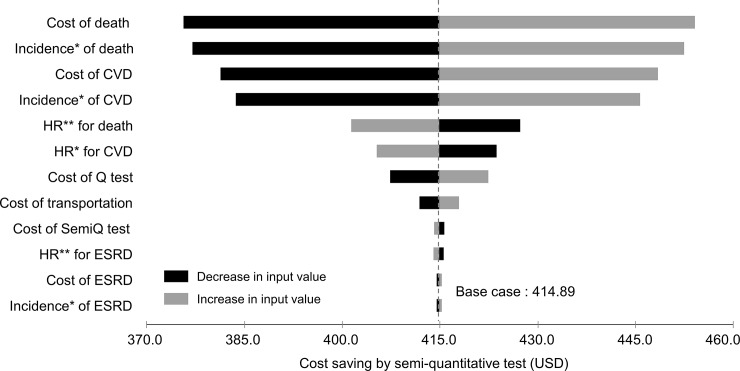
OBJECTIVES: Diabetes is a global epidemic, and the high cost of annually and quantitatively measuring urine albumin excretion using the turbidimetric immunoassay is challenging. We aimed to determine whether a semi-quantitative urinary albumin-creatinine ratio test could be used as a screening tool for microalbuminuria in diabetic patients. METHODS: We assessed the diagnostic accuracy of the semi-quantitative method. The costs of false results in the semi-quantitative method were calculated based on the annual probability of disease progression analyzed through a systematic literature review and meta-analysis. The pooled long-term cost-saving effect of the semi-quantitative method compared with the quantitative test was assessed using a Markov model simulating a long-term clinical setting. Diagnostic accuracy and the cost-saving effect were also validated in an independent external cohort. RESULTS: Compared with the quantitative test, the semi-quantitative method had sensitivities of 93.5% and 81.3% and specificities of 61.4% and 63.1% in the overall sample of diabetic patients (n = 1,881) and in diabetic patients with eGFR ≥60 ml/min/1.73 m2 and a negative dipstick test (n = 1,110), respectively. After adjusting for direct and indirect medical costs, including the risk of disease progression, which was adjusted by the meta-analyzed hazard ratio for clinical outcomes, it was determined that using the semi-quantitative method could save 439.4 USD per person for 10 years. Even after adjusting the result to the external validation cohort, 339.6 USD could be saved for one diabetic patient for 10 years. CONCLUSIONS: The semi-quantitative method could be an appropriate screening tool for albuminuria in diabetic patients. Moreover, it can minimize the testing time and inconvenience and significantly reduce national health costs.
Overview
The claims and statistics of this paper haven’t been checked yet.
Free: it reads the open-access text and checks the first 5 claims that cite a source we can check. Create a free account to check every claim.
Integrity signals
Registry
Cites
Statistics
Figures
Verification
Claims the paper makes
The claims and statistics of this paper haven’t been checked yet.
Free: it reads the open-access text and checks the first 5 claims that cite a source we can check. Create a free account to check every claim.
Claims other papers make about this one
Each is checked against this paper’s own text: does it say what the citing paper says it does?
The cited source says what the claim attributes to it.
In the citing paper
“A cost-effectiveness analysis of 1,881 individuals with diabetes published in 2020 evaluated medical costs of CKD and concluded that the semiquantitative uACR dipstick method could be an appropriate screening tool for albuminuria in people with diabetes.”
From Guidelines and Recommendations for Laboratory Analysis in the Diagnosis and Management of Diabetes Mellitus (2023) · cites this paper as [503]
The cited source says what the claim attributes to it.
In the citing paper
“Moreover, the authors point out that it can minimize the testing time and inconvenience and significantly reduce national health costs (503).”
From Guidelines and Recommendations for Laboratory Analysis in the Diagnosis and Management of Diabetes Mellitus (2023) · cites this paper as [503]
Self-check
Percentages, sums and reported differences re-computed from the paper’s own numbers.
The self-check needs the paper’s full text.
Citations
Cites
Toprak, O., Kurt, H., Sarı, Y., Şarkış, C., Us, H., & Kırık, A. (2017) · Kidney and Blood Pressure Research · doi:10.1159/000468530 · Cited by 29,627
Levey, A. S., Coresh, J., Bolton, K., Culleton, B. F., Harvey, K. S., Ikizler, T. A., Johnson, C. A., Kausz, A., Kimmel, P. L., Kusek, J. W., et al. (2002) · University of Groningen research database (University of Groningen / Centre for Information Technology) · Cited by 11,633
Haffner, S. M., Lehto, S., Rönnemaa, T., Pyörälä, K., & Laakso, M. (1998) · New England Journal of Medicine · doi:10.1056/nejm199807233390404 · Cited by 7,000
2. Classification and Diagnosis of Diabetes: Standards of Medical Care in Diabetes—2022
American Diabetes Association Professional Practice Committee (2022) · Diabetes Care · doi:10.2337/dc22-s002 · Cited by 4,792
Standards of medical care in diabetes—2013
American Diabetes Association (2013) · Diabetes Care · doi:10.2337/dc13-s011 · Cited by 4,369
Zhou, B., Lu, Y., Hajifathalian, K., Bentham, J., Di Cesare, M., Danaei, G., Bixby, H., Cowan, M., Ali, M., Taddei, C., et al. (2016) · The Lancet · doi:10.1016/s0140-6736(16)00618-8 · Cited by 4,311
Targeting the KEAP1-NRF2 system to prevent kidney disease progression
Nezu, M., Suzuki, N., & Yamamoto, M. (2017) · American Journal of Nephrology · doi:10.1159/000475890 · Cited by 3,447
2. Classification and Diagnosis of Diabetes:Standards of Medical Care in Diabetes—2019
American Diabetes Association (2019) · Diabetes Care · doi:10.2337/dc19-s002 · Cited by 2,697
Gerstein, H. C. (2001) · JAMA · doi:10.1001/jama.286.4.421 · Cited by 2,440
Adler, A. I., Stevens, R. J., Manley, S. E., Bilous, R. W., Cull, C. A., Holman, R. R., & UKPDS Group (2003) · Kidney International · doi:10.1046/j.1523-1755.2003.00712.x · Cited by 1,816
Research works printed but not linked: 2
- Tholen DW, Kallner A, Kennedy JW, Krouwer JS, Meier K. Evaluation of precision performance of quantitative measurement methods; approved guideline—second edition. Evaluation. 2004; 24(25).
- Ahn JH, Kim YH, Shin SJ, JY P. Cost of Medical Decision Making—Asian Joint Research on Effectiveness. National Evidence-based Healthcare Collaborating Agency; 2012.
Cited by
KDIGO 2024 clinical practice guideline for the evaluation and management of chronic kidney disease
Stevens, P. E., Ahmed, S. B., Carrero, J. J., Foster, B., Francis, A., Hall, R. K., Herrington, W. G., Hill, G., Inker, L. A., Kazancıoğlu, R., et al. (2024) · Kidney International · doi:10.1016/j.kint.2023.10.018 · Cited by 8,530
Sacks, D. B., Arnold, M., Bakris, G. L., Bruns, D. E., Horvath, A. R., Lernmark, Å., Metzger, B. E., Nathan, D. M., & Kirkman, M. S. (2023) · Diabetes Care · doi:10.2337/dci23-0036 · Cited by 351
Sacks, D. B., Arnold, M. A., Bakris, G. L., Bruns, D. E., Horvath, A. R., Lernmark, Å., Metzger, B. E., Nathan, D. M., & Kirkman, M. S. (2023) · Clinical Chemistry · doi:10.1093/clinchem/hvad080 · Cited by 206
Screening, identifying, and treating chronic kidney disease: why, who, when, how, and what?
Farrell, D. R., & Vassalotti, J. A. (2024) · BMC Nephrology · doi:10.1186/s12882-024-03466-5 · Cited by 114
Urine Albumin Measurements in Clinical Diagnostics
Seegmiller, J. C., & Bachmann, L. M. (2024) · Clinical Chemistry · doi:10.1093/clinchem/hvad174 · Cited by 62
Mejia, J. R., Fernandez-Chinguel, J. E., Dolores-Maldonado, G., Becerra-Chauca, N., Goicochea-Lugo, S., Herrera-Añazco, P., Zafra-Tanaka, J. H., & Taype-Rondan, A. (2021) · Heliyon · doi:10.1016/j.heliyon.2021.e08253 · Cited by 35
“Kim 2020 is mentioned twice in the meta-analyses: one for its developmental cohort and the other for its validation cohort [23].”
BackgroundMethodInfluentialLalic, K. S., Popović, L., Lukač, S. S., Rasulić, I., Petakov, A., Krstic, M., Mitrović, M., Jotić, A., & Lalic, N. M. (2024) · Diabetes Research and Clinical Practice · doi:10.1016/j.diabres.2024.111819 · Cited by 5
Miyoshi, K., Chikamori, M., Ando, T., Nakata, K., Aoyama, T., Matsunaga, Y. T., & Yamauchi, T. (2025) · Microvascular Research · doi:10.1016/j.mvr.2025.104830 · Cited by 4
Mohiuddin, S., Ward, M., Hollingworth, W., Watson, J., Whiting, P. F., & Thom, H. H. Z. (2024) · PharmacoEconomics - Open · doi:10.1007/s41669-024-00473-y · Cited by 5
ESTRÉS LABORAL EN LOS DOCENTES DE LA CARRERA DE ENFERMERÍA EN LA MODALIDAD VIRTUAL
Coronel, B. G. C., & López, L. K. G. (2022) · PSICOLOGÍA UNEMI · doi:10.29076/issn.2602-8379vol6iss10.2022pp10-20p · Cited by 1
Pervyshin, N. A., Svetlana, S. V., Анатольевич, Ш. О., Vasilkova, V., & Sharonova, L. A. (2025) · Science and Innovations in Medicine · doi:10.35693/sim646623
Bunpo, P., Nanthawong, P., Chomphusri, C., Ratchawat, W., Kittikunnathum, S., Tanintheerakul, C., & Peerakam, R. (2026) · Frontiers in Medical Technology · doi:10.3389/fmedt.2026.1913468
Metadata
- Authors
- Kim, Y., Park, S., Kim, M.-H., Song, S. H., Lee, W. M., Kim, H. S., Jin, K., Han, S., Kim, Y. C., Han, S. S., Lee, H., Lee, J. P., Joo, K. W., Lim, C. S., Kim, Y. S., & Kim, D. K.
- Affiliations
- Seoul National University (KR)
- Eulji University (KR)
- Keimyung University (KR)
- Corresponding author
- Kim, Dong Ki
- ORCID
- Venue
- PLOS ONE
- Publisher
- Public Library of Science (PLoS)
- Published
- 2020-01-21
- Volume
- 15
- Issue
- 1
- Pages
- e0227694
- ISSN
- 1932-6203 (ISSN-L)
- PMC
- PMC6974274
- OpenAlex
- W3001164618
- Semantic Scholar
- d89c07ec49177ff6e3442eb40ff3cea6b97fe6c0
- Cited by
- 12
- References
- 47
- Citations by year
- 2026: 1 · 2025: 2 · 2024: 5 · 2023: 2 · 2022: 1 · 2021: 1
- FWCI
- 0.63
- Type
- journal article
- Language
- en
- Open access
- gold
- doi.org
- Licence
- Locations
- PLoS ONE (publishedVersion, cc-by)
- PubMed Central (publishedVersion, cc-by)
- PubMed (publishedVersion)
- RePEc: Research Papers in Economics (submittedVersion)
- DOAJ (DOAJ: Directory of Open Access Journals) (submittedVersion, cc-by-sa)
- Figshare (submittedVersion, cc-by)
- Seoul National University Open Repository (Seoul National University) (submittedVersion)
- Funders
- Ministry of Health and Welfare (HI17C0530)
- Topics
- Health Sciences › Medicine › Nephrology › Chronic Kidney Disease and Diabetes
- Social Sciences › Economics, Econometrics and Finance › Economics and Econometrics › Health Systems, Economic Evaluations, Quality of Life
- Health Sciences › Medicine › Endocrinology, Diabetes and Metabolism › Diabetes Management and Research
- Keywords
- microalbuminuria, diabetes mellitus, urinary albumin-creatinine ratio, diabetic nephropathy screening, diagnostic accuracy, cost saving, disease progression, Markov model
- MeSH terms
- Albuminuria, Diabetes Mellitus, Diabetic Nephropathies, Humans, Mass Screening, Reproducibility of Results, Cohort Studies, Urinalysis, Cost Savings, Republic of Korea
About these checks
Registry, retraction, Cites and statistics results are computed, not judged, with one exception: a printed reference that no index lists is read once by a model before it counts as a citation error. Claims are extracted by a model and kept only when their quote appears verbatim in the text; each cited source is then checked, with a model’s help, for whether it says what the claim relies on. Those verdicts can be wrong — read the claim’s quote and the cited source before relying on one.
Statistics and arithmetic are recomputed, not judged.
Confidence bands are shown only for fields calibrated on our annotated test set. None is calibrated yet, so no band is shown.
What counts as a claim ›How we measure confidence ›How we check this ›
Are you an author, or do you see a problem with this page? Request a review
Data sources
Bibliographic data: Semantic Scholar, OpenAlex, Crossref.
Contains information from the Semantic Scholar Academic Graph Datasets, made available under the ODC Attribution License (ODC-BY 1.0).
Semantic Scholar’s data is described in: Kinney, R., et al. (2023). The Semantic Scholar Open Data Platform. arXiv:2301.10140.
