

The DOI matches its Crossref record; 58 of the 58 references it cites were found in a registry or an index.
HTLV-1 bZIP Factor Induces T-Cell Lymphoma and Systemic Inflammation In Vivo
Open accessAbstract
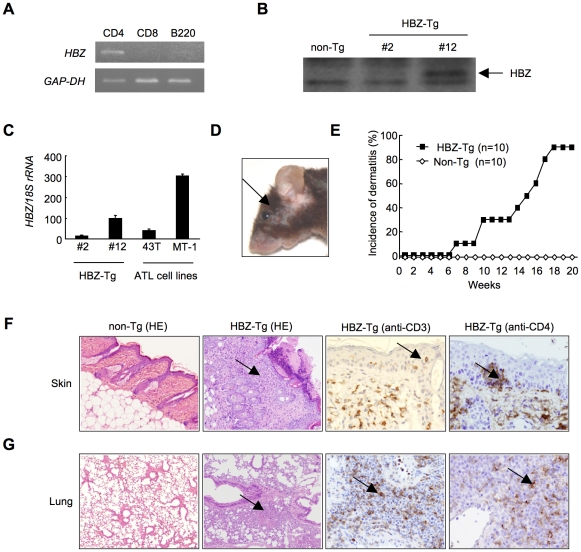
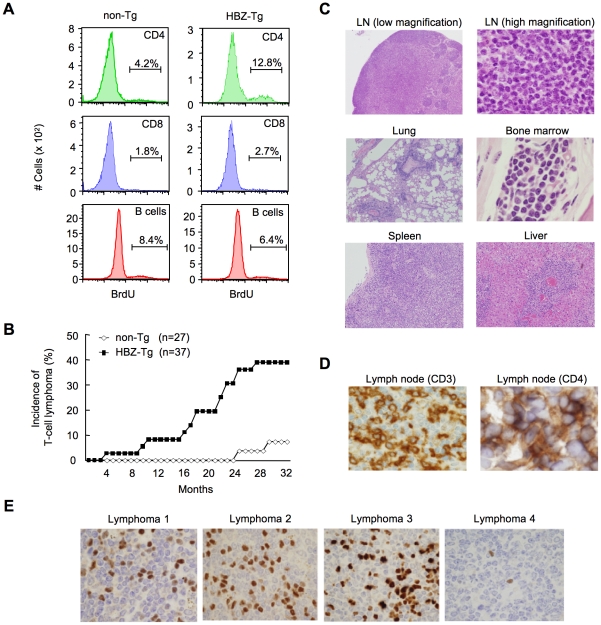
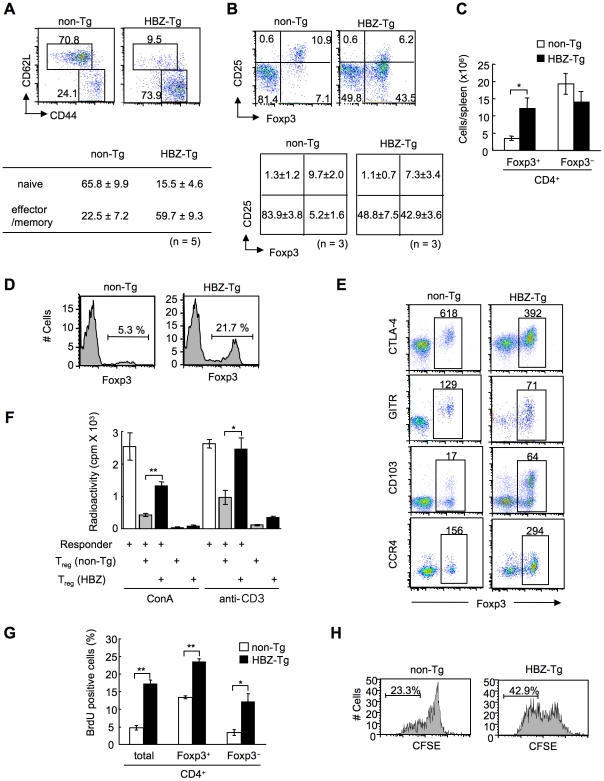
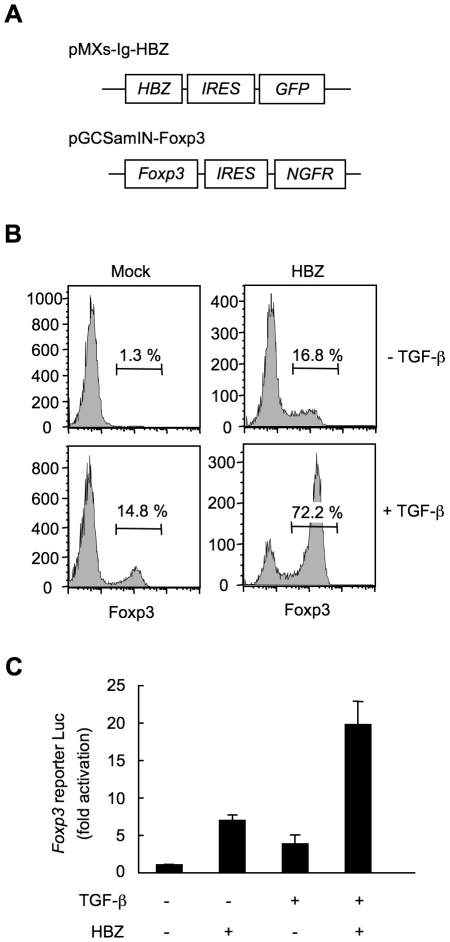
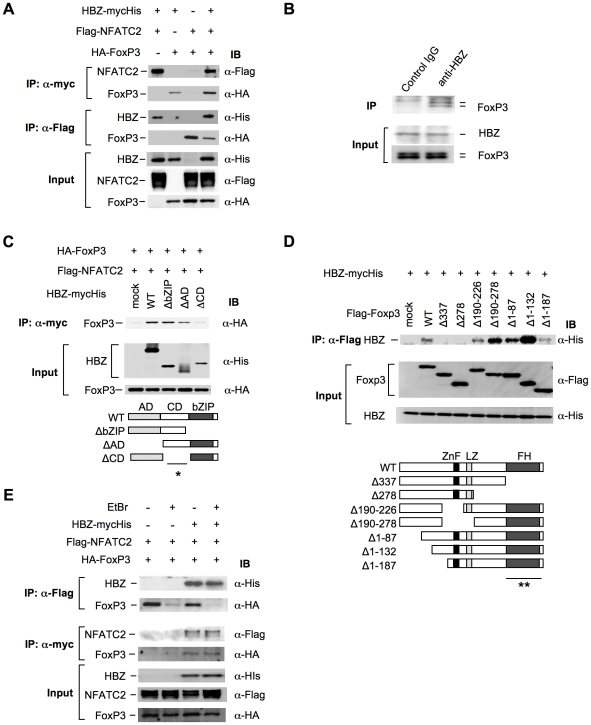
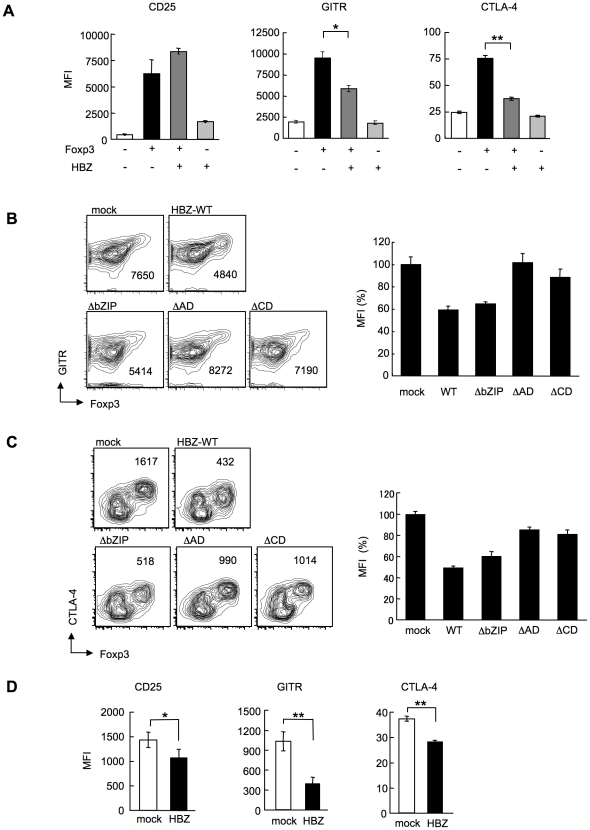
Human T-cell leukemia virus type 1 (HTLV-1) is the causal agent of a neoplastic disease of CD4+ T cells, adult T-cell leukemia (ATL), and inflammatory diseases including HTLV-1 associated myelopathy/tropical spastic paraparesis, dermatitis, and inflammatory lung diseases. ATL cells, which constitutively express CD25, resemble CD25+CD4+ regulatory T cells (T(reg)). Approximately 60% of ATL cases indeed harbor leukemic cells that express FoxP3, a key transcription factor for T(reg) cells. HTLV-1 encodes an antisense transcript, HTLV-1 bZIP factor (HBZ), which is expressed in all ATL cases. In this study, we show that transgenic expression of HBZ in CD4+ T cells induced T-cell lymphomas and systemic inflammation in mice, resembling diseases observed in HTLV-1 infected individuals. In HBZ-transgenic mice, CD4+Foxp3+ T(reg) cells and effector/memory CD4+ T cells increased in vivo. As a mechanism of increased T(reg) cells, HBZ expression directly induced Foxp3 gene transcription in T cells. The increased CD4+Foxp3+ T(reg) cells in HBZ transgenic mice were functionally impaired while their proliferation was enhanced. HBZ could physically interact with Foxp3 and NFAT, thereby impairing the suppressive function of T(reg) cells. Thus, the expression of HBZ in CD4+ T cells is a key mechanism of HTLV-1-induced neoplastic and inflammatory diseases.
Overview
The claims and statistics of this paper haven’t been checked yet.
Run the check — free, no account needed. It reads the open-access text and checks the sources it cites.
Integrity signals
Registry
Cites
Statistics
Figures
Verification
Claims the paper makes
The claims and statistics of this paper haven’t been checked yet.
Run the check — free, no account needed. It reads the open-access text and checks the sources it cites.
Claims other papers make about this one
Each is checked against this paper’s own text: does it say what the citing paper says it does?
The source backs part of the claim, not all of it — or backs it for a different population, condition or comparison.
In the citing paper
“Transgenic expression of HBZ in CD4+ T cells induced leukaemia and lymphoma following a long latent period [145].”
From Current State of Therapeutics for HTLV-1 (2024) · cites this paper as [145]
Experimental — accuracy not yet measured
Self-check
Percentages, sums and reported differences re-computed from the paper’s own numbers.
The self-check needs the paper’s full text.
Citations
Cites
Control of Regulatory T Cell Development by the Transcription Factor Foxp3
Hori, S., Nomura, T., & Sakaguchi, S. (2003) · Science · doi:10.1126/science.1079490 · Cited by 8,187
Self-citationFoxp3 programs the development and function of CD4+CD25+ regulatory T cells
Fontenot, J. D., Gavin, M. A., & Rudensky, A. Y. (2003) · Nature Immunology · doi:10.1038/ni904 · Cited by 7,745
Regulatory T Cells and Immune Tolerance
Sakaguchi, S., Yamaguchi, T., Nomura, T., & Ono, M. (2008) · Cell · doi:10.1016/j.cell.2008.05.009 · Cited by 5,485
Self-citationThe Role of Tumoral FOXP3 on Cell Proliferation, Migration, and Invasion in Gastric Cancer
Zhang, L., Xu, J., Zhang, X., Zhang, Y., Wang, L., Huang, X., & Xu, Z. (2017) · Cellular Physiology and Biochemistry · doi:10.1159/000479442 · Cited by 4,090
CTLA-4 Control over Foxp3 + Regulatory T Cell Function
Wing, K., Onishi, Y., Prieto-Martin, P., Yamaguchi, T., Miyara, M., Fehervari, Z., Nomura, T., & Sakaguchi, S. (2008) · Science · doi:10.1126/science.1160062 · Cited by 2,956
Self-citationAn essential role for Scurfin in CD4+CD25+ T regulatory cells
Khattri, R., Cox, T., Yasayko, S.-A., & Ramsdell, F. (2003) · Nature Immunology · doi:10.1038/ni909 · Cited by 2,860
ANTIBODIES TO HUMAN T-LYMPHOTROPIC VIRUS TYPE-I IN PATIENTS WITH TROPICAL SPASTIC PARAPARESIS
Gessain, A., Vernant, J. C., Maurs, L., Barin, F., Gout, O., Calender, A., & de Thé, G. (1985) · The Lancet · doi:10.1016/s0140-6736(85)92734-5 · Cited by 2,812
Sakaguchi, S. (2005) · Nature Immunology · doi:10.1038/ni1178 · Cited by 2,669
Self-citationHTLV-I ASSOCIATED MYELOPATHY, A NEW CLINICAL ENTITY
Osame, M., Usuku, K., Izumo, S., Ijichi, N., Amitani, H., Igata, A., Matsumoto, M., & Tara, M. (1986) · The Lancet · doi:10.1016/s0140-6736(86)91298-5 · Cited by 2,381
A function for interleukin 2 in Foxp3-expressing regulatory T cells
Fontenot, J. D., Rasmussen, J. P., Gavin, M. A., & Rudensky, A. Y. (2005) · Nature Immunology · doi:10.1038/ni1263 · Cited by 1,819
Cited by
Sorted by citations
Items 201–300 of 315
Suzuki, K., Kusayanagi, S., Kuze, Y., Hata, M., Kozuma, S., Jimbo, K., Nannya, Y., Suzuki, Y., Uchimaru, K., & Yamagishi, M. (2025) · Leukemia · doi:10.1038/s41375-025-02725-0 · Cited by 7
The MicroRNA Regulatory Network in Normal- and HTLV-1-Transformed T Cells
D’Agostino, D. M., Zanovello, P., Watanabe, T., & Ciminale, V. (2012) · Advances in cancer research · doi:10.1016/b978-0-12-394280-7.00002-6 · Cited by 7
Mouse Models for HTLV-1 Infection and Adult T Cell Leukemia
Nakajima, S., & Okuma, K. (2023) · International Journal of Molecular Sciences · doi:10.3390/ijms241411737 · Cited by 7
Novel perspectives on antisense transcription in HIV-1, HTLV-1, and HTLV-2
Lin, E., Panfil, A. R., Sandel, G., & Jain, P. (2022) · Frontiers in Microbiology · doi:10.3389/fmicb.2022.1042761 · Cited by 8
Narulla, M. S., Alsairi, A., Charmier, L., Noonan, S., Conroy, D., Hall, W. W., & Sheehy, N. (2017) · Journal of Virology · doi:10.1128/jvi.00853-17 · Cited by 7
JunB–HBZ nuclear translocation by TGF-β is a key driver in HTLV-1-mediated leukemogenesis
Zhang, W., Shichijo, T., Chen, X., Watanabe, M., Nosaka, K., Matsuoka, M., & Yasunaga, J. (2025) · Proceedings of the National Academy of Sciences · doi:10.1073/pnas.2420756122 · Cited by 6
Self-citationDuchateau, T., Afonso, P. V., & Journo, C. (2025) · Journal of Virology · doi:10.1128/jvi.00601-25 · Cited by 6
Elshafae, S. M., Kohart, N. A., Breitbach, J. T., Hildreth, B. E., & Rosol, T. J. (2021) · Cancers · doi:10.3390/cancers13205066 · Cited by 6
Scott, T. A., Soemardy, C., Ray, R. M., & Morris, K. V. (2023) · NAR Cancer · doi:10.1093/narcan/zcac046 · Cited by 6
Spectrum of Treg and self-reactive T cells: single cell perspectives from old friend HTLV-1
Ono, M., & Satou, Y. (2024) · Discovery Immunology · doi:10.1093/discim/kyae006 · Cited by 6
Self-citationShichijo, T., & Yasunaga, J. (2025) · Current Opinion in Virology · doi:10.1016/j.coviro.2025.101480 · Cited by 6
Self-citationComprehensive genomic analysis identifying heterogeneity in peripheral T‐cell lymphoma
Yoshida, N., Yamada, K., & Ohshima, K. (2021) · Cancer Science · doi:10.1111/cas.14849 · Cited by 6
Self-citationHTLV-1's Foxy Strategy for Survival and Transmission
Higuchi, Y., Yasunaga, J., & Matsuoka, M. (2022) · Frontiers in Virology · doi:10.3389/fviro.2021.792659 · Cited by 6
Self-citationPathology of T-Cell Lymphomas: Diagnosis and Biomarker Discovery
Gru, A. A. (2015) · Cancer treatment and research · doi:10.1007/978-3-319-13150-4_3 · Cited by 6
Chronic Inflammation in Cancer: The Role of Human Viruses
Henning, J. (2015) · Advances in Tumor Virology · doi:10.4137/atv.s19779 · Cited by 6
Foxp3-dependent transformation of human primary CD4+ T lymphocytes by the retroviral protein tax
Chen, L., Liu, D., Zhang, Y., Zhang, H., & Cheng, H. (2015) · Biochemical and Biophysical Research Communications · doi:10.1016/j.bbrc.2015.09.063 · Cited by 6
Naito, T., Ushirogawa, H., Fukushima, T., Tanaka, Y., & Saito, M. (2019) · Virology Journal · doi:10.1186/s12985-019-1270-1 · Cited by 6
Lambert, P. F., & Sugden, B. (2014) · Elsevier eBooks · doi:10.1016/b978-1-4557-2865-7.00011-4 · Cited by 6
Kasugai, Y., Yoshida, N., Ohshima, K., Matsuo, K., Seto, M., & Tsuzuki, S. (2016) · Cancer Science · doi:10.1111/cas.12974 · Cited by 6
Self-citationGois, L. L., Soares, B. N. R. R., Regis-Silva, C. G., Zanette, D. L., Lisboa, R., Nascimento, R. S., Coutinho, R., Galvão‐Castro, B., & Grassi, M. F. R. (2024) · BMC Infectious Diseases · doi:10.1186/s12879-024-09494-8 · Cited by 5
EZH2 Activates HTLV‐1 bZIP Factor‐Mediated TGF‐β Signaling in Adult T‐Cell Leukemia
Zhang, X., Yi, K., Wang, B., Chu, K., Liu, J., Zhang, J., Fang, J., & Zhao, T. (2024) · Journal of Medical Virology · doi:10.1002/jmv.70025 · Cited by 5
Self-citationViral oncogenesis of δ-retroviruses, HTLV-1 and BLV, and recent advances in its diagnosis
Hossain, M. B., Tan, B. J. Y., & Satou, Y. (2025) · Virology · doi:10.1016/j.virol.2025.110461 · Cited by 6
Self-citationReduction of antisense transcription affects bovine leukemia virus replication and oncogenesis
Joris, T., Jouant, T., Jacques, J.-R., Gouverneur, L., Saintmard, X., Mañá, L. V., Jamakhani, M., Reichert, M., & Willems, L. (2024) · PLoS Pathogens · doi:10.1371/journal.ppat.1012659 · Cited by 5
Kuribayashi, W., Takizawa, K., Sugata, K., Kuramitsu, M., Momose, H., Sasaki, E., Hiradate, Y., Furuhata, K., Asada, Y., Iwama, A., et al. (2016) · Oncotarget · doi:10.18632/oncotarget.10210 · Cited by 6
Self-citationSundararaj, S., Seneviratne, S., Williams, S. J., Enders, A., & Casarotto, M. G. (2021) · Protein Science · doi:10.1002/pro.4260 · Cited by 5
The splice 1 variant of HTLV-1 bZIP factor stabilizes c-Jun
Polakowski, N. J., Pearce, M., Kuguyo, O., Boateng, G., Hoang, K., & Lemasson, I. (2020) · Virology · doi:10.1016/j.virol.2020.07.013 · Cited by 5
Human T-Cell Leukemia Virus Type 1 Envelope Protein: Post-Entry Roles in Viral Pathogenesis
Maksimova, V. V., & Panfil, A. R. (2022) · Viruses · doi:10.3390/v14010138 · Cited by 6
Hiraga, K., Tezuka, K., Nagata, K., Koh, K., Nakamura, H., Sagara, Y., Sobata, R., Satake, M., Tanio, M., Hasegawa, H., et al. (2024) · Journal of Virological Methods · doi:10.1016/j.jviromet.2024.115071 · Cited by 4
Yamada, R., Arima, K., Yano, H., Fujiwara, Y., Yamashita, K., Kanemitsu, K., Hanada, N., Yasunaga, J., Iwatsuki, M., Mikami, Y., et al. (2025) · Archiv für Pathologische Anatomie und Physiologie und für Klinische Medicin · doi:10.1007/s00428-025-04074-w · Cited by 4
Self-citationShegefti, S., Alaei, M., Ghahari, N., Telittchenko, R., hanafi, S. B., Isnard, S., Routy, J., Olagnier, D. P., & van Grevenynghe, J. (2025) · Frontiers in Medicine · doi:10.3389/fmed.2025.1653384 · Cited by 4
Biomarkers and Preclinical Models for Adult T-Cell Leukemia-Lymphoma Treatment
Ratner, L. (2019) · Frontiers in Microbiology · doi:10.3389/fmicb.2019.02109 · Cited by 4
Adult T-cell leukemia/lymphoma: molecular pathogenesis, emerging therapies, and future directions
Samaha, Y., Hugo, H. C., & Asrani, R. (2026) · Frontiers in Oncology · doi:10.3389/fonc.2026.1794939 · Cited by 3
Evaluation of ALKBH2 and ALKBH3 gene regulation in patients with adult T-cell leukemia/lymphoma
Wada, Y., Naito, T., Ushirogawa, H., Hatamoto, A., Mizoguchi, Y., Fukushima, T., & Saito, M. (2024) · Virology Journal · doi:10.1186/s12985-024-02590-w · Cited by 3
Human Lymphotropic Viruses: HTLV-1 and HTLV-2
Bruhn, R. L., Mahieux, R., & Murphy, E. L. (2016) · ASM Press eBooks · doi:10.1128/9781555819439.ch33 · Cited by 3
Accolla, R. S. (2022) · Frontiers in Immunology · doi:10.3389/fimmu.2022.940131 · Cited by 3
CRISPR Targeting the Integrated HTLV-1 Virus
Wilkie, T., & Panfil, A. R. (2022) · Springer eBooks · doi:10.1007/978-3-030-93333-3_6 · Cited by 3
Case report of adult T-cell lymphoma/leukemia
de Brito, L. C., Rocha, E. G., dos Santos, S. A. B., & Francês, L. T. M. (2013) · Jornal Brasileiro de Patologia e Medicina Laboratorial · doi:10.1590/s1676-24442013000100007 · Cited by 3
Viral oncogenes drive biphenotypic lymphoproliferative malignancy in transgenic mice
Rauch, D. A., Harding, J., Joseph, A., & Ratner, L. (2025) · Scientific Reports · doi:10.1038/s41598-025-20098-3 · Cited by 2
Reda, O., & Satou, Y. (2026) · Viruses · doi:10.3390/v18010140 · Cited by 2
Self-citationMystery of Human T-cell Leukemia Virus Type 1: Commentary on Two Viral Genes, Tax and HBZ
Yoshida, M. (2014) · Journal of Leukemia · doi:10.4172/2329-6917.1000137 · Cited by 2
Self-citationMethods for Identifying and Examining HTLV-1 HBZ Post-translational Modifications
Al-Saleem, J., Kvaratskhelia, M., & Green, P. L. (2017) · Methods in molecular biology · doi:10.1007/978-1-4939-6872-5_9 · Cited by 2
Self-citationSugahara, K., Yanagihara, T., Nakamura, Y., Nakayama, Y., Hanaoka, K., Ohgushi, M., Ogo, N., Inutsuka, Y., Asoh, T., Harada, Y., et al. (2021) · Cureus · doi:10.7759/cureus.20333 · Cited by 2
Adult T-Cell Leukemia/Lymphoma
Lunning, M. A., Mehta–Shah, N., & Horwitz, S. M. (2020) · Elsevier eBooks · doi:10.1016/b978-0-323-47674-4.00105-5 · Cited by 2
Liu, Z., Larocque, É., Xie, Y., Xiao, Y., Lemay, G., Péloponèse, J., Mesnard, J.-M., Rassart, É., Lin, R., Zhou, S., et al. (2022) · Frontiers in Microbiology · doi:10.3389/fmicb.2022.988944 · Cited by 2
Aspects moléculaires des lymphomes T périphériques (2)
Couronné, L., Bastard, C., Gaulard, P., Hermine, O., & Bernard, O. (2015) · médecine/sciences · doi:10.1051/medsci/20153111017 · Cited by 2
Lambert, P. F., & Sugden, B. (2020) · Elsevier eBooks · doi:10.1016/b978-0-323-47674-4.00012-8 · Cited by 2
The role of HTLV-1 provirus in clonal selection of the infected cells
Matsuo, M., Miyazato, P., & Satou, Y. (2019) · Uirusu · doi:10.2222/jsv.69.23 · Cited by 1
Self-citationHashikura, Y., Izaki, M., Umeki, K., Azeta, M., Kawano, K., Hasegawa, H., Saito, M., & Umekita, K. (2026) · Scientific Reports · doi:10.1038/s41598-026-74231-x · Cited by 1
m 6 A RNA Modification Controls HTLV ‐1 Tax and Host Gene Expression
Higa, R., Gibu, K., Suzuki, K., Tanaka, Y., Uchimaru, K., & Yamagishi, M. (2025) · Genes to Cells · doi:10.1111/gtc.70054 · Cited by 1
Association Between FOXP3 and OX40 Expression in Adult T-Cell Leukemia Cells
Mizuguchi, M., Takahashi, Y., Tanaka, R. J., Imaizumi, N., Yamashita, A., Matsushita, N., Fukushima, T., & Tanaka, Y. (2025) · Viruses · doi:10.3390/v17111445 · Cited by 1
Viral-driven oncogenesis in T/NK-cell lymphomas: parallels and divergences between HTLV-1 and EBV
Shichijo, T., & Yasunaga, J. (2026) · International Journal of Hematology · doi:10.1007/s12185-025-04156-0 · Cited by 1
Self-citationHuman T-Cell Leukemia Virus Type 1 (HTLV-1)
Fujisawa, J. (2017) · Springer eBooks · doi:10.1007/978-4-431-56523-9_2 · Cited by 1
Shiohama, Y., Naito, T., Matsuzaki, T., Tanaka, R. J., Tomoyose, T., Takashima, H., Fukushima, T., Tanaka, Y., & Saito, M. (2017) · Virology Journal · doi:10.1186/s12985-017-0802-9 · Cited by 1
Les protéines antisens des virus HTLV
Caté, C., Larocque, É., Péloponèse, J., Mesnard, J.-M., Rassart, É., & Barbeau, B. (2018) · Virologie · doi:10.1684/vir.2018.0737 · Cited by 1
Evaluation of CLOCK and CSNK1D Function in Circadian Rhythm Signaling Pathways in HTLV-1 Carriers
Ekhtiari, M., Bastan, F., Rashidian, M., Safavi, M., Yaslianifard, S., Ashrafi, J., Kermanian, F., & Mozhgani, S. (2023) · Future Virology · doi:10.2217/fvl-2023-0050 · Cited by 1
Sudo, H., Tonoyama, Y., Ikebe, E., Hasegawa, H., Iha, H., & Ishida, Y.-I. (2024) · Leukemia Research · doi:10.1016/j.leukres.2024.107454 · Cited by 1
Lima, A. C. M. M., Silva, D. I. B. D. S., Campos, R. F., Andrade, F. D. O., Nascimento, J. O. D. S., Santana, C. S., Barreto, L. N., Cucco, M. S., Borba, M. M. N., Costa, D. T., et al. (2024) · Journal of Medical Virology · doi:10.1002/jmv.29912 · Cited by 1
Glycan Profiling of Adult T-Cell Leukemia (ATL) Cells with the High Resolution Lectin Microarrays
Iha, H., & Yam, M. (2013) · InTech eBooks · doi:10.5772/55386 · Cited by 1
A historical personal perspective on human retroviruses and their infection of T cells
Gallo, R. C. (2014) · Transfusion · doi:10.1111/trf.12935 · Cited by 1
HTLV-1 pathogenesis mediated by HTLV-1 bZIP factor
Satou, Y. (2012) · Uirusu · doi:10.2222/jsv.62.113 · Cited by 1
Self-citationQuantitatively immunological characterization of mogamulizumab skin disorders in ATL patients
Ito, A., Suzuki, Y., Masaki, A., Yoshida, S., Suzushima, H., Takemoto, S., Utsunomiya, A., Ishii, T., Hiura, M., Takahashi, T., et al. (2019) · Journal of Cutaneous Immunology and Allergy · doi:10.1002/cia2.12070 · Cited by 1
Astute strategies of HTLV-1 with driven viral genes
Toyoda, K., Yasunaga, J., & Matsuoka, M. (2019) · Uirusu · doi:10.2222/jsv.69.37 · Cited by 1
Self-citationLima, A. C. M. M., da Silva, G. C. S., Barreto, F. K., Rego, F. F. D. A., Gois, L. L., & Santos, L. A. (2021) · Asian Pacific Journal of Tropical Medicine · doi:10.4103/1995-7645.321609 · Cited by 1
Uchimaru, K. (2017) · Springer eBooks · doi:10.1007/978-4-431-56523-9_5 · Cited by 1
Th17 Cells and Tregs in HTLV-1 Infection
Saghafi, N., Elham, A., & Mofrad, M. H. (2022) · Journal of Clinical and Nursing Research · doi:10.26689/jcnr.v6i3.3757 · Cited by 1
Human T-Cell Lymphotropic Viruses
Switzer, W. M., Heneine, W., & Owen, S. M. (2015) · ASM Press eBooks · doi:10.1128/9781555817381.ch83 · Cited by 1
Mechanisms of T‐cell Lymphomagenesis
Lemonnier, F., Gaulard, P., & de Leval, L. (2021) · Wiley eBooks · doi:10.1002/9781119671336.ch2 · Cited by 1
Animal Models of T‐cell Lymphoma
Hattori, K., Shrestha, R., Sakamoto, T., Kusakabe, M., & Sakata‐Yanagimoto, M. (2021) · Wiley eBooks · doi:10.1002/9781119671336.ch4 · Cited by 1
Sato, T., Araya, N., Yagishita, N., Ando, H., & Yamano, Y. (2011) · InTech eBooks · doi:10.5772/23265
Miranda, A. C. A. M. (2012) · Americanae (AECID Library)
Molecular analysis of HTLV-2 APH-2 in viral transformation, persistence and host immune response
Yin, H. (2011) · OhioLink ETD Center (Ohio Library and Information Network)
Sézary‐Syndrom: von ungelösten Fragen zu neuen Therapieansätzen
Nicolay, J. P., Felcht, M., Schledzewski, K., Goerdt, S., & Géraud, C. (2016) · JDDG Journal der Deutschen Dermatologischen Gesellschaft · doi:10.1111/ddg.12900_g
Koyanagi, Y. (2011) · Uirusu · doi:10.2222/jsv.61.175
Signaling Pathways in Rare Lymphomas
Lipsky, A. H., Pérez‐Galán, P., Agostinelli, C., Piccaluga, P. P., Pileri, S. A., & Wiestner, A. U. (2014) · Springer eBooks · doi:10.1007/978-3-642-39590-1_4
Human T-Cell Leukemia Virus Type 1: Pathogenesis and Host Immune Response
Yasunaga, J., & Matsuoka, M. (2014) · Springer eBooks · doi:10.1007/978-1-4939-0870-7_10
Self-citationAdult T-cell Leukemia/Lymphoma (ATLL) (the former part)
Omoto, D., & NAKAMURA, M. (2015) · The Nishinihon Journal of Dermatology · doi:10.2336/nishinihonhifu.77.385
Matsuoka, M. (2016) · PubMed · doi:10.11406/rinketsu.57.2183
Self-citationII. Leukemogenesis and Mechanisms of HTLV-1 Replication and Infection
Matsuoka, M., & Yasunaga, J. (2017) · Nihon Naika Gakkai Zasshi · doi:10.2169/naika.106.1376
Self-citationOncoviruses: Viruses Role in Common Human Tumors
Abumsimir, B., & Ennaji, M. M. (2019) · Elsevier eBooks · doi:10.1016/b978-0-12-819400-3.00017-x
Human Microbiome and Malignancy: Principles, Mechanisms, and Challenges
Ruwali, M., & Shukla, R. (2019) · Springer eBooks · doi:10.1007/978-981-32-9449-3_16
Recent topics in epidemiologic, basic and clinical research
Yasunaga, J., & Matsuoka, M. (2013) · Uirusu · doi:10.2222/jsv.63.165
Self-citationTherapeutic innovations in adult T leukemia/lymphoma
Hajj, H. E., Hermine, O., & Bazarbachi, A. A. (2020) · Hématologie · doi:10.1684/hma.2020.1590
Is it NICE (Nuclear Import as a Carcinogenic Mechanism) to restrict HBZ in the cytoplasm?
Tagaya, Y. (2021) · Haematologica · doi:10.3324/haematol.2021.278377
Maseko, S. B., Molle, I. V., Blibek, K., Gorgulla, C., Olivet, J., Blavier, J., Vandermeulen, C., Skupiewski, S., Saha, D., Ntombela, T., et al. (2021) · bioRxiv (Cold Spring Harbor Laboratory) · doi:10.1101/2021.08.25.457680
Reflections on Some of the Exceptional Features of HTLV-1 and HTLV-1 Research: A Perspective
Gallo, R. C., & Tagaya, Y. (2022) · Frontiers in Immunology · doi:10.3389/fimmu.2022.859654
Targeting vulnerabilities of adult T-cell leukemia
Matsuoka, M. (2022) · Blood · doi:10.1182/blood.2021014879
Self-citationBangham, C. R. M. (2011) · Wiley eBooks · doi:10.1002/9780470015902.a0023613
Gallo, R. C., & Reitz, M. S. (2022) · Wiley eBooks · doi:10.1002/9781119000822.hfcm028.pub2
General introduction oncogenic viruses: recent knowledge
Ennaji, M. M. (2023) · Elsevier eBooks · doi:10.1016/b978-0-12-824152-3.00005-6
Tiabi, I., Nabil, S. A., Abumsimir, B., Benchekroun, M. N., & Ennaji, M. M. (2023) · Elsevier eBooks · doi:10.1016/b978-0-12-824152-3.00019-6
Preface—Oncogenic Viruses: Up To Recent Knowledge
Ennaji, M. M. (2023) · Elsevier eBooks · doi:10.1016/b978-0-12-824156-1.00019-4
Parasitism and Molecular Implication of HTLV-1 Pathogenesis
Almalki, S. R. (2023) · Egyptian Academic Journal of Biological Sciences. E, Medical Entomology and Parasitology · doi:10.21608/eajbse.2023.292468
Gallo, R. C., & Reitz, M. S. (2017) · Wiley eBooks · doi:10.1002/9781119000822.hfcm028
Silva, L. B. D. M., Araújo, G. F., de Moura, P. M. M. F., & Bezerra-Neto, J. P. (2025) · Lecture notes in computer science · doi:10.1007/978-3-032-09336-3_4
Tonoyama, Y., & Ishida, Y.-I. (2025) · Lymphatics · doi:10.3390/lymphatics3040038
Pinninti, S. S., Govindaraju, S., & Nallagatla, H. (2025) · Elsevier eBooks · doi:10.1016/b978-0-443-33302-6.00006-8
Gois, L. L., Soares, B. N. R. R., Regis-Silva, C. G., Zanette, D. L., Lisboa, R., Nascimento, R. S., Coutinho Junior, R., Galvão-Castro, B., & Grassi, M. F. R. (2024) · Figshare · doi:10.6084/m9.figshare.26129756
Analysis of the association between adult T-cell leukemia/lymphoma and gut microbiome
千葉, の., & Chiba, N. (2025) · Institutional Repositories DataBase (IRDB)
Metadata
- Authors
- Satou, Y., Yasunaga, J.-I., Zhao, T., Yoshida, M., Miyazato, P., Takai, K., Shimizu, K., Ohshima, K., Green, P. L., Ohkura, N., Yamaguchi, T., Ono, M., Sakaguchi, S., & Matsuoka, M.
- Affiliations
- Kyoto University (JP)
- Kurume University (JP)
- The Ohio State University (US)
- Corresponding author
- Matsuoka, Masao
- ORCID
- Venue
- PLoS Pathogens
- Publisher
- Public Library of Science (PLoS)
- Published
- 2011-02-10
- Volume
- 7
- Issue
- 2
- Pages
- e1001274
- ISSN
- 1553-7366 (ISSN-L)
- 1553-7374
- PMC
- PMC3037353
- OpenAlex
- W1966278500
- Cited by
- 319
- References
- 58
- Citations by year
- 2026: 10 · 2025: 18 · 2024: 11 · 2023: 15 · 2022: 27 · 2021: 31 · 2020: 21 · 2019: 19 · 2018: 14 · 2017: 32 · 2016: 21 · 2015: 19 · 2014: 19 · 2013: 21 · 2012: 22
- FWCI
- 11.50
- Type
- journal article
- Language
- en
- Open access
- gold
- doi.org
- Locations
- PLoS Pathogens (publishedVersion, cc-by)
- PubMed Central (publishedVersion, cc-by)
- PubMed (publishedVersion)
- Institutional Repositories DataBase (IRDB) (submittedVersion, other-oa)
- DOAJ (DOAJ: Directory of Open Access Journals) (submittedVersion, cc-by-sa)
- UCL Discovery (University College London) (submittedVersion)
- Figshare (submittedVersion, cc-by)
- Kyoto University Research Information Repository (Kyoto University) (submittedVersion, cc-by)
- Funders
- Naito Foundation
- Sumitomo Foundation
- Uehara Memorial Foundation
- National Institutes of Health
- Japan Society for the Promotion of Science (22390193)
- National Cancer Institute (CA077556, R01CA077556)
- Topics
- Life Sciences › Immunology and Microbiology › Immunology › T-cell and Retrovirus Studies
- Life Sciences › Immunology and Microbiology › Immunology › T-cell and B-cell Immunology
- Health Sciences › Medicine › Oncology › Viral-associated cancers and disorders
- Keywords
- HTLV-1, bZIP transcription factors, HBZ, adult T-cell leukemia/lymphoma, T-cell lymphoma, regulatory T cells, Foxp3, NFAT, systemic inflammation, CD4+ T cells, transgenic mice, HTLV-1-associated myelopathy/tropical spastic paraparesis, transcriptional regulation
- MeSH terms
- Adult, Animals, Cell Transformation, Viral, Cells, Cultured, Gene Expression Regulation, Humans, Inflammation, Mice, Inbred C57BL, Mice, Transgenic, Human T-lymphotropic virus 1, HTLV-I Infections, CD4-Positive T-Lymphocytes, Lymphoma, T-Cell, Basic-Leucine Zipper Transcription Factors, Mice
About these checks
Registry, retraction, Cites and statistics results are computed, not judged, with one exception: a printed reference that no index lists is read once by a model before it counts as a citation error. Claims are extracted by a model and kept only when their quote appears verbatim in the text; each cited source is then checked, with a model’s help, for whether it says what the claim relies on. Those verdicts can be wrong — read the claim’s quote and the cited source before relying on one.
Statistics and arithmetic are recomputed, not judged.
Confidence bands are shown only for fields calibrated on our annotated test set. None is calibrated yet, so no band is shown.
What counts as a claim ›How we measure confidence ›How we check this ›
Are you an author, or do you see a problem with this page? Request a review
